it seems that every week a new price action strategy pops up some new trend lines liquidity grabs Fibonacci tweaks you name it and let's be real it can get overwhelming fast but what if you had a toolkit that could cut through this noise giving you the most critical Concepts in a powerful way well that's exactly why we built the price action Concepts tool kit it's not just another trading tool it's your all-in-one system for decoding price action in real time and by the end of this video you'll see exactly how it works and why Traders
at every level are making it a must have let's dive in at its core trading is all about price action the movement of price over time no matter the strategy volume footprint analysis TPO charts or any other method for that matter price action is the common thread that ties everything together yet mastering it can feel elusive that's where the Lux algo price action Concepts toolkit comes in it takes complex market dynamics and simplifies them into clear actionable insights and to do this we start with Market structure Market structure is the backbone of price action analysis
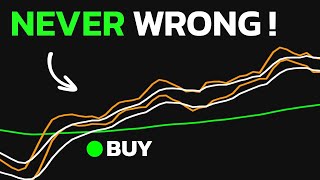
it is a simple and clear way to identify both macro and micro Trends in order for us to simplify this for Traders the price action Concepts toolkit automatically plots key labels at the most important turning points in price so let's break down how that works an uptrend forms when the market creates higher highs and higher lows when a higher low is broken the toolkit plots a bearish change of character label meaning we might be entering a bare Market likewise in a downtrend when a lower high is broken a a bullish change of character appears hinting
at a possible bullish Market however majority of the time the trend doesn't reverse and instead continues in One Direction and that's where a break of structure label is formed this confirms that the market is following through with the initial Trend shift and is often used as a confirmation to get into trades so to keep things visually intuitive these labels are colorcoded based on the anticipated direction of the structure change but if you would like to take it a step further you can also enable color candles this will shade your chart candles based on the structure
labels green candles for a bullish Trend and red candles for a bearish trend so that's it for structure [Laughter] right you serious you see an experienced Trader knows that Trends exist within Trends and this can cause you to enter a trade after a change of character or break of structure only for it to turn out to be a retracement within a much larger move so to help Traders tackle this we provide two versions of Market structure the swing structure is otted with solid lines and accounts for more data highlighting major macro moves while internal structure
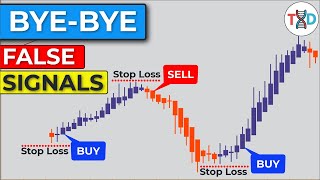
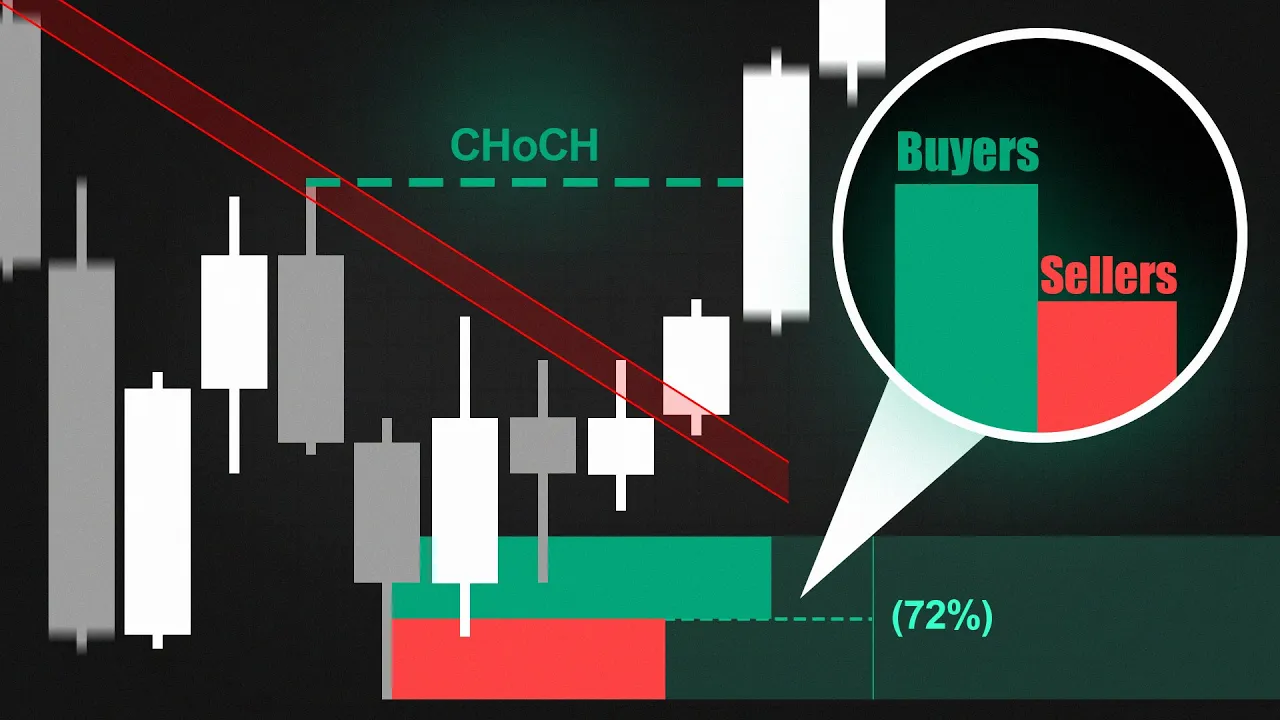
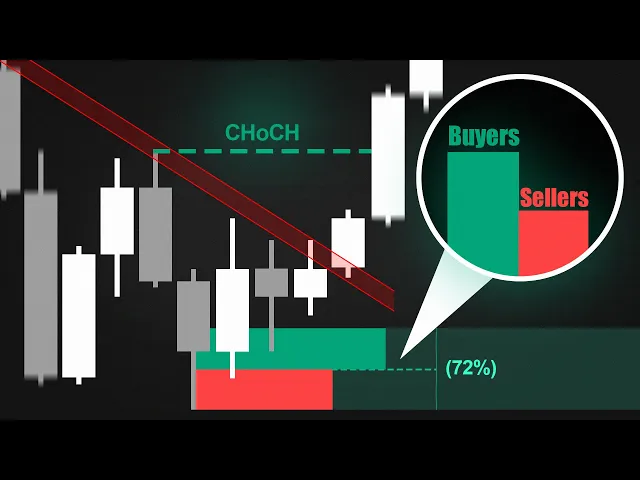
identified by dashed lines uses less data and captures smaller structure fluctuations within the larger Trend by using both versions you can confidently assess Market structure and ensure your decisions to enter a trade are aligned with the broader Market Direction once we had the market structure implemented it was time to tackle the next crucial element support and resistance levels these are key price zones where price is expected to react making making them essential for Traders when setting stop losses or identifying target areas nearly every Trader uses this concept in some form with the most common approach
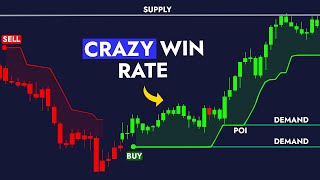
being key swing points as reference levels but we decided to take a different approach based on our research the most effective and widely used method for detecting support and resistance levels is through order blocks these are zones where Market orders accumulate before a significant move acting as hot spots of institutional activity however we didn't stop at just regular order blocks we introduced volumetric order blocks this enhancement not only highlights where orders are clustering but also provides insight into buying and selling activity at those levels additionally we gave users the flexibility to adjust the time frame
for these levels and even detect breaker blocks adding another layer of Market intelligence this has become one of the most popular features in our toolkit for a deeper dive into how it was developed check out our dedicated video on order blocks and next we dove into liquidity Concepts liquidity is the heartbeat of the market it refers to how easily a Market can be bought or sold after all trading isn't possible without someone on the other end willing to buy or sell so market levels of high liquidity often end up being where Traders stop losses are
placed this creates Prime opportunities for market makers the price action Concepts tool kit brings liquidity to life every feature within this category is built with the intent of how users can make trading decisions at these liquidity zones because trading isn't just about identifying liquidity it's about understanding how the market reacts to it let's break down the features available first we have liquidity trend lines these Dynamic zones adapt to real-time liquidity readings zones will only appear when Market participants have actively sought liquidity there Traders use these areas as reaction points either to continue an existing Trend
or wait for a break to spot potential reversals and then we have pattern detection the toolkit identifies a number of bullish and bearish chart patterns in real time to make decision- making easier there is also a dashboard displaying the name and type of pattern detected for instance if a descending triangle appears the first thing to note is that this is a bearish pattern it signals sellers attempting to push prices lower a trigger for this setup is waiting for the support to break and for the price to start closing below that zone before considering a trade
we also have the equal highs and lows feature which highlights Market areas that are at relatively the same level these are most significant when they occur in wellestablished and clear uptrends or downtrends because they can mark the very top or bottom of the market once one is detected the the idea is to wait and see if it is followed by a market structure shift in the opposite direction of that Trend making them perfect for an early warning sign of a reversal and finally for this category we have liquidity grabs this is an advanced way of
potentially identifying Market manipulation this feature first identifies liquidity zones and then detects any unusual price action within those areas if such activity is detected a bullish liquidity grab appears in blue while a bearish grab appears in red this often indicates that the market could start moving strongly in either direction of the grab if both occur in relatively the same area it could indicate a higher likelihood of a ranging Market in which case you should avoid Trend trading strategies now that we have a solid understanding of liquidity Concepts it's time to tackle another crucial category imbalances
these often occur as price moves toward or away from liquidity areas creating gaps where supply and demand becomes unevenly distributed these imbalances in the market will need to be corrected and as such they can act like magnets pulling price back to fill these voids so recognizing the importance of imbalances we didn't just Implement one we integrated five of the most significant types this includes three major types of fair value gaps volume imbalances and opening gaps simply select the ones you want and they'll be instantly highlighted on your chart as mentioned earlier price reacts to these
zones much like a magnet to metal making them ideal levels to set targets or to place your stop loss if being used as an entry method Traders will often wait for a reaction off these key levels before executing the trade many of these trades will take place between Surplus and deficit zones to navigate these areas effectively you need a way to identify these areas this is where the premium and discount feature comes in the premium and discount tool simplifies this by dividing the market into overbought premium and oversold discount areas giving you a clear visual
representation of whether price is trading at a favorable level for entry or exit on top of this feature there are many cyc ological levels in trading that are widely used in price action strategies Traders can enable key price levels such as Monday's high and low previous monthly levels and other significant reference points additionally we've recently introduced a Fibonacci tool but we took it a step further than a standard implementation instead of Simply plotting fixed retracements we allow traders to Anchor Fibonacci levels between major points on the chart using almost any feature within the toolkit whether
you want Fibonacci levels drawn from the premium and discount zones or between the high and low of an imbalance the possibilities are endless so now that we've explored all the features of the price action Concepts let's talk about the glue that ties everything together alerts staying ahead in the market is all about timing and we've made sure our alert system covers every angle to keep you informed when it matters most the toolkit offers four types of alerts pre-built alerts ready to go for a quick setup any alert function calls perfect for combining multiple features into
a single customizable alert custom alert creators offers more flexibility in combining alerts and introduces the ability to set alerts based on sequences the allnew alert scripting feature allows you to build alerts from the ground up with ultimate flexibility perfect for advanced users because alerts are such a GameChanger we've dedicated fulllength videos to breaking down each alert type in detail showing you exactly how to set them up and optimize them for your trading strategy so no matter what kind of a Trader you are you'll always be in the loop and ready to act now you can
see that what sets the price action Concepts toolkit apart is that this isn't just a collection of features it's a thoughtfully designed system that simplifies your analysis and helps you trade more effectively from identifying Market structure to spotting liquidity zones imbalances and key levels everything is designed to give you a comprehensive view of the market you can access this toolkit directly on our website at Lux algo.com it's included in all three of our plans essential premium and ultimate if you opt for the ultimate plan you unlock even more powerful features you'll gain access to the
price action Concepts back tester allowing you to fully back test every feature within this toolkit and exclusive access to the first of its kind AI back testing assistant an intelligent platform that understands the price action Concepts toolkit inside and out helping you uncover the most profitable strategies this toolkit has to offer by simply asking questions within the interface we hope you enjoyed this video and learn something new thank you for watching and until next time


![Lyn Alden: "This Changes Everything For Bitcoin & Crypto" [New 2026 Bitcoin and Crypto Prediction]](https://img.youtube.com/vi/83FKr3wwWHE/mqdefault.jpg)