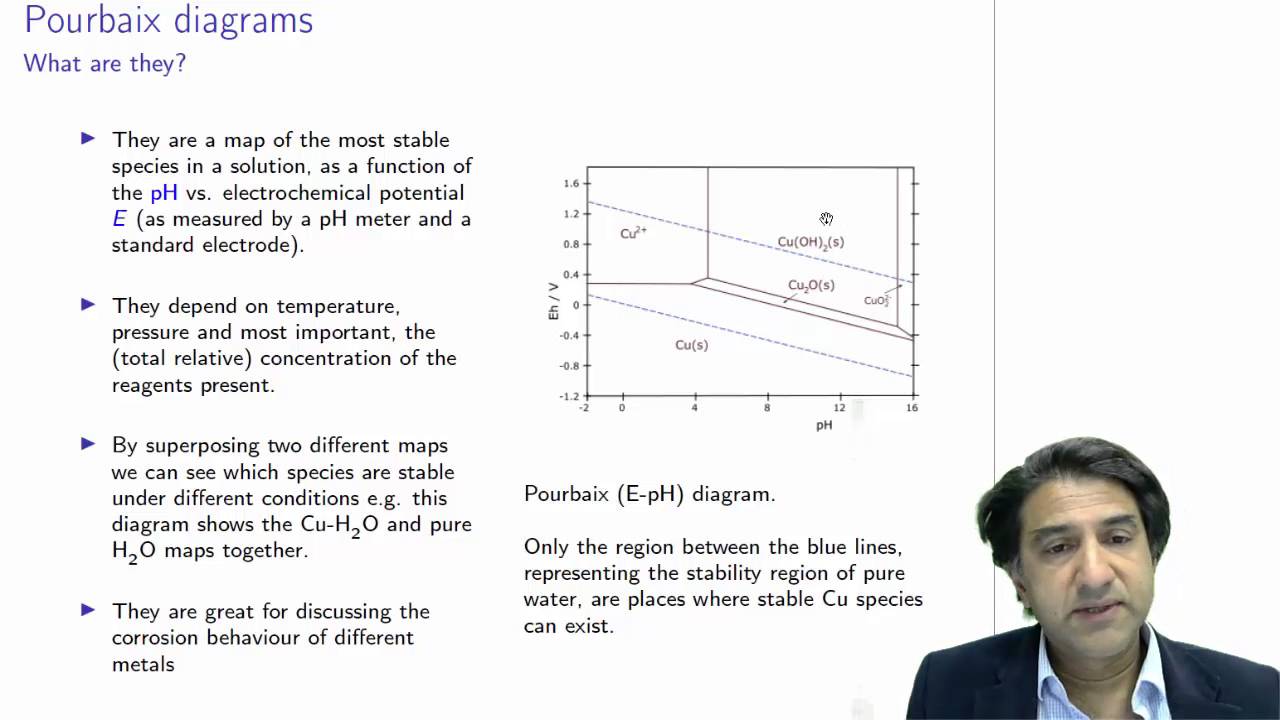
Hello everyone, this is Professor Thiago and in this video we will present the deduction of the Pourbaix diagram for iron. Pourbaix diagrams are diagrams of electrical potential by pH that indicate the regions where the metal is immune, passivated or corrodes in pure water. These diagrams are called Pourbaix after the Belgian chemist Marcel Pourbaix, who developed and popularized them.
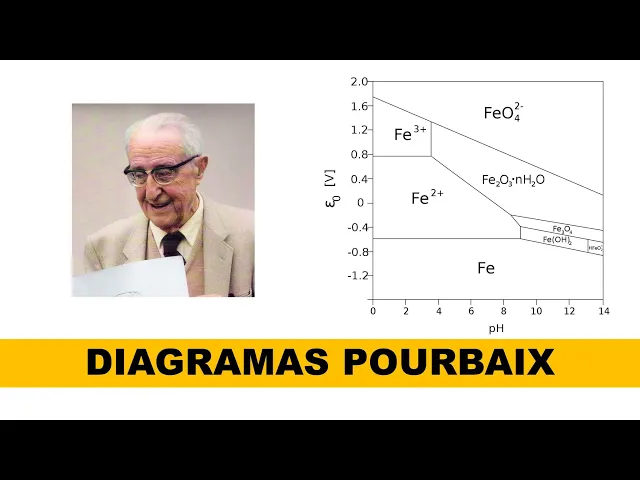
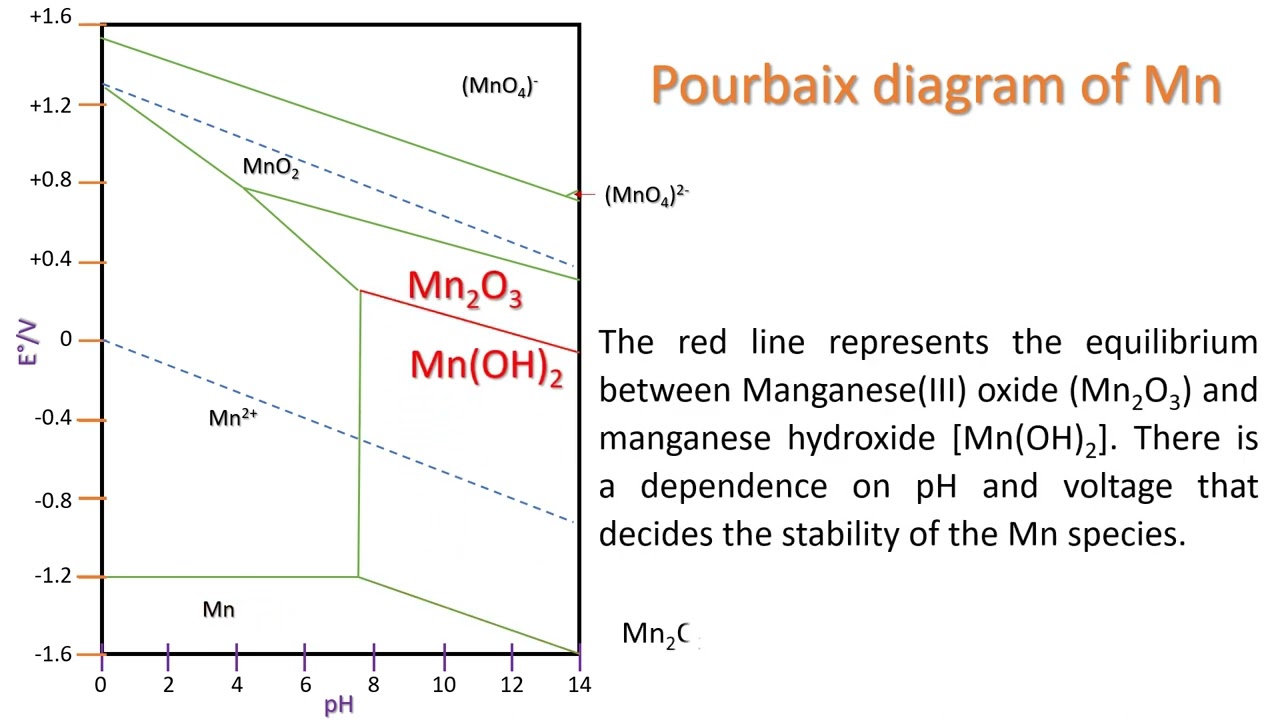
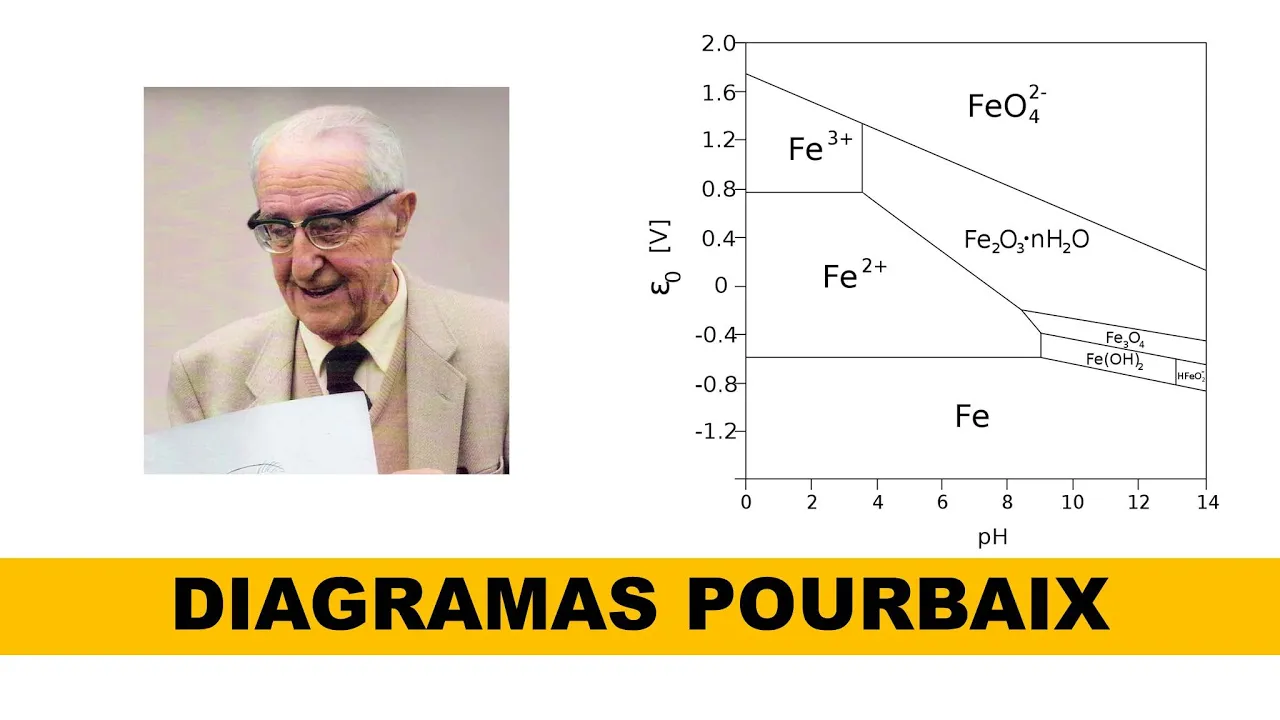
In essence, Pourbaix diagrams are thermodynamic diagrams, that is, they do not give any information regarding the speed of processes. They are built based on the Nernst equation and show the chemical species that are thermodynamically more stable in certain regions of potential and pH. Shown here is the Pourbaix diagram of iron where you can observe the region in which metallic iron is most stable, that is, the region of immunity.
The region of greatest stability of the Fe2+ ion, and the region of greatest stability of the Fe3+ ion, as well as certain compounds that can be formed by the reaction of iron with water. Similarly to what is observed in a phase diagram, on the lines of the Pourbaix diagrams there are two chemical species in equilibrium, and in the areas there is a certain chemical species that is more stable. The horizontal lines in the diagram indicate the oxidation-reduction processes of the metal that do not vary with pH, that is, pure oxidation/reduction processes.
For iron, we have the reduction of Fe2+ to Fe, with a standard potential of -0. 404 V and the reduction of Fe3+ to Fe2+ with a standard potential of 0. 711 V.
As these half reactions do not involve H+ or OH-, they are independent of pH and are represented in the figure by black and red lines. These horizontal lines separate the regions where metallic iron is more stable, Fe2+ is more stable and Fe3+ is more stable, as shown in the figure. We can also demonstrate the fact that these lines do not vary with pH according to the Nernst equation, which, for 25 °C, can be described as shown here.
For the reaction of reducing Fe2+ to Fe, we have the equation shown and, for reducing Fe3+ to Fe2+, we have the following equation. An important point to keep in mind is that the entire Pourbaix diagram is built for a certain activity. The most used activity is equal to 1, so the logarithm terms of the equations become null and we observe potential will be equal to standard potential.
It is very common to find Pourbaix diagrams that show several lines, as shown below. In these cases, each of these lines is for a different activity since activity 1, for practical applications, is not very desirable, so it is common to use smaller activities. In this case, for the reduction reaction of Fe2+ to Fe, more negative potentials are always obtained.
Generally the lines vary in decades, that is, an order of magnitude, times 10. For example: 1; 0. 1, and 0.
01 as shown by the arrows in the figure for the reaction of Fe2+ to Fe. In pure water both Fe2+ ions and Fe3+ ions can react with water forming oxides and hydroxides. For Fe3+, the following reaction occurs, which results in the formation of Fe3+ hydroxide.
This reaction does not involve the exchange of electrons and, for a given activity of Fe3+, at equilibrium, there is a fixed pH. In other words, at equilibrium there will be a quantity of H+ ions that will result in a certain pH. Therefore, in the iron Pourbaix diagram, this balance will be represented by a vertical line and will indicate the separation of the area in which Fe3+ is more stable from the area in which iron hydroxide is more stable.
This is shown in this figure by the blue line that separates the area of greater Fe3+ stability from the area of greater iron hydroxide stability. It is observed that hydroxide can form oxides, according to the following reaction, the reaction shown here on the side. This is why iron hydroxide/oxide is often shown.
The Fe2+ ion also reacts with water according to the reaction shown below. This reaction involves both the H+ ion and electrons. Therefore, the line representing the equilibrium of this reaction will be neither vertical nor horizontal.
The slope of this line is obtained by the Nernst equation. The Nernst equation for this equation is written, which can be rearranged in several steps to write the following. For a given constant value of Fe2+ activity, the term E° - 0.
059Vlog(aFe2+) will be a constant, which results in the potential being equal to a constant - 0. 177VpH. Therefore, the line that represents the equilibrium of this reaction, in a pH potential diagram, will have a slope of -0.
177V. And it is shown here in the diagram, by the green line, the negative slope separating the area of greater stability of the Fe2+ ions from the area of greater stability of the hydroxide and oxide. Proceeding in a similar way for the other regions of the diagram, we arrive at a Pourbaix diagram of the iron shown initially.
It is also very common to represent Pourbaix diagrams indicating the areas of immunity, corrosion and passivity. The region of immunity is the one where the metal does not suffer corrosion, that is, where the chemical species with the greatest stability is Fe; the region of corrosion is the one in which the most stable species are ions that do not form products, salts, insolubles and adherents; and the passivity region is the one where a more stable compound is formed. It is assumed to be passivity because the stable compound can adhere to the metal surface and protect it from future corrosive processes.