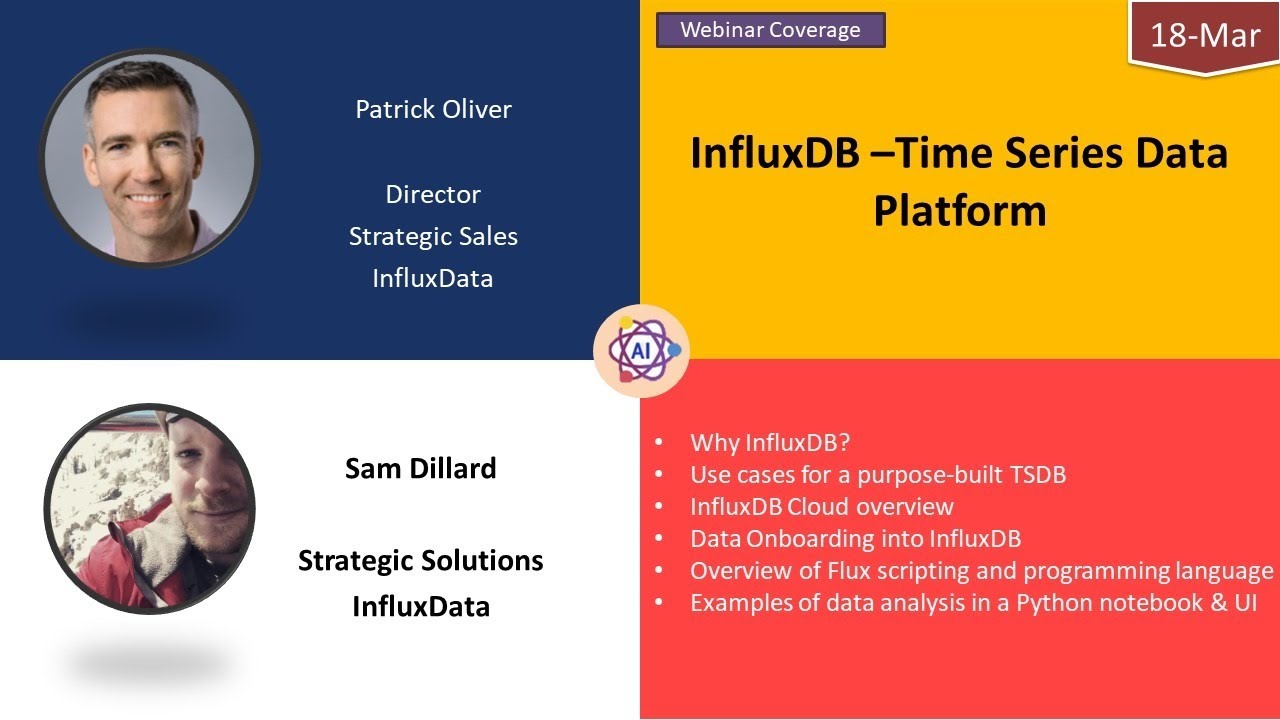
hi guys my name is trevor sullivan welcome to this cbt nugget skill where we're going to be learning all about the influx db open source time series database engine now why would you want to use a time series database engine well before we get to that let's first talk about some of the other database engine types that are available for example there are different database platforms depending on what type of data you're storing for example i developed another skill on the neo4j graph database engine which allows you to create nodes and relationships between those nodes
so that you can graph and display highly relational data now there's also the traditional notion of a relational database which typically refers to table-based storage where you have lots of different tables and then rows of data in each table and those tables can be related to each other using primary and foreign keys now there's also other types of databases called document databases and sometimes these are known as nosql or not only sql databases and if you think about it a graph database is actually kind of the same thing it's not a equal database it's a
graph database well the thing with document databases is that instead of storing data as tables and rows or as nodes and relationships instead you create a table and you create lots of different documents inside of there and each of those documents can basically more or less be self-describing as long as there's no implied relationships between the different documents now if you're interested in learning more about different types of database platforms one of our other trainers nox hutchinson has created a skill specifically talking about the different types of database engines available out there now why specifically
would you want to use a time series database engine well we use time series database engines when we want to graph data over a period of time hence the name time series now in the it software world there is a very common use case for systems monitoring using time series database engines for example an it systems administrator or engineer may be interested in monitoring the cpu utilization the memory and disk and network utilization of the virtual machines that make up their infrastructure once they've captured that time series data about their cpu memory network and disk
utilization they can then make decisions based on the amount of utilization of each of those resource types that is being displayed for example if you see that your cpu is being very low utilized and your disks are being very highly utilized then you may want to increase your disk capacity or increase the performance of your physical storage disks now there's a lot of other interesting use cases for time series data as well for example imagine the iot or the internet of things world the iot world kind of i like to think of it as kind
of bridging the gap between the software kind of virtual world and the physical world over here so there's different things in the physical world that we want to monitor such as light wind temperature humidity and even things like earthquakes for example all of these things can be represented in a time series database engine as well so that you can see the performance of differ the characteristics rather of different natural elements over time in fact recently i actually built out a solution that you can read about on my website at trevorsullivan.net that describes how i connected
a solar charge controller that harvests energy from solar power panels and actually pulls that data into the influx db time series engine so that i can monitor the performance and the output of those solar panels as well as the battery array that's connected to those solar panels to provide the energy storage over time as well now if you work in something like a factory environment you might want to be keeping tabs on the noise levels to ensure that the employees who are working inside of the factory are not subjected to unnecessarily loud noises now not
only would you want to monitor the noise level in one location but in a large factory you would want to monitor the noise level in many different locations so you may have hundreds or even thousands of different sensors all in different locations within a factory environment that are monitoring the unique noise levels at each spot in the factory now also if you were responsible for monitoring the mining conditions inside of a mining environment you might be interested in things like the air quality level so that the miners who are working inside of that mine are
not having to be subjected to unclean air that could compromise their personal health you may also want to monitor nearby earthquake activity to ensure that earthquakes do not interfere with the operations of the mine and the health and safety of the mine workers suffice it to say no matter what industry you work in or no matter what kind of use case you have for gathering and storing and graphing and consuming time series data the more data you have the better decisions that you can potentially make as a direct result of that data now let's talk
about some of the other tools that surround the ecosystem of influx db because influx db itself is a time series database storage engine where you can ingest metrics into that storage engine however it also provides the ability to create graphs and dashboards and even alerting integrations so that you can get notified when a particular metric exceeds a user-defined threshold so one of the other tools that you might come across is called prometheus prometheus is another metric storage engine but it doesn't have some of the user interface capabilities that influx db has now if you do
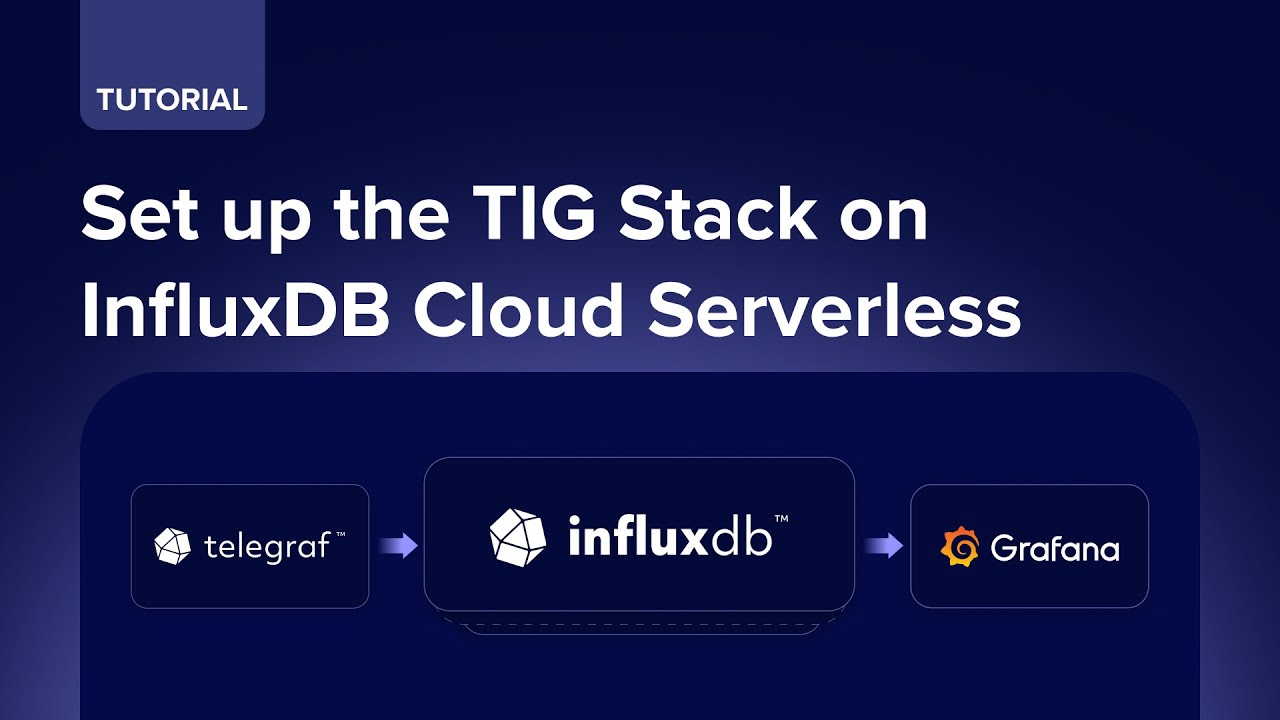
want to provide some more advanced visualizations and you want a generic solution that doesn't just work with influx db but also works across a variety of other tools you can look at grafana and grafana is an open source engine tool that allows you to create graphs of data that are that is ingested from many different sources including influx db you can actually run in flux db but then use the grafana tool to actually graph the performance metrics that are being stored in the influx db engine if you use another tool you might come across in
the ecosystem is called google data studio now google data studio is really cool because it basically allows you to inside of a web interface to create different graphs and tables of the data that is stored in many different types of systems finally one other tool that i'd like to call your attention to which we might take a look at in this skill is the influx db cli tool in addition to the influx db engine itself or the daemon that runs in the background and actually runs the storage engine there's also a client-based influx cli that
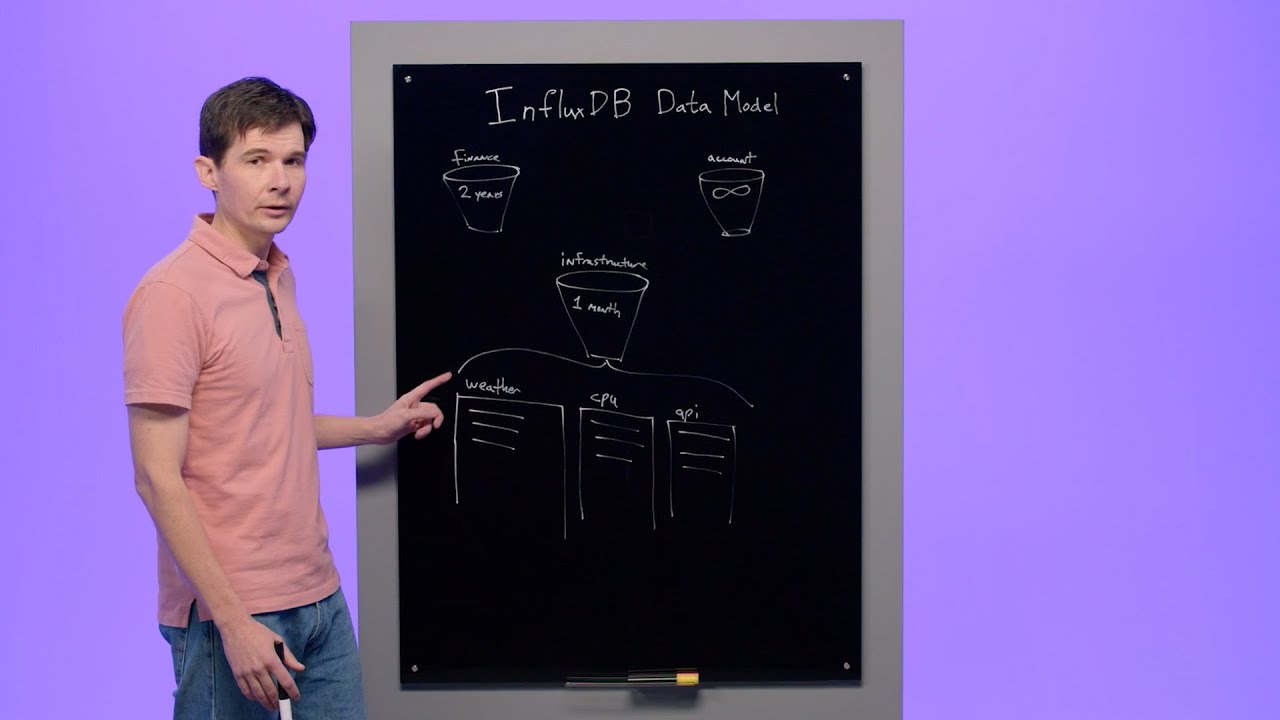
allows you to read and write data points into the database engine so what can you expect to learn in the remainder of the cbt nugget skill well first of all we're going to take a look at some of the basic concepts behind influx db and how data is ingested and stored into the influx db engine we're also going to spin up the influx db service using the docker desktop tool which makes it really easy to spin up linux containers that run your favorite open source software we're also going to take a look at how to
ingest metrics into influx db using the telegraph agent which is also open source and available from the influx data company who creates the influx db software and then we're also going to ingest metrics using a programming language specifically in this case we're going to be using python to do data ingestion however there are libraries for many other languages as well and then finally we're going to take a look at how to query data out of the influx db time series engine using the flux language that's been created alongside that product and then finally we're going
to take a look at how to create the metric alerts and notification integrations with third-party software that you can do things like get text messages on your phone or you can send yourself a message on slack or provide lots of other types of integrations that allow you to get notified anytime that a metric exceeds a threshold that you defined inside of influx db itself i hope this has been informative for you and i'd like to thank you for viewing


![Intro to Time Series Databases & Data | Getting Started [1 of 7]](https://img.youtube.com/vi/OoCsY8odmpM/maxresdefault.jpg)