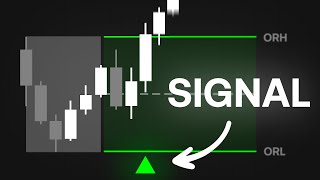
You ever watch a candle rip through a major level like it means something and then you check your indicator and it's just flatlining? Yeah, that's the problem. Most oscillators smooth out the very thing you need to see.
Raw, undeniable intent, whether buyers are punching through resistance or sellers are gutting support. But this tool doesn't blur the story. It breaks it down.
The candle breakout oscillator tracks bullish breakouts, bearish breakdowns, and sideways traps separately. so you can see who's really in control. In this video, we'll show you how to read it, how to set it up, and a high probability trade you can take with it.
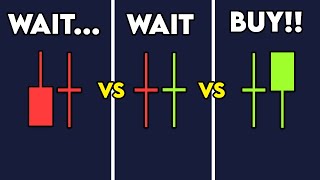
Let's get started. Breakouts are simple to describe and tricky to measure. A bullish breakout is a close above the previous high.
A bearish breakout is a close below the previous low. Everything else is noise. This indicator talls those three states: bullish, bearish, and sideways over a rolling window.
It then optionally weights each event by how strong it was, smooths the signal, and normalizes it so you can compare conditions across markets and time frames. The result is an oscillator that shows conviction, not just direction, where aggressive buyers are stacking, where sellers take over, and when the market is just breathing between impulses. That clarity is what makes it so useful as both a bias filter and a timing tool.
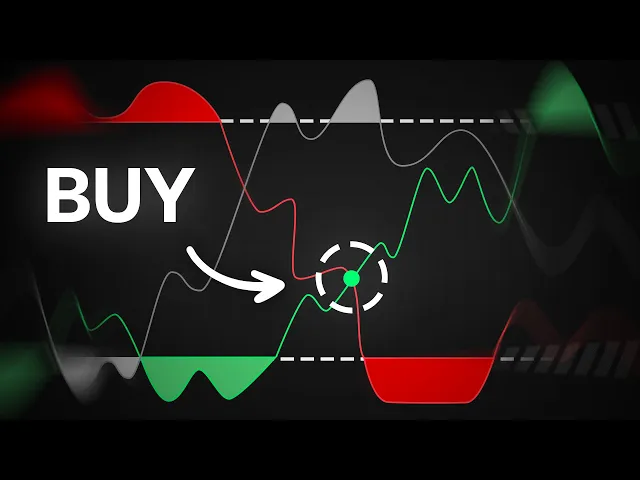
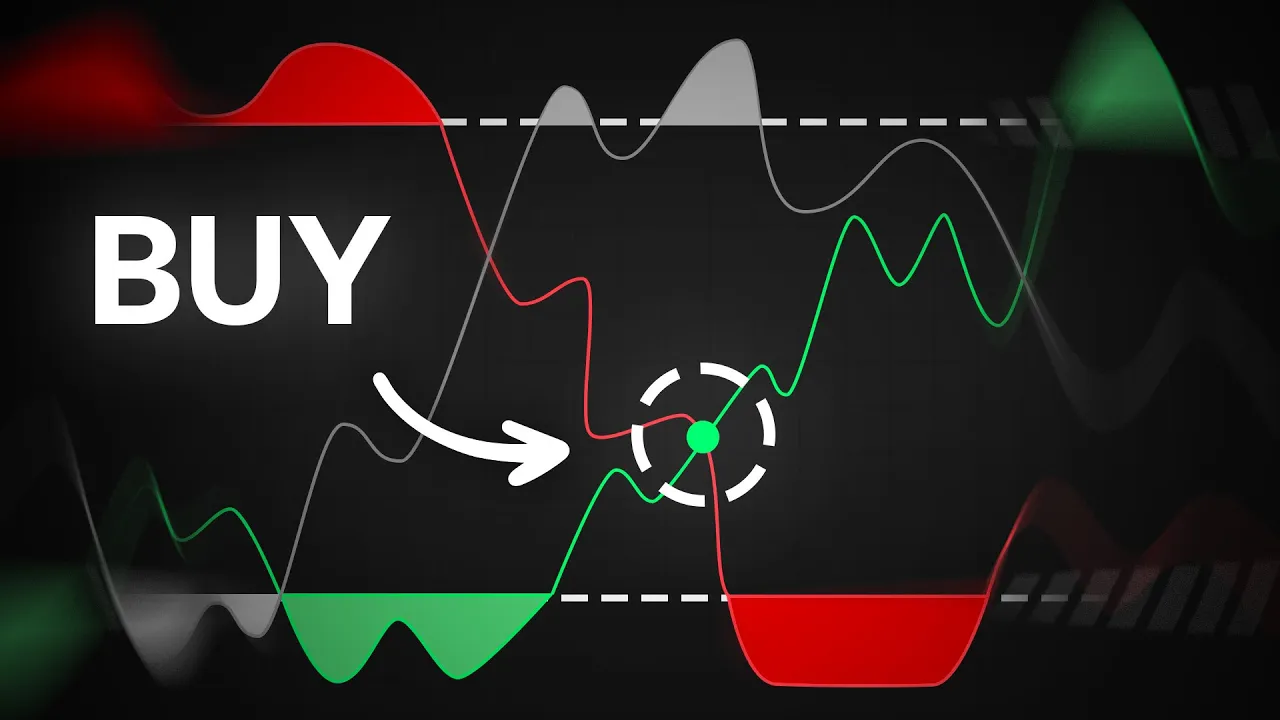
When you load the candle breakout oscillator, you'll notice three distinct curves at the bottom of your chart. A green line for bullish momentum, a red line for bearish momentum, and a silver line representing sideways movement. When green rises above red, it signals that buyers are driving the tape.
When red overtakes green, sellers are in control. You'll also spot small dots at the crossover points. These mark the exact moments when momentum flips from one side to the other.
Background fills activate when readings breach your chosen thresholds. The upper band highlights overextended dominance, while the lower band points to washed out conditions. This visual clarity helps you spot trend continuations after clean pullbacks and more importantly keeps you from fading strong momentum prematurely.
Trading with this tool is refreshingly intuitive in trending environments. Lean into trades aligned with the dominant curve, especially after minor pullbacks. while that curve holds above the midline and ideally begins to reacelerate.
In reversal setups, look for failed pushes from the dominant side at the top threshold, followed by a firm crossover and supportive price action. Now, let's dive into the settings. The window parameter determines how many bars are analyzed to score breakouts set to 100 by default.
Increasing this number slows the oscillator and gives you a broader view of regime bias. Decreasing it makes the tool more responsive. Ideal for scalpers looking to capture quick moves.
Smoothing method and smoothing length define how the curves behave. RMA strikes a balance between responsiveness and stability, while EMA or HMA introduce more snap, and SMA or TMA soften out choppy moves. The waiting method adds another layer.
Instead of each breakout counting equally plus one minus one, you can amplify them by volume, giving more weight to heavy volume thrusts or by price, emphasizing how far the close breaks beyond the prior high or low. Selecting none leaves all breakouts with equal influence. Next up, top and bottom thresholds.
The default 8020 split works well for most setups. A reading above 80 signals firm control by the dominant side, typically trend capable. A dip below 20 often marks exhaustion, consolidation, or the buildup to a reversal.
Pay special attention to the silver sideways curve slipping below the bottom level. That's a compression clue. When compression clears, the next momentum cross often sparks a clean directional move.
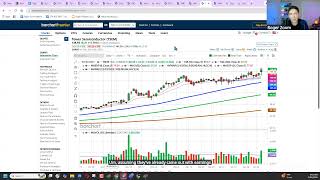
Now that we've built a solid understanding of how this indicator works, let's take a look at it in action. In this example, we're analyzing Tesla on the 4hour time frame. As mentioned earlier, to get the most out of the candle breakout oscillator, it's essential to pair its signals with external confirmations, particularly price action.
To do that, we'll add the Lux ALGO price action concepts ALGO to the chart. This tool doesn't just track structure. It also highlights order blocks, liquidity grabs, chart patterns, and more.
But for this case, we're specifically focused on its price action structure analysis capabilities. On the candle breakout oscillator, we're watching the silver sideways curve closely. Notice how it dips below the 20 level for an extended period.
That typically signals compression or ranging price action. And when that happens, it often sets the stage for an explosive move once a breakout occurs. But instead of trading any breakout blindly, we want structure to confirm the shift.
In this case, we can clearly see a break of structure happening just as price breaks out of the range. That's a strong confluence. And for our final layer of confirmation, we wait for a momentum handoff from the oscillator marked by a green dot signaling buyers taking control.
With these three confirmations aligned, compression, structural breakout, and a momentum shift, we now have a high quality setup. At this point, we can confidently enter the trade. Set our stop just below the recent swing low and aim for a 1 to three risk-to-reward target.
The candle breakout oscillator turns raw breakout behavior into a clear read of who controls the market and when that control changes. You can add it to your chart for free at luxalgo. com/ library.
In the example, we paired it with the price action concepts for confirmations. Grab access risk-free for 30 days to see how well they work together. Trade with a plan, manage your risk, and we'll see you in the next one.