here's the first lesson for the grade 11 functions course in this lesson what we're going to do is look at first the difference between a relation and a function next we're going to learn how to use the vertical line test to determine if relation is a function or not and lastly we're going to learn how to State the domain and range of of a relation so start off with what's the difference between a relation and a function so first things first let's get the definitions out of the way a relation is most simply put a
pattern between two variables um we can represent this pattern using ordered pairs table of values graph and equation and you would have seen relations described this way all throughout your math career so next thing we're going to do is be able to determine whether a relation is a function or not so what is a function a function is a special type of relation in which each value of the independent variable X corresponds to exactly one value of the dependent VAR variable why more simply put for a relation so if we look right here for a
relation to be a function there must only be one y value one y value that corresponds to a given x value that's the most simply put definition there for a relation to be a function there must only be one y value that corresponds to a given x value and we're going to look at a few examples represented in all of these different ways um to be able to tell if there's only one y value for a given x value to be able to determine if relation is a function or not and I also put a
little note here um just for you to know that all functions are relations but not all relations are functions functions are special types of relations where there's only one y value that corresponds to a given x value so let's look at a couple different relations and determine if those relations are functions or not our first relation is y x^2 that is um a relation you should be familiar with you would have done that in grade 10 quite often if you graph it it forms a parabola here's the table of values for y = x^2 I
chose X values between ne3 and three to get the Y value just Square the given x value and here are all of those that here's that table values written as ordered pairs if we were to graph those ordered pairs here's what the graph of y x^2 looks like a parabola this relation you may not be familiar with this relation is defined by the equation x = y^2 so if I chose y values between -3 and 3 the x value can be calculated by squaring the Y value because X is equal to the Y Val squared
for example if y was -2 the x value would be equal to that y value squared so four if I if I wrote this table of values as ordered pairs this is what I get and if I graph it this is the most important thing here if I graph it this is what it would look like here's the graph of xal y^2 what we're going to want to be able to do is use these graphs to determine if these relations y = x^2 and X = y^2 are functions or not we're going to use What's
called the vertical line test just to introduce you to the vertical line test what we're going to do is draw vertical lines through x = -2 1 0 1 and 2 on the graphs of both of these relations and then we're going to check is there only one y value for each given x value so if I draw those vertical lines on these graphs this is what it looks like and these vertical lines are actually going to be very useful for determining if there's only one y value for a given x value all that you're
going to have to check for is does do any of the vertical lines intersect the relation at more than one point if it does for example if we look at the relation of X = y^2 for the vertical line X = 2 it intersects our graph of x = y^2 there and there so when X is 2 there are two different y values so that is not a function but if we look at the graph of y = x^2 each vertical line only intersects the graph of y cos x^2 once this one intersects there that
one there that one there that one there that one there none of the vertical lines intersect the graph more than once so this one is a function because it passes the vertical line test no vertical line crosses the relation in more than one spot if we look back so I'm going to show you how we could have determined this before graphing without the vertical line test if we look at our table of values so let's look at why is xal y^2 not a function well hopefully what I want you to notice is if given the
ordered pairs we have an x value that is repeated if you have X values that are repeated and have different y values associated with them it is not a function because there are two different y values -2 and two that correspond to the exact same x value that is not a function but if we look at the table of values for y x^2 there are no X values that are repeated it's fine if y values are repeated that's fine but there are no X vales that are repeated so this one is a function so I've
summarized this here so just comparing what happened here when we drew the vertical lines so if we're looking at y x^2 none of the vertical lines intersected the graph of yal x s at more than one point so we already talked about that so I'm looking at this section here right now that means each value of the independent variable corresponds to no more than one value of the dependent variable so each x value has one y value okay so the relation y x^2 is a function the vertical lines drawn at x = 1 x =
2 for X = y^2 intersect the graph at more than one point so for xal 2 intersects there and there xal 1 intersects there and there that means it's not a function that means that some values of the independent variable correspond to more than one value of the dependent variable so for a given x value there could be more than one y value that is not a function it fails the vertical line test so let's look at the definition of the vertical line test here's the definition here um I'm going to go to this version
a vertical line test is simply a method for determining whether a relation is a function or not if every vertical line intersects the relation at only one point then the relation is a function if you draw a vertical line and it intersects the F the relation at more than one point is not a function so let's use the vertical line test to classify each of the following relations as a function or not so if I take a vertical line and I pass it through this relation notice that it only ever touches the relation in one
spot so it passes the vertical line test so this relation y4x + 5 is a function this relation is a function no vertical line can be drawn that passes through more than one point on the line let's look at this relation if I take my vertical line and pass it through this relation notice right there um it's always as I'm passing through it's always touching more than one spot on the relation for example if I stop it right there at xal 6 it is passing through the relation here and here so for when X is
6 y could be four but it also could be zero so there is more than one y value corresponding to a given x value so it is not a function this relation not a function infinite number of vertical lines can be drawn that pass through more than one point on the curve for example when X is 6 y could be zero or four if we take our vertical line and go to this relation it's being a little laggy here if I go to this relation as I pass it through the relation it's never touching the
relation in more than one spot it passes the vertical line test this one is a function lastly we have a circle a circle is a type of relation defined by the equation below if I take my vertical line pass it through this relation notice it is Touching The Circle at more than one spot as it goes through for example if I stop it at xals 2 is passing through the circle there and there since there are more than one y value for xal 2 it is not a function so under here relation not a function
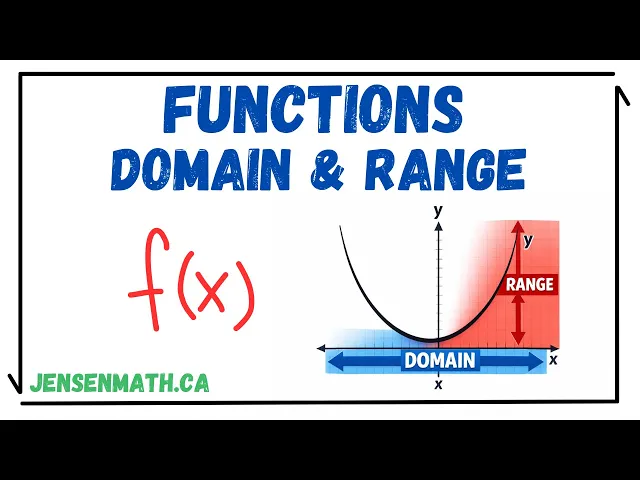
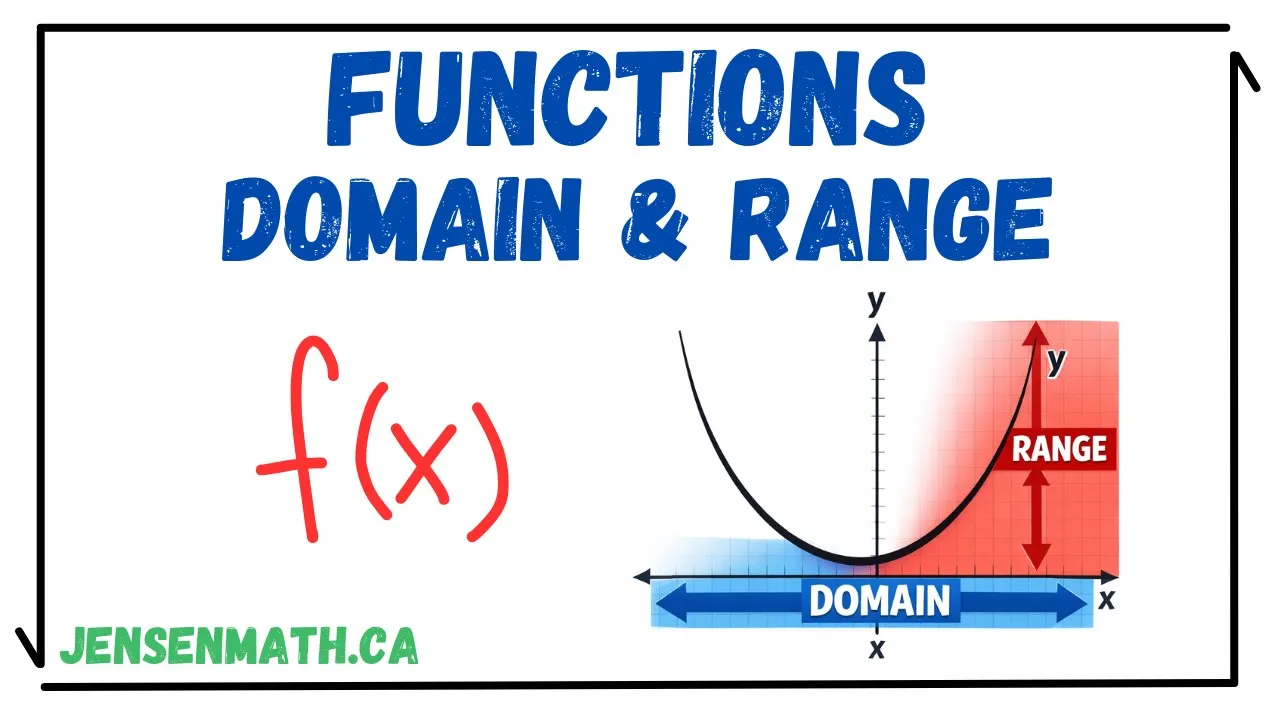
next thing and last part of this lesson is you're going to learn how to State the domain and the range of a relation so let's get the definitions out of the way basically for any relation the set of values of the independent variable the set of values that X could be is called the domain of the relation the set of values that the dependent variable so the Y values the set of corresponding values that y could be is the range of the relation note for a function for each given element of the domain there must
be exactly one element in the range meaning for each x value there must only be one corresponding y value for the relation to be a function we've talked about that about that a lot already more simply put domain and range domain values X may take range values y may take I'm going to show you just a little um interactive activity here just to maybe get you to be able to visualize domain range so I have a relation here and for this relation it only exists between one 1 and 9 most of the relations we look
at are going to um continue on forever but for this one it just exists between 1 and four so if we want to look at the domain and range um domain we're looking at where does the function exist along the X AIS which X values could I plug into the equation for the relation get a corresponding y value so if I'm going to so watch as this red dot traces along the relation the part on the bottom here this yellow dot is going to trace along the X AIS as I trace along the function and
that's going to tell me what the domain of the relation is so if I trace the Red Dot along notice look at the Y look at the sorry look at the yellow along the x axis that's going to trace the domain of the relation so as I move the Red Dot along it's going to trace the domain of the relation along the xaxis in yellow so notice the domain goes between one and n and written an interval notation which we're not going to do this year but the domain is between 1 and N inclusive the
function exists for X values between 1 and 9 if we're going to look at the range of the relation the range means what y values can the function take so we'd be looking at the Y AIS where does the relation exist along the Y AIS so as I slide the Red Dot along in green along the Y AIS it's going to trace where along the y- AIS is the relation going so it starts off at seven and then as I trace the Red Dot look at the green it's going down all the way to three
and then it's start it's going back up but you should notice the function or the relation only exists between 7 and three along the y- axis so the range written in interval notation is between 3 and 7 inclusive we're going to write domain and range different than this notation but this is just just a good way to help you get started understanding so the domain is where does the relation exist along the xaxis the range where do it exist along the y- axis okay so let's go back and try a few examples of this here's
the notation that we're going to use so if we have a continuous function so if we have a continuous function we're going to WR write our notation like this we're going to first say that X could be an element of real numbers so a real number just means any type of number rational or irrational number includes integers termining terminating decimals repeating decimals non-terminating non-terminating decimals it's basically saying the function exists everywhere along the X AIS except this is a given that sign this means given that we're going to have to State some restrictions on on
the domain sometimes maybe there's an ASM toote somewhere and X couldn't be a certain value maybe X only exists between certain values like in the example sorry in the example we did here x was only between 1 and 9 so I would describe it this way and put a one and a N9 there meaning X is always greater than or equal to one less than or equal to 9 if we have a discrete function meaning the function only exists at certain points we will actually write the X values of those points in our um notation
like this we would just put x equals and then the values of the x coordinates of the points where the function exists same with range but with range we're looking at y values we have a continuous function we're going to write it using this notation discret function this notation and we'll do some examples of this um so you understand what I mean by these notations and it'll it's not too hard um okay so we have a discreet function to start off with here meaning the fun the relation only exists at certain points so to write
the domain and the range let's start off with the domain keep in mind domain is the X values of the relation so I'm going to look at only the X values and typically you're going to want to write these in order so a little curvy bracket the domain X could be equal to and we'll put them in order from least to greatest it could be -3 -2 it could be five and it could be six if an x value is repeated you don't have to write it twice close it with your curvy bracket range you're
going to want to start your curvy bracket range we're looking at y values so you're going to look at all the Y values and you're going to put them in order from least tog greatest y could equal 8 -6 3 4 and 7 that's how we write the domain and the range of that relation Part B you'll do it a similar way I'm not going to write it out I'll just show you the answer here Part B here's what your answer would look like the domain you just look at all of your X values the
range you just look at all of your y values and you write them out in order inside the curvy brackets now here's the here's a good question are each of these relations functions so if we look at the first relation are there any X values that are repeated if there are any X values that are repeated then it is not a function notice we have a five here and a five there so when X is 5 y can be -6 or three there are two y values that correspond to a given x value therefore it
is not a function so we look at part A I wrote a is not a function at xal 5 has two different corresponding y values so it's not a function but if we look at Part B there are no X values that are repeted this one is a function Part B is a function because for each element in the domain there's exactly one corresponding value in the range so for each x value there's only one corresponding y value let's go ahead and now practice a couple I'm going to give you the equation of the relation
uh we should be able to graph these just based on your knowledge from Grade 9 and 10 math if you're going to graph a linear relation y = 2x - 5 we could make a table of values or we can know our Y intercept is5 2 3 4 5 and our slope is 2 over 1 and we can connect to a straight line roughly that's what our relation looks like does this relation pass the vertical line test if you want you can take your ruler or your pencil any type of vertical line um pass it
through I'll change it to Red so we can see the difference between our vertical line and our relation pass it through relation make sure it never touches the relation in more than one spot um it never touched in more than one spot so this one is a relation um oh and actually it wants us to State the domain and range of this relation um so if we want to State the domain and the range for this one domain that means what values could X take um what I might want to show here though as well
is this this relation y 2x - 5 doesn't stop right there it continue continues on forever that way and and that way so the domain technically for this relation it's going to continue forever to the left and right I could plug in any x value I want and get a corresponding y value so the domain there are no restrictions on the domain X could be any real number X is an element of real numbers that's how we Define the domain that basically means X could be anything you can plug in anything you want for x
and get a value for y same with the range in this case the range this function will go off to positive infinity and negative Infinity along the y axis it'll continue forever so the range in this case there are no restrictions on the Range the range is an element of real numbers as well that basically means y could be anything let's do another relation so we have a quadratic relation here you should be able to graph this with your knowledge from last last year it's a quadratic that has a Vertex at 1 three so at
one one two 3 and if we want to see what it looks like to the left and right of that point if x was two it would be at four if I plugged in two for X I would get a y value of four and it's symmetrical so it'll be at four on this side if I plugged in three for X it would be at seven 2 3 4 5 6 7 and once again it's symmetrical be at seven on this side roughly that's enough points to get a general idea of what the shape of
this looks like and remember this relation will continue forever in that direction it'll continue forever to the left and right going off to positive Infinity if we're going to write the domain of this quadratic the domain there are no restrictions on X X could be any real number if I was going to continue this function forever it would continue off infinitely to the left and to the right we could plug in any x value we want into here and get a corresponding y value however if we're going to look at the range if we look
at this relation notice this relation never goes below that point there it's always at that point or above that point right there the Y value of that point keep in mind we're looking at the range looking at the Y values the Y value of that point right there is at three 1 2 3 so for this relation this relation on the y- axis is always at three or above it'll continue up forever it'll go off to positive Infinity but it'll never be below three so we have to write a restriction for the range so for
the range always start with our curvy bracket Y is an element of real numbers but there are some restrictions why isn't why so this means y could be anything given that Y is going to be always greater than or equal to 3 so what this means y could be anything given that Y is greater than or equal to three our next one y equals theare < TK of x -1 + 3 so if we wanted to this this relation you may not be familiar with you'll get familiar with this relation throughout this course we're going
to learn how to graph um the function yal rootx um and then we'll be able to graph this using transformations of that by shifting it right one up three but for now maybe I'll just give you this graph and we'll look at what the domain and the range of that relation is so if I just let's I'll give you this one and then I'll explain why um I have these answers for the domain and the range so here's what the relation looks like so right now you would probably have to graph this by making a
table of values if we do that we will get the relation that's in green here and notice for this relation I should draw my little arrow here so this relation would continue forever in that way but it will never be to the left of that point there it starts here and continues off to the right forever that's why the domain it says X always has to be greater than or equal to 1 it's at one on the on the X axxis here it'll always be at one or to the right it continues off to the
right forever but it can't exist over here why can't it be to the left of one why is there no corresponding y value for an x value of negative 1 why doesn't the relation exist over here well let's look if I was to take this ne1 this x value of ne1 and plug it in up here I will get theun of -1 - 1 that's -2 + 3 and we can't take the square root of a negative number we can't do it because nothing squared gives us a negative number so we can't have a negative
under a square root sign that's why this relation does not exist over here it only exists from one and over that's why our domain says it can be any real number but but it has to be greater than or equal to one so it exists everywhere from one and over to the right the range the Y values will always be at three so if we look where this relation exists on the Y AIS the lowest point it's ever at is three and it's going to continue up forever as we move to the right it keeps
getting higher and higher and higher it'll go off to positive Infinity but it never will go below three that's why the range y could be any real number but it's greater than or equal to 3 and the last one oh we're going to do we'll do a couple more um basically so we have X2 + y^2 = 36 that's a circle with a radius of 6 so let me just draw a circle here centered at the origin and hopefully you remember this from last year as well with the radius of six I wish this wasn't
lagging on me one two three four five and a bit more not that far and I don't know if it's going to let me do it it's lagging too much hope it doesn't crash on me here I think it's about to okay let's go to the other one where I have it drawn already so I think it's about to okay there we go okay now it's moving yep it crashed okay let's go to the one I have done okay if we look at this one I drew a circle radius of six under at the origin
notice this circle this relation doesn't exist out here out here out here out here we're going to look at the Domain that means along the x axis where does it exist what x values could we plug in to get a value of y along the x- axis It's contained between the interval of -6 and 6 that's why for the domain I put X to be any real number between -6 and 6 it's always greater than or equal to6 less than or equal to 6 for the range we're looking on the y- AIS where do the
relation exist on the y axis well the smallest y value it has is Nega -6 the biggest y- value is posi 6 so the range could be any real number greater than or equal to6 less than or equal to 6 the last relation we're going to do is probably a brand new one to you that you would have never seen it involves ASM tootes so if we're going to look at this relation y = 1 x + 3 you're going to notice it has two asmp tootes I'll just really quickly explain what an ASM toote
is and why they exist for this relation but we'll talk more about ASM tootes later as we start graphing different rational functions and you'll spend a lot of time with ASM tootes when you take Advanced functions next year but basically there is what's called a vertical ASM toote so an invisible line that our relation cannot touch it can approach and get very very close but it will not touch um there's a vertical ASM toote at = -3 why -3 well if we look at our relation if x was -3 if I plugged in A3 for
this x I would have -3 + 3 in the denominator -3 + 3 is equal to 0 so I would have 1 over Z and you know that dividing by zero is undefined you can't do it so there will always be a vertical ASM toote at any x value that makes your function undefined okay that makes the denominator zero so there's a restriction for our domain this relation exists everywhere along the x axis except at -3 x cannot be -3 that's why I've defined the range as being X could be any real number but it
cannot be -3 there is an ASM toote AT3 because if x was3 would make the denominator zero and we can't have that we can't have the denominator being zero there is a vertical asmt at yal 0 so yal 0 is actually the xais line there's a vertical ASM toote there notice this relation um if we start at negative 1 it's going off towards positive Infinity but as we move to the right it gets low smaller and smaller and smaller and gets closer and closer and closer to zero but never touches it if we look at
on the other side of the ASM toote if we start at this value here notice it's going off to negative Infinity as it gets really close to negative 1 along the x-axis and as we go to the left it gets closer and closer and closer to 0er but never gets never quite gets there so there's a horizontal ASM toote at y equal Z and there will always be a horizontal ASM toote at yal 0 if the denominator of a function is a higher degree than the numerator the the numerator in this case is degree Z
the denominator is degree 1 very exponent of one therefore there's going to be a horizontal ASM toote at y equal 0 there is no x value you could plug in that would make y equal Zer you could get really close you put in a really really really really big x value you will get one divided by a huge number which will be very close to Z be 0.00000000 something but it won't actually equal zero it'll just get very close to zero so my range y could be y could be any number it's an element of
real numbers given that Y is not zero y cannot be zero in this case and then here's just a little explanation of what I talked about ASM tootes an ASM toote is a line that a curve approaches more more closely but never touches um the function that we just talked about y = 1x + 3 has two ASM tootes A vertical ASM toote um we find vertical ASM tootes by looking at where the denominator would be equal to zero because division by 0 is undefined therefore the expression the denominator of the function cannot be zero
so X cannot be -3 because if x was -3 the denominator would be zero so we have to draw a vertical line at xal -3 and call this an ASM toote the Curve will get very close to it but it will not be able to touch it a horizontal ASM toote um the line Y equals 0 is a horizontal ASM toote because for all functions where the denominator is a higher degree than the numerator there will be a horizontal ASM toote of y equals 0 I mean it could be shifted up and down depending on
what Transformations are being applied but for now it's always going to be at y equal 0 and I think that's it if you want you can pause the video here read through these key Concepts um but that's it for the first lesson