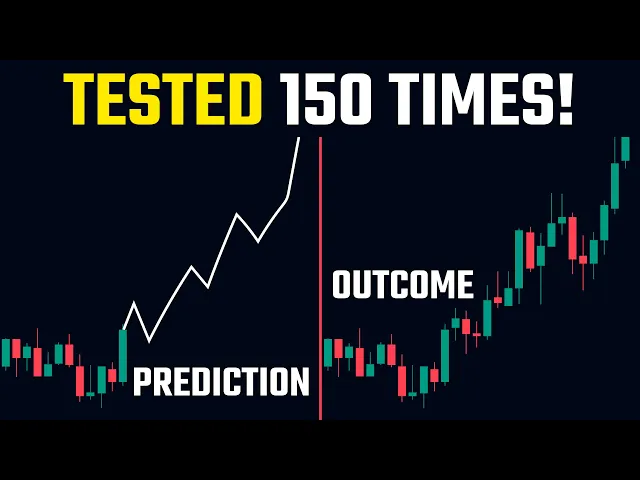
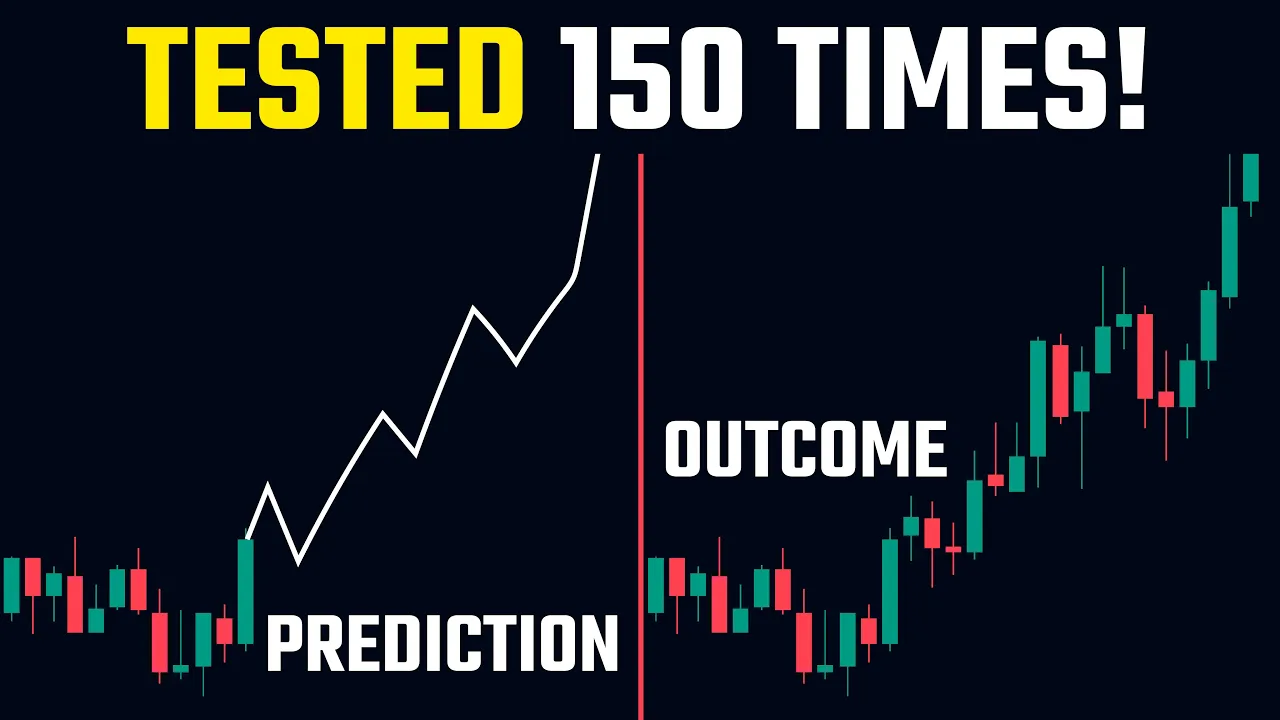
trading is all about predicting the future of the price of an asset and most of the time that is easier said than done but what if there was an indicator that does exactly that Well turns out there actually is an indicator that predicts the exact future of the price of an asset and it's pretty damn good at it too this video is a review of a trading strategy originally created by switch stats that utilizes this future predicting indicator I will also back test that particular strategy one 150 times just to see how it performs over a long time period Swit starts hope you don't mind me using this if you do please let me know let's get into it now you may be asking yourself but what is this future predicting indicator anyway and is it a premium indicator or is it free well ladies and gentlemen welcome the echo forecast indicator this indicator was created by Lux Alo in October of 2021 and its main purpose as you can see is to plot out the exact path to be followed by the price of an asset now switch stats the original creator of this strategy used it on the one minute chart of Bitcoin against tether so we're going to do the same now to add the indicator you're going to click on indicators and type here Echo forecast and select this one by Lux algo the default settings for this indicator will work perfectly so we're not going to change anything I'll not go over the math behind the workings of this indicator because that's not going to make you money money but here is a simplified version of how the indicator works you see this orange rectangle here this is called the reference window this green one in between the gray area is called the forecast window and these gray rectangles are called the evaluation window together with the forecast window they make up what they call Total evaluation window so the basic idea is that price history tends to repeat itself if you look closely at this prediction graph you'll notice that it's basically a mirror or an echo of this price segment I'm going to activate the line graph just so you can see it better see it's an echo of the past hence the name I guess so how they basically arrive at this is by taking this price segment in the orange Zone and then they search for a price segment that's similar to it within this total evaluation window so like here they searched for this oh all over here and they found this now it doesn't have to be a perfect match just a bit similar but the higher the similarity between the two the more accurate the prediction is going to be now once they find it they mark it with a green rectangle and then they plot out a price prediction that's closely similar to it so the idea is this history is going to repeat itself probably now to trade using this indicator is really simple it's probably one of the easiest indicators to use on the planet when the prediction is like this you take a long trade but when the prediction is like this you take a short trade also known as short selling that is correct warjack switch starts didn't use this indicator by itself because just like any other indicator it produces false signals the second indicator they added is a trend confirmation indicator called SSL hybrid this one by meel and a third indicator is called volume oscillator this one by trading view now let's change the settings for SSL hybrid you're going to click here and on the input stab change the Baseline type to Mac gentle and then change the Baseline length to 200 then on this tile tuab we will be unchecking everything except for the AMA Baseline and the bar color and then click okay now for the volume oscillator click here and on the style tuab change the plot color to yellow and the zero line color to white and then click okay so this SSL hybrid indicator will be a trend confirmation indicator when it colors the candles blue that would mean that the market is in a bullish Trend and we will be looking to take only long trades but when it colors the candles red that would mean that the market is in a bearish trend and we will be looking to only take short trades the volume oscillator will be used to determine if there is enough volume in the market to push the price in the direction of our trades when it's above the zero line it basically means that the market has enough volume so we will be looking to take trades but when it's below the zero line that would mean that the market doesn't have enough volume and we definitely shouldn't be taking trades and then of course the echo forecast indicator will be our entry confirmation in indicator you'll see what I mean with an example for a long trade first the price candles should be colored blue to indicate that the market is in a bullish Trend second the price should be touching the top of this reference window if that's the case this prediction line should extend beyond your takeprofit level without touching your stop- loss level for example if this is your stop- loss level and this is your takeprofit level this line shouldn't touch this level but it definitely should go beyond this level the third condition is that this volume oscillator should be above the zero line to indicate that there is enough volume in the market to push the price in the direction of our trade all conditions are met on this candle so we're going to enter a long trade we're going to set our stop loss either right below the previous candle or below the most recent swing low whichever of the two that is higher for the take profit we're going to set it at 1. 5 times the risk I like to set mine at two times the risk but this is what switch stats used for their showcase so we're going to do the same we let the trade run and it hits take profit now to enter a short trade you basically just have to do the opposite of everything we did for the long trade here's what I mean first the price candles should be colored red to indicate that the market is in a bearish trend second the price should be touching the bottom of this reference window if that's the case this prediction line should extend beyond your take profit level without touching your stop- loss level so if this is your stop- loss level and this is your take profit level this line shouldn't touch this level but it definitely should go beyond this level the third condition is that the volume oscillator should be above the zero line to indicate that the market has enough volume to push the price in the direction of your trade all these conditions are met on this candle so we're going to enter a short trade we're going to set our stop- loss either right above the previous candle or above the most recent swing High whichever of the two that is lower for the take profit we're going to set it at 1. 5 times the risk we let the trade run and it turns out profitable and that's basically how the strategy works now I'm going to back test it 150 times using a risk to reward ratio of 1 to 1.
5 the account size is going to be set at $11,000 and we're going to be risking 2% of that every time we we take a trade let's get started [Music] Now The Bu testing is done and we have the results but before we share it with you guys if you found value in this video take a second and hit that like button below because by doing that you're really motivating us to keep creating these free and value packed videos for you guys so please do that now after 150 trades this strategy had a win rate of 64% and the g only the account was 473 per. these numbers are decent we see that it had a profit factor of 2.