hi and welcome again I've had some firm complaints in the comment section about overfitting and that our trading or algorithmic trading models are way overfitted and they will not work well on future trading data but what if we are not really overfitting our models actually what if we are not even trying to fit any of the models at all and maybe even when we overfit sometimes on purpose it might be a profitable approach and there is somehow a clever way to do this the thing about algorithmic trading is just like any artificial intelligence machine learning
working pipeline sometimes and for some types of data we might not have much of a choice with overfitting it's kind of urse and we have to deal with it now the first point I would like to clarify is that none of the indicators we have used so far in our strategies is being fitted optimized or modified in any way notice that every single time we optimize the trading strategy we only included the takeprofit and stop-loss distances in the optimization process no matter what the trading indicator was this is why we have been using this heat
map where on the xaxis we have the takeprofit stoploss ratio and on the Y AIS we have the stoploss coefficient everything else the moving averages the Binger bands the vwap the macd RSI and any indicator we have used Remains the Same during the whole back testing and optimization process so there is no way any of these indicators is included in the so-called overfitting process how actually say these might be even underfitted since we never took care of these parameters the length of the RSI or the length of the moving averages and so on none of
these parameters were optimized in the optimization process we fixed these at the beginning of the strategy we just analyzed the situation we said let's say we need an EMA of 20 and another EMA of 50 or 60 of length and then these parameters remained constant and the same fixed during the whole optimization process so no the indicators were never overfitted and just to make things even clearer in summary in all our back tests for all the strategies so far we never tuned parameters related to the indicators all what we were overfitting was related to the
trade management part which comes after the trade is opened and this is an important point to underline it's also somehow related to the previous video around accounting for Commissions in back testing when we look at a heat map that shows different setups of stop-loss distances and takeprofit stoploss ratios we can immediately see that the indicator we are using has a potential if most of the returns are positive this means that no matter what the stop-loss and takeprofit configuration are we will most probably have an advantage over the market because all the returns are showing positive
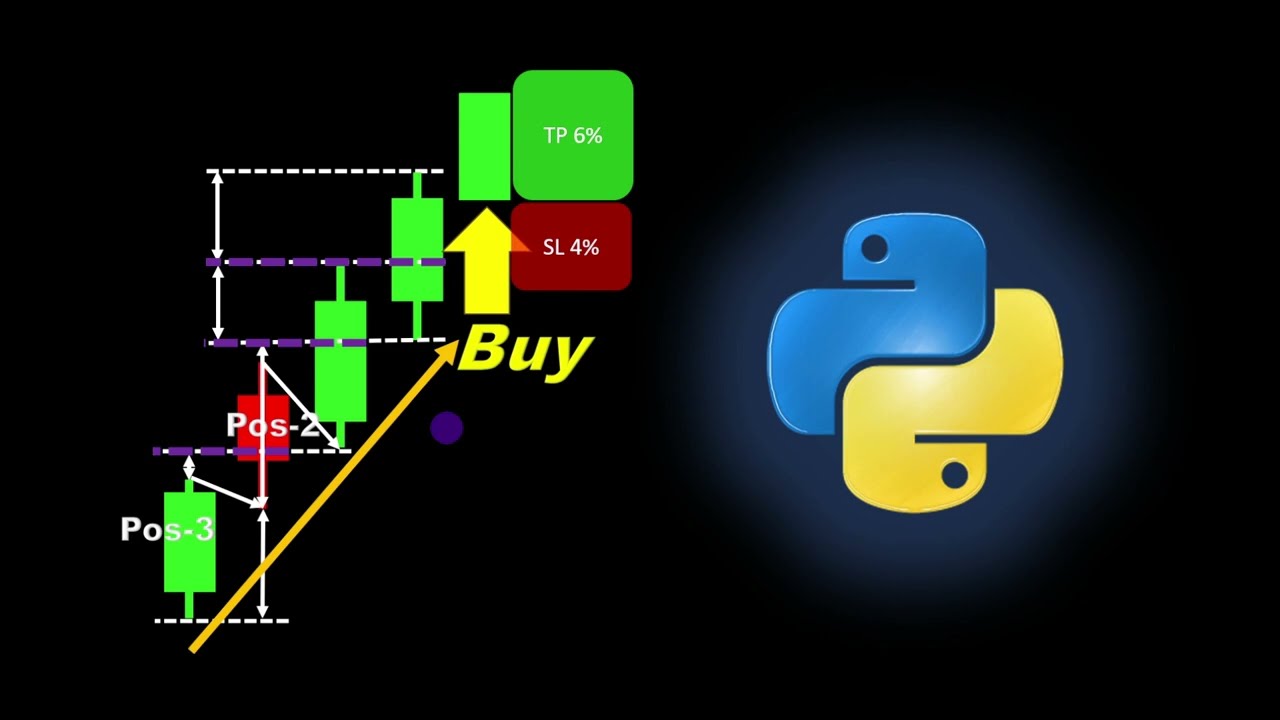
values on the opposite side if we have mostly negative returns shown on the heat map this indicat that the indicator is not suitable for trading so no matter which trading management we include in the strategy it all depends first of all on the indicator in a very simple way algorithmic strategies are usually crafted out of two major parts the detection and entry signal so the indicator related part and the trade management part where we choose the closing pattern of the trade when do we close the trade that we already opened so if an indicator is
set and fixed at the beginning of our back testing Series without any modification and we still managed to get good results on most of the heat map back tested cases and for different stop-loss and takeprofit conditions this means that the indicator has an excellent potential another point we might want to consider is the variance if we look at all these tests we can see that the transition between the different values of returns is not very sharp so there's a smooth transition between one set of parameters and another close set of parameters so the variance is
relatively small obviously we can compute the variance of a model and set a threshold limit to decide if we have an overfitting case but for these examples it's not really needed the differences between neighboring returns is smooth enough showing relatively low variance and so there's no overfitting to make things a bit clearer and refresh our memory take a look at these two examples this is a a low variance fitting and it's expected that this generalizes better over wider set of data while the second the bottom example is a high variance fit which is also called
overfitting and as you can see it passes almost through all the training points but it will fail to describe any new point on the chart because it's so Twisted in a way to fit only the training points and this is the case we usually want to avoid in trading and in any machine learning problem in trading we want a model to fit on training data but we also want this model to be applicable for any new data on the market because we basically intend to apply the model on future data so back to our heat
map we can identify this smooth low variance Behavior looking at the returns values while in this test we can see Sharp changes between neighboring return values for example this 21% is surrounded by - 18 -1 and so on we sharply jump from plus 21% to- 18 or -12 as you can see just by changing any of the takeprofit stop-loss ratio or the stoploss coefficient for the stoploss distances so you get the point we have those sharp jumps in between the return values also this 27% is surrounded by negative values as well so we can see
those spikes in values which also means that if we change the stop loss or take profit Distance by a tiny bit the strategy would turn from a winning to a losing system even worse if we don't change anything and the market changes slightly the same would happen our system would turn from a winning system or supposedly to be a winning system to a very much losing system so this usually happens when we have a bad trading indicator where we try to cover it up by an overfitted trade management style and this is why I don't
consider this indicator as an overfitting case simply because of the continuity of the return results and you can verify these by yourself I always share the codes I always share the jupter notebooks where we obtained these and you can verify this continuity of uh of the values of the return values from the different back tests now on another point a bit of overfitting might not be as bad as you think in our case let me show you how imagine we are using an indicator where these are the results and they look look good so we
choose the safest set of parameters and it should be somewhere around this area for example we have a cluster of positive returns and all around it in case the market shifts we still have positive returns so now we have a takeprofit and stoploss distances that we can trade with for let's say a week or so we're not going to carry these parameters forever it's just valid for a week now after a while market conditions will change and so this this cluster of Maximum profit is expected to shift to a different area of takeprofit and stop-loss
distances so this is why we can rerun our pipeline of parameters or fitting the parameters and identify a new set of take profit and stop-loss distances to trade with providing a safe area of positive returns it's not an extreme overfitting case but since the parameters do not generalize over a long period of trading and we need to refit every week we are somehow in the overfitting behavior and um the overfitting mindset let's say but exceptionally for this case it's a good kind of overfitting but there's only one way to find out we need to try
it we need to deploy it live and then time will tell and this was it for this video I hope it brought some clarifications about the fitting process and especially when we forward test our strategies and we still find the same pattern of positive returns this can only confirm that the indicator we are using is good for a trading strategy and we're not overfitting the indicators if you are still watching thank you for staying that long please support the channel pressing the like button and if you have any ideas don't forget to leave them in
the comment section if it's your first time on this channel for any strategy and indicators that we back test I usually provide the entire python code for download in the description of the videos check the other videos out and let me know what you think until our next one trade safe and see you next time