welcome back folks this is lesson 6.1 of the january 2017 ict mentorship defining high time frame pd arrays okay when we look at a chart regardless of what time frame we're looking at it uh there's two elements that come to mind as a trader obviously we think in terms of support or resistance or we think in terms of audit we're sold we think in terms of price patterns uh secondary but generally we think of a price being valued too low or too cheap or expensive or too high and the algorithm has similar thought processes built
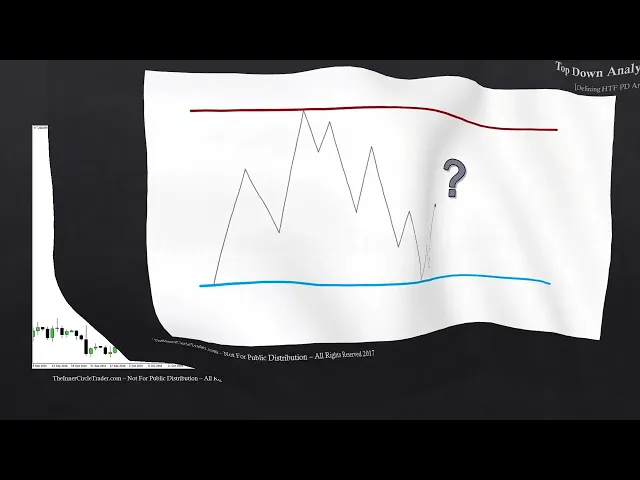
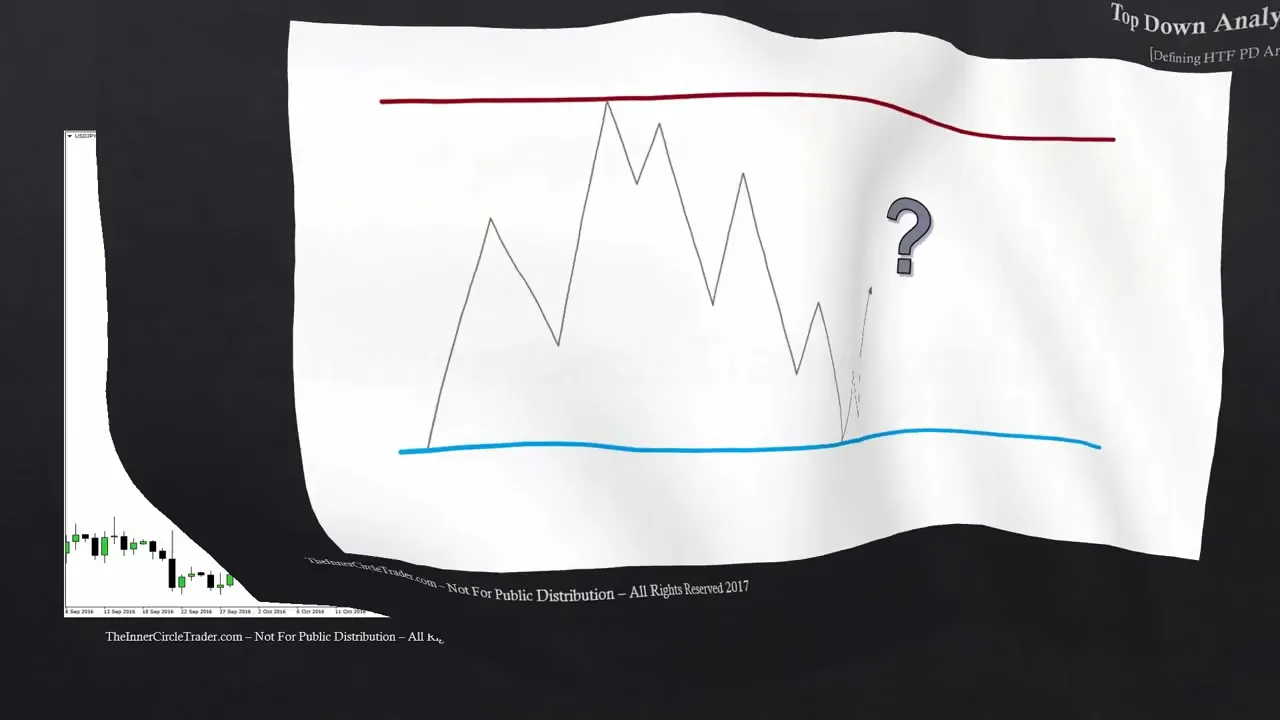
into it and we look at it in the form of a premium and a discount market for the sake of discussion just think of this red line at the top as a resistance and a blue level in the bottom being support as price starts to move away from a level that would be viewed as too cheap or support naturally our expectations as traders we expect to see price move higher when it does this we're confirmed to see a response moving up to a resistance point of some kind now the problem is with retail trading and
with technical analysis as a whole by itself it doesn't help you because every one of us could come to the conclusion that a specific level above current price action would be a resistance level some of us will see it as a an old load they would be trading to some of us would see an old high some of us would see something else that would equate to a resistance level now to remove all the ambiguity you have to have a mindset going into it and this teaching is to teach you the hierarchy on the tools
that i use for framing the trades now these same arrays are the same things that we've talked about since the beginning of the mentorship but we're going to prevent you from having them in a disorganized fashion in other words there's an iraqi in how they are used and how you look for them in price as price makes a retracement lower from a support level how far does it usually retrace back all of us again based on different walks of technical analysis and different disciplines we'll all have a different conclusion some of us would use a
fibonacci some of us would use some fashion of support and resistance some of us would use elliott weave and ratios and harmonic patterns all kinds of things would come by way of discussion if we were in a round table meeting we're all sitting in the same room together we all have different opinions about how far it would retrace some of us wouldn't have even expected a retracement okay some of us would not see this as a retracement but a beginning of an all-out reversal to trade below the old low that's the problem every trader is
plagued with when they come into this business who's right who has the the means of knowing with great deal of prognostication what is a support level and what is the resistance level and therefore what will propel price away from the current market action higher or lower because the common adage is if i knew where price was going next i wouldn't need to know anything else i would make money that's not true because you would find some other way to lose money over leveraging or or you doing something different you shouldn't be doing and you'll break
a rule and you'll get the emotional psychological impact because of that and you'll end up blowing the account so when we look at charts we want to be viewing price in the terms of are we in a premium or are we in a discount market earlier in the mentorship i taught how you could do that but we're going to talk a little bit more in terms of how to frame that on higher time frame charts in the form of an hierarchy with the arrays as price starts to retrace and then moves higher it hits a
level of resistance now for the sake of discussion we're going to say we collectively understand what would deem a resistance level to remove all the uh secondary discussions that we could have if we were a front in front of one another in the same setting in a you know live setting where we could literally shake hands and talk all of us would have an opinion about what would constitute a resistance level but we're going to say that this level that's noted as red that is the commonly agreed upon resistance level the reasonable expectation would be
to see price move away when price does that some of us would expect one more try to get to that level maybe to go through it or to fail that's how i trade that's how i expect to see price react some of us would not even expect that they would expect this one time punch up there and then all together all you know reversal this is the type of setup i like to see here another pass towards that old high either it's going to give me a run through or a false break or it's going
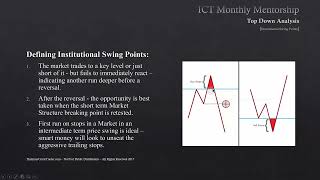
to give me a failure swing we talked about classifying institutional price swings that's what we've done for that teaching here i want you to start thinking in terms of premium and discount on higher time frame charts because the hierarchy on how you view this is going to help you whether you're a day trader scalper position trader short-term trader which expectation of lower prices how far would we expect to see price go down well the first impulse leg and then retracement then as a second leg higher hitting that resistance level that secondary impulse leg that's probably
going to be a good reasonable expectation for support level now it could be a bullish order block it could be a an old short-term high in there on a lower time frame if this was a monthly chart at that low there may be a daily short-term high that would create a a support level that can't be seen on a monthly chart so when we're looking at these higher time frame charts just understand that there's going to be levels that exist inside of larger price swings that you may not see unless you go down to the
lower time frame now when i say lower time frame i'm only referring to the daily because the higher time frame analysis is all we're focusing on here nothing below a daily chart so if we're assuming that this is a monthly chart and we're looking at price the expectation is okay well at that low we would expect to see some lower time frame support level again it could be the monthly bullish order block it could be a weekly bullish order block or it could be a daily short term high you may not be able to see
it inside that that little low there but nonetheless when we look at price swings back and forth on a chart whether it be monthly we clear daily and even lower time frames you have to understand that there's swings that exist and support levels and resistance levels that exist in the lower time frames that may not be so apparent using these higher time frame charts that is not what you base the majority of your trades on what you're going to be doing is you're gonna be using the monthly chart and the weekly chart to frame the
context of what that market should be doing using these pda arrays so if we watch price and it continues to trade higher here where would you reasonably expect to see price trade to that short term little swing low at the failure swing that's going to be what a potential mitigation block that means any orders that were used to go long but failed to make another pass at that old high they're underwater now so they're going to look to mitigate those losses and cover their long positions and go short potentially or just get out of the
trade but smart money just doesn't cut losses they know what they're doing they scale in scaling out and they hedge so this would be another selling opportunity the market seeks liquidity below the low and below the second impulse swing prior to the run into resistance so it seeks liquidity below the marketplace once it takes that liquidity out it can drive all the way down to that old support level but generally it doesn't it will retrace again and pick up more orders back at an old low where we'd see another opportunity to sell off and take
out the liquidity below a short term load that was just created and back down to a logical area of support the expectation would be what the sea price bounce price does this when price starts to retrace again some of us if we were all in the same room we would expect to see that price low to be violated and a new low created sometimes that will happen sometimes it won't this failure swing in here could be used to set up another long opportunity where price rallies and here's the million dollar question the understanding is how
price moves from one level to the next but predominantly it's moving from a level of discount to a level of premium from a level of premium to a level discount between the red line and the blue line they are extremes in the middle that's classified as equilibrium or balance buying imbalance is seen when price gets above equilibrium or up into that red level which would be resistance selling imbalance would be when price gets below equilibrium and down into the blue line or what would be just derived as discount so where would you expect to see
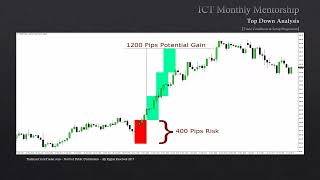
price go next that's what you're always faced with when you sit down in front of the charts this discussion we're going to use the common ict tools as far as setup parameters in the form of the way they form on charts in other words the order in which they form and how to use them based on wherever you're at in terms of the marketplace we're using this teaching as a foundation that's going to lead us into a better understanding of this example we've shown we're discussing money management for the january content so lesson five that
example for the dollar yen pair for a long term position trade this idea will be used as an example on framing pd arrays on higher time frame charts but before we get into that teaching for 6.2 we have to do the foundation to understand what we look for and why we expect it to unfold like we would okay again using our thought process of premium which would be the red line and discount which would be the blue line when you look at charts you want to see where price has moved away from an old high
and it's dropping down from an area of premium in other words it's two it's too high so the valuation is going to be reduced and dropped lower so repricing takes place and the market goes down and the price goes lower as a result of it until it gets to a point where it's too much of a discount then there has to be a premium built into it the algorithm will do this moving price back and forth back and forth back and forth until again something of significant impact comes in the marketplace and drives the market
one-sided and it creates a strong imbalance otherwise the market's just going to generate back and forth looking for liquidity based on premium and discount conditions we'll assume for a moment right now the market price is here okay and we can clearly see that the market in recent times had a clear discernible level of resistance and a clear discernible level of support now that can come in the form of bullish and bearish order blocks or it could be just old highs and old lows and we'll just use old highs and lows as an example for this
discussion your expectation is is right now price is at a level where it should by all standards move lower because it's at a classic viewed resistance level we don't know how long that time is going to be required before the market does in fact submit to our expectation and see a lower price so that time frame okay that part is what you're always gonna have to submit to time is a murderer it's a killer for for traders unless you know that some of these ideas are gonna pan out for a long long time you're gonna
do a lot of things psychologically and emotionally that you wish you wouldn't have done because you haven't submitted the time aspect of trading there's two two elements in trading you have to submit to time and price when they both agree with one another and you have waited for that agreement to come to fruition that's where profitability and opportunities are so we're looking at price and we have no idea how long time is going to be required of us to wait before the displacement takes place but eventually our expectation is we'll see lower prices down to
a level of discount and that's what we're expecting or forecasting as a future price in between these two pre reference points again time and price is what's essential you have to submit to the level of time which no one knows how much time is going to be required before your setup pans out or goes to profitability price is what you're studying you're submitting to time throughout the process but while you are in the trade or expecting this to unfold studying it you're submitting to the price you know what you're not trying to force your will
in price you're analyzing price to see what it is that's telling you in terms of institutional order flow is it justifying your expectation that it wants to go down to that discount level or some bullish order block to buy back off of and cover a short position or could be a old low that it wants to run below that future price could be a number of things but for now we're just going to aim for an old low between the market price today and the future price which you anticipate or forecast lower in the future
there's going to be zero opportunity for it to be a straight line in other words you're not seeing that diagonal line in the way the market trades it just doesn't do that there's always some give and take that takes place so understanding where certain arrays occur in that process will help you number one stay with the trade idea not be shaken out of it and have the confidence to hold until the objective is met or your stop gets taken and it's simply moving to a next opportunity the opposite scene when you're looking for a bullish
scenario everything's just reversed you expect market price to be in the future at a premium in other words it's going to be higher than it is today again you have no idea how long time is going to be required to get to your future price or forecasted price and you have to submit to that a measure of time that is unknown you can't know for certainty how many days or how many hours or or how many months it will be before that price is actually arrived at or if at all but you also have to
be studying price and again monitoring and studying the the pd arrays that occur in price action that leads to supporting your expectation on institutional order flow that would drive price up into that premium level the understanding is that price will move from a discount to a premium because the discount can't stay discount very long price is going to be established by whoever is selling it who who stands to make a profit off of it well the central bank is going to be in in the business of adjusting price so if we know that they are
in control of price ultimately by way of steering sentiment in economies through the delivery of an interest rate long term to stimulate or to suppress an economy for our country we have to view the market in terms of technicals to align ourselves with these ideas so if we see a level of support our expectation is okay where is the evidence that this thing will go to a premium market where is the premium market where's the resistance at where's the higher level that i would want to see it trade to between the market price you're at
right now in that future price again it never happens in a straight line there's time that you have no understanding of exactly how long it's going to be but there's also an element of price that you have to study in other words just because you think it's going there doesn't mean it's going there it could go halfway there and fail and go lower nonetheless what we're going to do is we're going to outline now the arrays and keep them in a specific order so that way you know wherever you're at in terms of market price
what you would expect to see or what you're looking for okay you know you know what should i be looking for an order block or should i be looking for a gap you know what should i look for right now that's what this teaching's going to do okay for a monthly chart okay what you're going to do is you're going to look at the current trading range that it's in okay and so we're going to assume that you uh outline the marketplace in terms of old highs and all lows on the monthly and that's the
easiest way of doing it there's other ways you can do it but for now we're just going to outline in the context that the most recent trading range that the market has moved from an old high to an old low that would be our premium and discount definition in between these two reference points the halfway point this is always going to be referred to as equilibrium now equilibrium between where you think price will go because it's been there before and where it's at right now relative to an old high and old low that's the current
trading range and i'll give you an example what that looks like when we go into lesson 6.2 but for now i want to lay the foundations for what it is you look for the first thing above equilibrium in the form of an array is an old high and old low you want to be looking for that above equilibrium the next thing that you'll be looking for and this is in the order of importance okay hold high or low then the next thing you'll be looking for is a rejection block a rejection block will be just
above the candle's body not the wicks so the actual high and low is the wick but then the next area of importance is the rejection block that would be just above the candle's body then the bearish order block a fair value gap liquidity void bearish breaker and the mitigation block put another way if we were at equilibrium and we were moving away from a premium level or resistance in other words prices already dropped down and we anticipate price going lower down to a level of support or monthly discount we would be looking for above current
market action again assuming that we're at equilibrium right now we would start looking above current market action in the past on the left side of our chart where is the nearest mitigation block there may not be one okay check that off where's the nearest bearish breaker there may not be one of those either okay check that off but if there is one then you would reasonably expect to see price trade up to that price point to breaker then expect some selling to go lower and once it moves below equilibrium then you would be all set
to go to the monthly discount or support but let's assume for a moment the mitigation block isn't there and the breaker isn't there what would you look for next okay well the next order of hierarchy is liquidity void is there a range that needs to be closed in again that may not be so clear check that off no problem the next thing is their fair value gap again that might not exist either go to the next thing bearish order block that's probably going to be there chances are it's very strong that's going to be there
so what did this give you i gave you the air archie and which you look for a mitigation block is going to be first considered before you get to the bearish order block because the various order blocks will be really high up in the premium mitigation block is going to be the lowest mitigation and breakers are basically mitigation blocks but generally mitigation blocks can occur lower than breakers small little bounces and bear markets would be a mitigation block basically a bearish breaker will keep your ability to get to a bearish order block which will be
resting higher up in the premium when an old high is taken out that down candle right before the second high is made taking an old high or turtle soup in other words that down candle if it's retreated too that's going to be a bearish breaker that's going to keep you from seeing most likely high probability that it won't allow you to get to a bearish order block so whenever you see bearish breakers just don't expect the bearish order block to be hit okay because it's going to most likely keep price lower because that's going to
be the most dominant array of all these in here there is a liquidity void that would be viewed if there's no breaker you can close in that range and that may take you often to a fair value gap or a bearish order block but breakers by themselves even though they're low end on this list it's the first thing you're going to encounter because if you're at equilibrium and price has already been moving away from the resistance level you're looking up now for any potential areas to resell at first when you look at is the mitigation
block or bearish breaker and if there's neither of those you look for liquidity void to trade up into the close in that range warfare value gap to close in it may not be any of that then you would expect to see the bear shorter block to be traded to then that would be your selling opportunity because you're at a premium and you go to a logical area where institutional overflow would kick in new orders would capitalize and then selling would ensue if there isn't an obvious bearish order block okay um and there's very little times
that's like that but we will talk about that when we get into entry techniques and concepts but if there is a lack of bearish order block understanding and what you're looking at currently in the market action because there may be a lot of wicks something like that may occur again you would look for a rejection block which would be just above the body of the candles you would expect that to be ran out and then you'd be really high on the premium there and ultimately a whole whole entire run on the old high that would
be uh an expectation now i have here old high and old low why would the low be there well if you're on a very low end of a downtrend on a higher time frame monthly chart you may be rallying up to a old low if it gets to that old low even though it's an old low in in terms of price it's really high up in the premium if it's been rallying a considerable amount of time and price to get to that level so retreating to an old low that's resistance classic understanding but it may
need to run out of old high as well so basically all you're doing is you're you're scaling the grade of how much importance you're going to have on each one of these so again in summary i want you to understand what i'm talking about here we're not just listing the things we've talked about in in previous teachings okay i'm putting them in an order of significance when you're at equilibrium or if you're moving up from discount okay your expectations are to look for very first thing you look for in the list as price is going
up the first thing you're looking to see to encounter is there any mitigation block that i got to consider because that's the first objective it could be a selling point then it's a bearish breaker that could set the tone for another leg lower or stop any rallies on a bullish idea then the next idea if you're bullish from a discount or if you're expecting a new selling opportunity say you're at the equilibrium price point anything below the premium the expectation is when you're looking up in price for areas where price may go up to it's
in this order from the lowest up in other words from mitigation block all the way up to old high or low that's the order you would expect to see them now the order of importance you know it's the highest of the premium array is the old high and old low that's that's as high as you can get then you have rejection block then you have bearish order block fair fair value gap and liquidity void bearish breaker and mitigation block you're going to be looking up and the first thing you're going to encounter is the first
thing on the bottom of this list and then you start working your way up that list the farther you go up in this list the more deeper you go into a premium market certain arrays in here will keep you from seeing the next higher array in other words the next institutional order reference point that's listed in here if you get to a breaker chances are you're probably not going to go higher than that you won't generally get up in to close that void if there's a breaker below a liquidity void the liquidity void may stay
open basically that range may stay open so they kind of like it's in the order of importance as a trader when you're below premium and looking higher up for prices or expecting prices to move higher that mitigation block you know that's the lowest or the most likely one you're going to expect to run into first it doesn't mean that there's one in price action but you start from that expectation first and you look for it it's not there okay what's the next thing you've been looking for the bearish breaker if it's not there okay then
i'm okay to expect that void to close in there but there may not be a void it may have been a really systematic and efficient way that it traded lower and that won't be any void there so next thing is is there a gap that would draw price up into it if there's no gap then you go right to the order block okay but the main thing is if there's a breaker forget about closing in the void and forget about getting up to that gap because the breaker is going to take precedence over everything on
this list when you're below it in terms of market price if we were anticipating move lower into price into a discount or into a support level we would expect the very next pd array to be a mitigation block now again that may not appear in price if there is no mitigation block you would expect to see the next pd array in the form of a bullish breaker again this may not occur or be seen in price action but this is the order in which you would expect to see as prices going lower looking in the
past to the left side of your chart you'll be focusing on whether or not these arrays appear in price action their importance is again is listed from equilibrium the expected order of how they're going to be in the price action in the form of a discount the first one you would anticipate seeing is a mitigation block bullishly then a bullish breaker then a liquidity void now if there is a bullish breaker now again a bullish breaker is a up candle between two swing lows and the most recent swing low would be lower normally you're seeing
a stop run in the past and the high the swing height it forms between the two lows that up candle is going to be your bullish breaker so when price comes down to that bullish of candle it'll find some support if you see that in price action chances are that if there's a liquidity void in price it won't go down to fill that in it can if it overtakes the breaker but if it has a breaker anticipate price not going below the breaker and leaving the void intact again assuming there is no breaker and there
is no void but there is a gap and it may be a liquidity void any gap sometimes that can occur too but you would anticipate price reaching down into a fair value gap which is just a common little gap where price has only been delivered on one side of the marketplace and then the next array would be the bullish order block and again without the breaker you would expect the void to be filled a gap to be filled straight down into the bullish order block then below the order block would be a rejection block which
is just below the most lowest candle and its body in other words if it has wicks long wicks below it uh we're only gonna be looking for a move just below the bodies of the candle and that would be rejection block and then ultimately the deepest form of discount would be in the form of an old low or trading down to in the historic high and like we said when we were talking about the premium market when prices trade up to an old high it can also trade up to a very old long-term low and
that would both be in the form of a resistance level when we look at markets like this what it does is it gives us a framework you see here the monthly premium arrays these are going to be focused for primarily bearish premium array trading in other words you're going to be using these areas at which to frame a trade or look for bullish targets at these levels for monthly discount your bullish discount arrays these are your bullish discount arrays and you would be looking for these for bearish targets or looking to get long at any
one of these based on the current conditions in the market now the same thing is seen also for the weekly chart the weekly chart you're going to be looking at the same thing from equilibrium up the first thing you would expect to see when you're expecting higher prices are we going to run into a mitigation block bearish breaker if there's a bearish breaker you're probably not going to go higher than that but if there is no breaker you look for a void to close in or if your value gap if there is no fair value
gap or avoid price could just simply trade right up into the bearish order block and if there is an idea that suggests that there's possibly not a strong bearish order block there we would look for a rejection block which is a movement above the candles bodies if there's long wicks that top that market and then ultimately a run above the old high or return to a historical low the same things we just outlined for the monthly is seen for the weekly both premium and discount the same hierarchy and how you would expect to see these
arrays occur in price action this is the way they are seen and obviously the same thing is said for a daily chart nothing's changed the same hierarchy exists if we're at equilibrium and that's the current market action price and we're expecting lower prices the first thing we want to look for in the left side of our chart is there any mitigation blocks or a bullish breaker if there is anything less than that breaker probably won't be considered or retreated to the breaker has precedence over everything both bullish breaker and bearish breakers so we're going to
take a look at an example of all this information with our dollar yen example that we mentioned briefly in lesson number five money management was higher time from analysis using these ideas in 6.2 that lesson will actually give a real practical example