hello yeah uh in this video I will show you how to determine the optimal number of clusters in a cluster analysis using R uh this is similar to determining the number of latent factors in the factor analysis um I want to uh load in this our packages uh cluster facto extra NB CL and for graphing GG plot too okay so I already installed this packages in my R studio so I just load them in uh set a random seed sample size is 200 and we generate a data set uh with two clusters okay and uh
the variables we call them feature one feature two and this is the data structure uh for clustering so we wonder how many clusters are there uh we can plot out the data it look like that um like two clusters right uh there's a point uh in the middle uh which may become difficult to classify into cluster one or cluster two okay but we just uh um leave it there for now um okay so to determine the optimal number of clusters uh there are multiple approaches uh the first one is called the elbow method um we
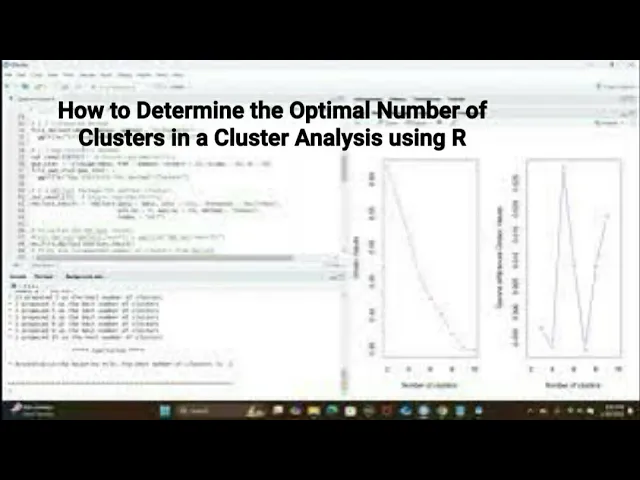
use the fvs uncore MB clust function um and uh the syntax is data K means so we tell this function we're using K means for clustering and Method WSS um please refer to the I refer to the our documentation uh to find out the technical details of a WSS so my art videos uh here are showing you the implementation of different methods okay so you can read the books papers and our documentations for technical details Behind These methods so let me draw it out uh so on the right hand side you can see the graph
this why we call it an elbow um graph uh it drops down from cluster one two one cluster to two clusters and then it become like a elbow shape so the optimal number of cluster should be two here okay the second one is the cell H te method uh if you remember the H cell H statistic um we talked about it uh the closer is close to one the better of the cluster um so we can use the the same function but different method method equal to sell hot and then it look like that um
so this one uh the higher the data points the better the clustering so also two clusters is the optimal one okay and there's another approach called The Gap statistic I think this is a similar um statistic uh compared called The Gap statistic compared to the sell hot value um so let's set a random seed uh we use the function class Gap uh to compute it uh with different options um and then we plot it out it look like that uh so similar to the cell H method um but this one this graph uh in addition
to the point estimates it also add the confidence intervals there okay but it also shows two clusters is the optimal number of clusters okay and then um you really want to if you really want to experiment many different methods uh MB cluster package uh is really written for estimating number of clusters it has so many methods implemented so we can set a random seed uh so this syntax the MB clust the data and then uh this equal to no uh distance is ukil in minimum number of clusters two maximum number of clusters 10 so we're
experimenting between two and 10 clusters meth equal to K means index equal to all so we want all the method uh you can see up there the output um it uh tells us there 13 proposed the two uh clusters uh two propose three five propose 5 etc etc so the conclusion based on the majority rule the best number of clusters two okay uh on the right side also there's some graphs about the D Index um you know that comes with uh this uh um function here uh it does have a uh fvs MB clust fun
graphing function but when I try to use it it keep give me some errors uh which I could not fix in the short time so I basically wrote another version uh I call it a my FV MBC class function I already um read it into my R session so I can just use it uh the detailed syntax is uh at the end of this uh R command file okay so let me just uh make the graph is a bar graph uh showing the frequencies of uh how many masses recommended uh a certain number of uh
clusters okay so you can see two clusters has the highest bar so that's the most recommended okay um so we choose two uh and uh if you want to be more fancy with numerical values then we can get all these frequency and we can pick where is recommending okay the highest frequency so it's two clusters so once you deter you have determined the optimal number of clusters you can rerun the K means clustering using the optimal K okay so here optimal case two we use the K means again uh and then we can took at
uh take uh a look at the sale hity width and uh this is what they look like so it's a two clusters and you can see uh the higher value they're all like uh um above 0.75 okay so they're pretty good there a closer to one the better um so uh okay uh and oh the next are the syntax of the my f MBC clust function okay so okay I showed you a few um methods for determining the optimal number of clusters in the cluster analysis using R um in real data analysis uh your data
may not be this clean um the Clusters may not separated very well uh so you may have some difficulty to make decisions okay um but um you know if you try the MB class function you get about 19 method uh you can try to um use the majority rule uh to help you to determine the optimal number of clusters okay all right uh thanks for watching yeah