in this video I'm going to explain step by step what I would do if I had to start day trading all over again this year and we're gonna do it in 30 days because it's the beginning of the month the birds are chirping and you want to become a baller day trader and speed off to retirement in your Lamborghini just kidding I cannot promise you Lamborghinis but maybe some Corollas um even if you have zero knowledge in trading I'll be sharing with you what I did when I first started and how you can get set
up and by the time you're done watching this video you know a direction of what to do with your day trading journey and hopefully turn this into a full-time career if that sounds good to you make sure to smash the like button for more beginner friendly videos like this if you're new to this channel welcome my name is Shay The Humble Trader I've been a full-time day trader for over 8 years now people know me for my no BS trading lessons strategies and my bad jokes involving my ex-husband Mike bag holder a common misconception about
trading is that it's all about buying nice Lamborghinis and Penthouse Suites but no it's so much more than that so let's get into it here is how to become a day trader in 30 days week number one and your first step is to keep your day job alright this is a very important step for you to get started as a day trader the right way when I first started trading I was working full time in VFX film industry even though I absolutely hated my nine-to-five job hold up hold up it was more like a nine
to seven job let's be real here but the full-time job was very necessary for me thankfully I get to use my employment income at a time to replenish my day trading account during that very painful process and because I kept my job I never have to worry about making enough profits from day trading to live which was very important for my mental and emotional health it allowed me to take the time to learn and experiment with learning new strategies in trading I'm not quite sure how long it usually takes for new traders to become profitable
if you have a figure in your mind please do let me know down below but for me it took me over two years to become consistently profitable remember most beginner Traders lose money it's almost inevitable so it's very important that you have another stream of Revenue so you can survive while you are climbing that very steep learning curve in trading step number two learn for free the next step I would recommend you to take during that 30-day process to become a day trader is to consume as much free day trading content as possible there's tons
of free resources available online with the internet you can get started with whatever information you want at your fingertips YouTube and Reddit were really the two sources of free information and content when I first started I used to spend hours there looking at people's Recaps or trading strategies besides those here are some of my favorite resources video playlists for beginner day Traders on YouTube free market research websites such as finvis and of course the finvid screener I will use that to research for stocks to potentially play the next day for stock market news articles I
would look at Yahoo finance Seeking Alpha Bloomberg and of course finvis once again for free trading tools I will use trading View and and think swim and now many years later I've also created an extensive playlist for beginner day traders in recommended orders for you and all that is available for you to watch for free besides that I also have a free weekly watch list that I send out every single Sunday the emails will go through some of the current market news of the week and provide you with analysis of the top four stocks that
are worth watching in the coming week I'll leave links to sign up down below again the playlist and the weekly emails are free to sign up now at this stage you're probably thinking okay Shay I'm kidding my job I have money saved up and I signed up to your free emails and watching your videos let's start trading not so fast that was the easy part now comes the hard part remember into smash the like button okay just kidding but if you're serious about day trading as a career please leave any questions you may have down
below and I'll do my best to answer them now moving on to next part of your 30-day journey to become a day trader step number three paper trading and opening a brokerage account paper trading means you are trading with fake simulated money and why should you trade with fake money first well the reality is if you're brand new to trading you're probably going to lose money first like I mentioned earlier in the video I lost a lot of money when I first started trading that's the reason during your first week right now I would recommend
you or any new traders to open a simulated trading account also known as paper trading and I know your follow-up question must be okay humble Trader which broker do you recommend to start with paper trading well there are many choices to choose from to get you started here are some of my recommendations first of all trading view this has not become my favorite Jordan platform surpassing think or Swim I really like its versatility across platforms it's available available on your phone's PC MacBook and since it's a web-based platform it's available to anyone around the world
best of all you can get started with it with a free version online I use it to point out my technical analysis on specific stocks in the evenings and if you do require Market data it's adding additional cost of around 15 a month tradingview has gone through a ton of Transformations over the years you can now connect it with a whole list of Brokers once you're ready to go live I really do like the interface a lot as you see me using in so many of my YouTube videos the second recommended broker for paper trading
is Weeble which is a free commission broker platform while I do not recommend free commission broker apps for live day trading for paper trading it's totally fine especially if you're brand new and want to just get started with paper trading and learning charting and technical analysis the user interface on weibo is very beginner friendly I personally use their mobile app to track the stocks I'm watching on the go they offer free live market data so that's definitely a bonus they're also available on desktop platforms on both PC and Mac another good option for paper trading
is interactive brokers available in U.S Canada and many countries in Asia and Europe interactive brokers is probably the stock trading broker with the most extensive Global footprint with interactive brokers you do need to purchase the live market data subscriptions in order to receive live quotes I believe the packages are about 20 to 25 dollars a month which is not bad at all if you do consider opening an account with interactive brokers these will be the data packages to purchase for both paper trading and live trading so those are my recommendations for paper trading but when
you're ready to open a live trading account I would recommend these ones interactive brokers trade zero and Center Point Securities I personally have accounts with all the Brokers and platforms I mentioned today you can check out all the links down below I'll say right now that there's no perfect broker out there there are pros and cons for each one some are only available in the US and some are only suitable for bigger accounts but we'll have to discuss that in another video if you have questions about any of these Brokers feel free to ask me
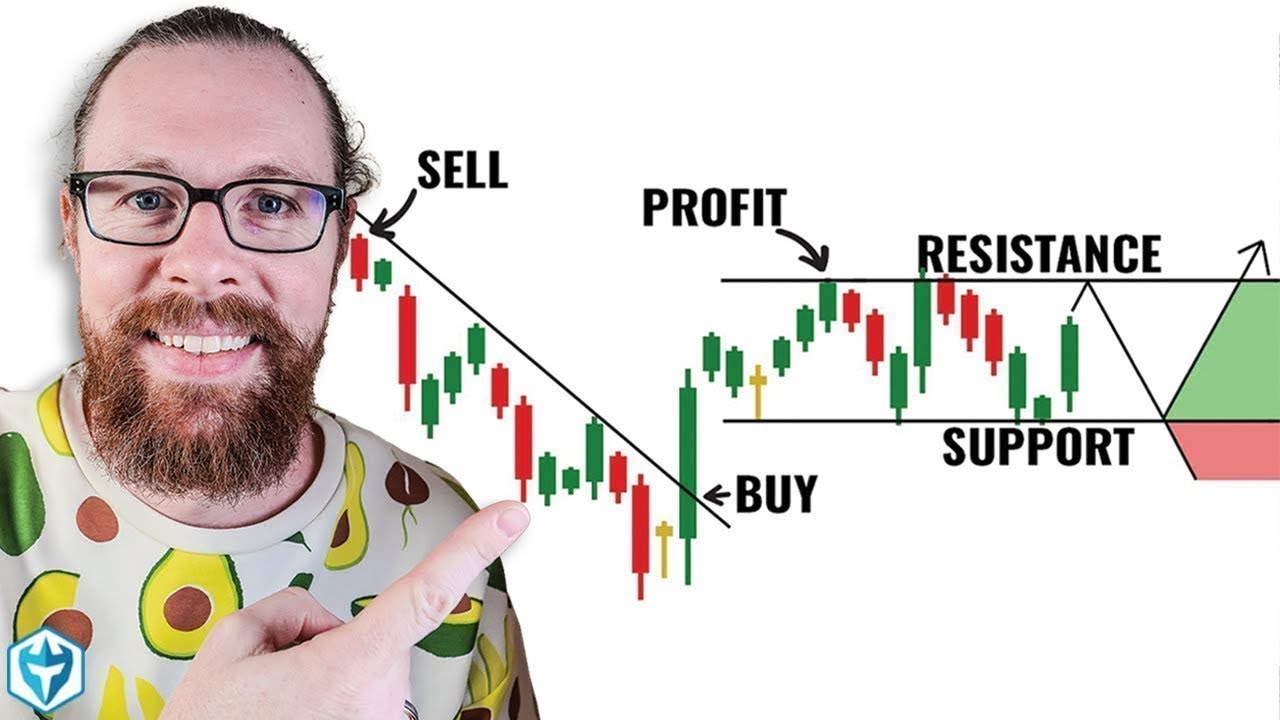
in the comment section below now that you have your paper trading account and live trading account open with a broker it's time to move on to the next step in week number two you're gonna take step number four learning technical analysis now that you know the basics of trading and have a broker platform to work with you have conquered one mountain now it's time to climb another one and that will be learning technical analysis and you cannot complete learning technical analysis without understanding support and resistance levels when charting so that's what we're gonna start with
our trading view platform over here looking at the stock and video remember support levels are historical price levels where buyers step in to buy the stock therefore you'll see the stock bounce off the same price multiple times in the past because they are buyers around those areas to support that stock we can sold off to those levels so for a stock like Nvidia on the chart you can see a clear support around two tens over here that area it's bounced off once twice multiple times before and also another clear level over here when the stock
has sold off to around 170s over here and bounced off over here once twice three times in the past another time here and here over the course of the last 12 months on the other hand resistance levels are historical price areas when sellers step in to sell the stock so whenever you can see the stock rung into those similar areas again buyers decrease released and sellers decided to take profit or just get out of their position so a good example here is once again on Nvidia you can see that over here right the stock peaked
out around the 229s area if you line that up back to historical price levels you can see some similar selling pressure and resistance back here in almost a year ago over here again as well and same area you can see the stock have bounced before off of our 170 support before but then when it reached around this area 194 that's when it sold off around the 195 194 Syria and it reached that same resistance once again a couple of months later and the stock sold off here are three quick tips for you when drawing support
and resistance and basic technical analysis find the extreme highs and lows these shapes and W shapes on the chart so you want to find the most obvious points you're looking at so in this case right the previous resistance that we drew this is an obvious point of resistance over here Wayne peaked out and sold off so over here so this is another v-shape on the support area here you can see the stock from a v-shape shape on the sell-off and bounce so this area is also another significant support over here once again you have another
v-shaped recovery here so another area of support down here around 115 and over here when it forms an upside down v-shape when it peaked and sewed off that's another resistance tip number two you want to look for areas where the stock at contact points of at least two or three more times in the past before the more the merrier so that's the reason you can see on our charts all the levels that we've drawn it's touched the stock at least three times once over here on this level 194 once twice three four times same as
resistance once twice three times Support over here 140s ones again over here tip number three is to zoom out to the daily chart or the weekly charts there's just too many traders who are just focusing on the short term time frame during intraday trading you want to be looking at a bigger picture that's the reason we're looking at a dating chart and if you're swing trading you want to be switching over here to the weekly chart that's what you should look at if you're swing trading if you actually made it this far into the video
let me know down in the comment section below and remember to drop a like and a video if you find it very useful drawing support and resistance is by no means the only technical analysis topic to study there's also price action trend lines and so much more if you want to learn more about it later on I have many more videos going in depth about this topic so make sure to check out the videos listed down below now in your third week which is days 14 to 21 of your 30-day journey to becoming a day
trader you should focus on repeating the exact same process as mentioned in the previous steps keep learning about trading and various strategies online using free resources practicing technical analysis and familiarizing with your new trading platforms then moving on to your fourth week now it's time to bring in the big dogs step number five calculating your own risk management profile you know people always say you should save the best for last this is certainly true for risk management and day trading I saved the best and the most crucial part for step number five without risk management
you'll never become profitable period even if you've done all the steps earlier the reality is no one can predict whether a stock is going to go up or down with 100 certainty at any given time therefore as Traders we can never truly control how much profit we make but we can definitely control how much we lose and how do you actually Implement risk management in your own trading well I'll show you that right now okay so we're going to start with calculating your own personal risk profile according to your account size so you can see
on this calculator here if you're trading with a five thousand dollars account and your max risk per trade should be anywhere from one percent to three percent one percent which is the example over here will be someone who is very conservative if you're trading five thousand dollars using one percent you should be only risking fifty dollars per trade or if you are a little bit more you know even more conservative fifty dollars per day if you take two trades per day that means you're risking 25 per trade however if you are more aggressive then you
can try using two or three percent risk per trade so in this case if you're using the same five thousand dollars your risk per trade is a hundred fifty dollars and just change this figure to however your account size is let's say if I'm trading a bigger account twenty thousand dollars then I will probably risk around one to two percent for my own taste if I was starting out this will be the figure for your max risk per trade so that means for those trading a small account under five thousand dollars no more yoloing and
trying to risk five hundred or a thousand dollars per trade you should be looking at these more conservative numbers here so now that you've calculated how much you should be risking according to your account size I'm gonna show you the relationship between risk award ratio and profitability so we're using the same five thousand dollars account as we had earlier and we're risking two percent per trade now in this first simulation over here we're risking one to one meaning that when you're trying to make a hundred dollars you're risking that same one hundred dollars so in
this scenario if your win rate is only about 50 percent which is the case when most new Traders you can see that you know five out of ten trades you lose a hundred dollars around that and five or ten trades you make 100 you end up a losing Trader right you are break even about like negative ten dollars but this is not accounting into any fees or commissions and realistically for most new Traders the win rate is sometimes a lot lower something closer to 40 percent or even 30 percent then you can see you know
if you're risking one to one you won't be profitable in this second simulation over here you can see we're still using the same two percent risk but now the risk award is skewed to one to two so instead of risking a hundred dollars to make a hundred now you're risking a hundred dollars to try to make two hundred dollars now with the same win rate you can see that the numbers are drastically different than the first simulation so you know you can see that you know you're still losing 100 for the five trades but for
when the times you win you're making two hundred dollars or more and with a low win rate of 50 percent you are profitable of around five hundred dollars now even with let's say you know only forty percent win rate what does that look like even with 40 win rates you'll still come out ahead a hundred eighty dollars this is what happens when you really plan out your risky word for all of the trades making sure you could add the minimum make one to two risk award or even better yet one to three or more that's
it if you actually increase your win rates to that say 60 what would that look like at this stimulation over here you can see that when you have a risky word of one two three meaning that for each 100 you lose you're potentially making 300 or more you are indeed very profitable with a win rate of 60 or even lower let's see if the win rate even is at fifty percent you're still very profitable so yes you want to work on increasing your risk award and if you can get to a point of 50 60
or even higher 70 win rates that's when you'll see your p l curve really Propel and you'll see some exponential growth in your trading account so you can see from the demo we just did over here risk management is the foundation in day trading if you don't manage your risk and always lose the same amount as your profits or even worse lose even more then you will never become profitable especially if you are trading a small account so start today use the same calculation method I just showed you to find the proper risk profile for
your account size guys and girls I'll be honest here it takes way more than just 30 days to master anything but I hope you can get some insights into the order to start learning day trading I included links below to everything I mentioned in this video if you want to check them out next up I actually have a free technical analysis crash course for you to watch so make sure to check out that video over here thank you guys so much for watching as always I'm the humble Trader and I'll see you guys next time