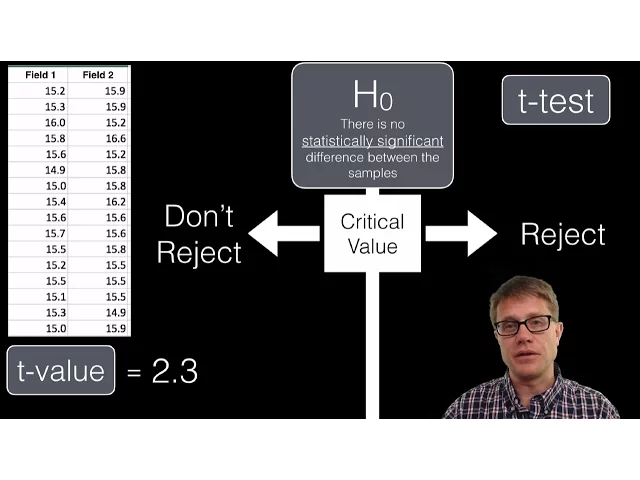
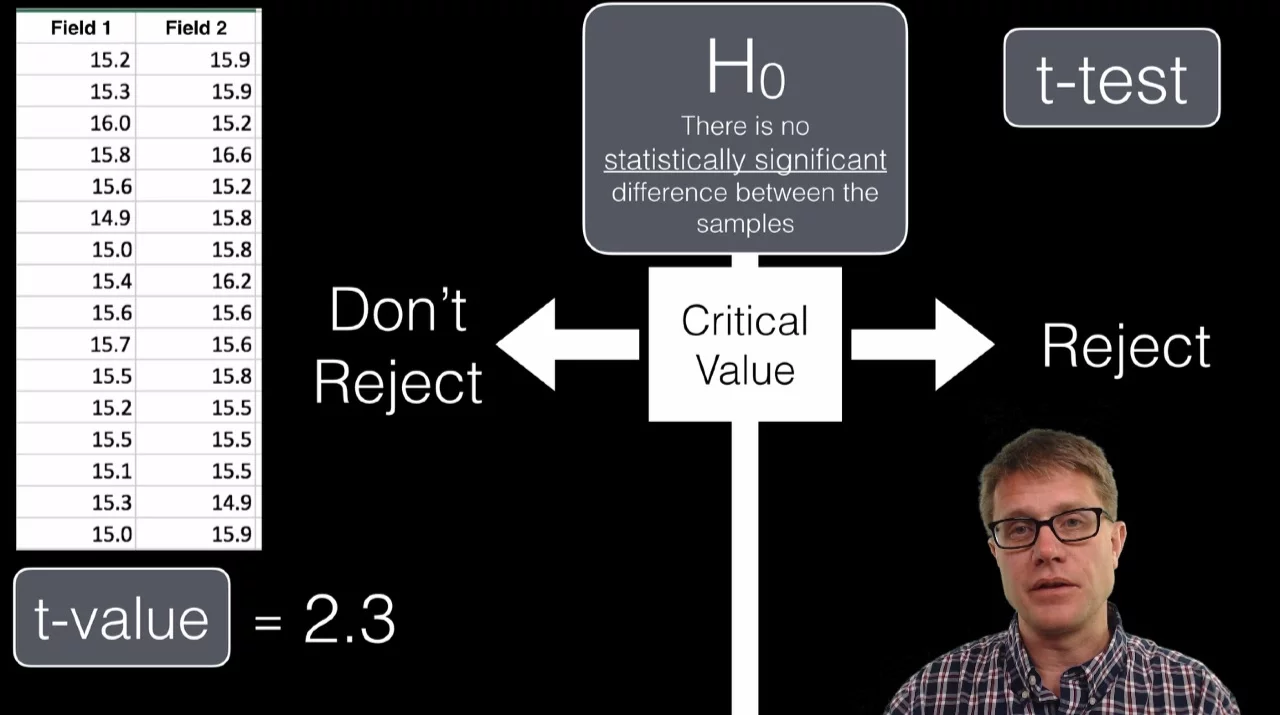
the t-test was developed by william sealy gosset he worked at the Guinness brewery over a hundred years ago and he developed this test to determine things like the difference between barley yield now he wanted to publish this statistical test to share with other statisticians but the brewer was nervous they didn't want him to publish they didn't want him to give away any secrets he finally convinced them but he had to publish under the pseudonym student so instead of this being known as the Gossett's t-test it's known as the so in this video I'm going to start by conceptually showing you what the t-test is I'll then show you how to calculate the T value run a t-test and then finally how to do a t-test in just a few seconds using a spreadsheet so imagine I have two fields of barley field one and field two and I want to compare them but I don't want to cut down the whole field I just want to do some samples samples from one samples from two so I could get a sample from field one now won't be a perfect normal distribution like this it's going to be more of a histogram that looks like that and then I'm going to get a sample from field two now which one of these has a higher yield well we could figure out the mean we could figure out the average of each of those samples and it looks like the average in field two is higher than the average in field one but that's only part of the picture the mean only tells us so much because we could have different distributions and depending on that distribution or the variance within that sample there could be a statistically significant difference between the two or not and that's where the T value comes in handy it's really a ratio of signal to noise signals going to be numbers that tell me the difference between these two samples and noise is going to be numbers that kind of get in the way so how do I figure out the signal well the easiest way to do that is simply find the difference between the two means and so if I calculate the mean and sample one we'll call that X bar one and X bar two the absolute value or the difference between the two is going to tell you how much signal it there is how much difference there is now how do we get at the noise that's going to be in the variability of the groups themselves and so the factor is going to look something like this what is s 1 that's the standard deviation remember that's how far our data is spread from the mean but we're not only again the standard deviation we're actually squaring that that gives us something called the variance and so if I increase the variance that's going to lower my value it's like giving me no more noise now the other factor in here is going to be the number of samples that I'm taking as I increase the number of samples that will actually increase the signal up to a point and so again the difference between the means is going to give us more signal higher T value and increasing that variability is actually going to decrease it so let me show you how to calculate that T value I'm using Excel but you could use Google sheets or even your TI calculator so if you look at these two samples from field1 and field2 can you tell which one has a higher yield it's really hard just looking at it is there a difference between the two and how much is that difference I will use the T value to calculate that first thing we have to figure out is the mean so in a spreadsheet you hit equals average instead of mean I'm going to put left parenthesis and now I'm going to select that entire sample set from field one and parenthesis and then I'm going to get a mean of fifteen point three eight now I can select that and drag over and now I get a mean of fifteen point six eight in field two next thing I have to figure out is my standard deviation so that's equals stdev left parenthesis I'm now going to sample that field one and now I put in parentheses so we're going to have a standard deviation of 0. 3 one to four I'm now going to apply that into field twos data set so we have a higher standard deviation remember I now have to calculate the variance to do that you have to square the standard deviation so I'm going to select that cell and bring it to the second power so there's my variance for field one and now here's my variance for field two and then finally I have to know how much data I'm actually collecting so if you hit equals count that'll count the number of data and so I'm going to count those and we get 16 so we got 16 and then it's going to be 16 in the next one as well now you could use a spreadsheet to calculate this you could do it by hand it takes a long time to figure out standard deviation by hand so it I encourage you to use something like a spreadsheet now I have all these values I'm simply going to plug it into my T value like that so we've got the signal on the top so I'm going to find the difference between these two and then I'm going to figure out my noise on the bottom remember you have to divide this add it and then take the square root of that so if I do the work for you we've got a signal of 0. 3 0 an o 0 point 1 3 so I've got a T value of 2 point 3 what does that mean since it's higher than 1 that means there's more signal there is noise so I'm going to put that over here to the side because this video is not about the students T value it's about the students t-test so now we're going to run a t-test what are we testing we're testing our null hypothesis just like we do in a chi-square test what we're going to start with is a null hypothesis that says there's no statistically significant difference between the samples in other words any difference that we would find is B simply due to chance you then identify a critical value a number if our T value is lower than that then we don't reject our null hypothesis but if we get a T value that's higher than the critical value then we reject our null hypothesis there must be an alternate hypothesis there could be something going on between these two fields now how do we find that critical value we'll use a tea table that looks like this it looks confusing but it's really not that bad so this would be for a two-tailed test and I'll show you what that means in just a second first thing you have to know is what probability are we going to use generally in science we'll use the point O 5 probability so that's going to be this column right here what does that mean well this is an inferential statistic it means if we were to do this sample a hundred times 95 of the times we would reject the null hypothesis and only 5 percent we wouldn't and so it has a lot to do with chance so I'm going to use that point O 5 now we have to figure out what row we're going to do and to do that we have to know how many samples we collected and figure out the degrees of freedom so the degrees of freedom is going to be the samples of N 1 and n 2 minus 2 so since we took 16 from each it's going to be 32 minus 2 or 30 degrees of freedom so here's our critical value our critical value is going to be 2 point 0 4 so is our T value higher than that so this is where we're doing the actual T test are we higher than two point zero four we are and so what does that mean we're going to reach our null hypothesis that means there is something statistically significant between these two sample sets now it's not much higher than that remember it's just 2.
3 and if we were to look over here to the 0. 025 probability we can see that we're actually lower than that so we're not positive but we're pretty sure that there's something statistically significant between these two now that was a lot of work we had to calculate our variance our means our sample size and then find this table the nice thing about a spreadsheet is it can calculate a t-test very quickly so what I'm going to do is put t-test here and then I'll just write in this next cell equals t-test so there are four things I have to put in for a t-test the first one is going to be my sample set will say from field 1 so I'm going to select that then I put a comma in now I'm going to grab my data set from field 2 and then I'm going to put another comma we're doing a two-tailed test and this is an independent test I'll show you what that is in just a second but you can see in just a few seconds we've calculated my probability or my p-value what is it it is point zero two six what does that mean it's slightly above point zero two five and somewhere in between point zero five and point zero two five what does that mean in just a few seconds we're able to realize that we need to reject that null hypothesis so it's really simple in a spreadsheet to do a t-test very quickly now we did an independent t-test or an unpaired sample what does that mean we had two different fields that we were comparing so you could be comparing for example two different populations you can also run a paired t-test and you would have to select that when you're running the t-test what would that be is if we're sampling the same population twice so maybe we're looking at field two but then we're applying a chemical and looking at it again that would be a paired test we're also doing a two-tailed test and so when we're figuring out that probability of 0.