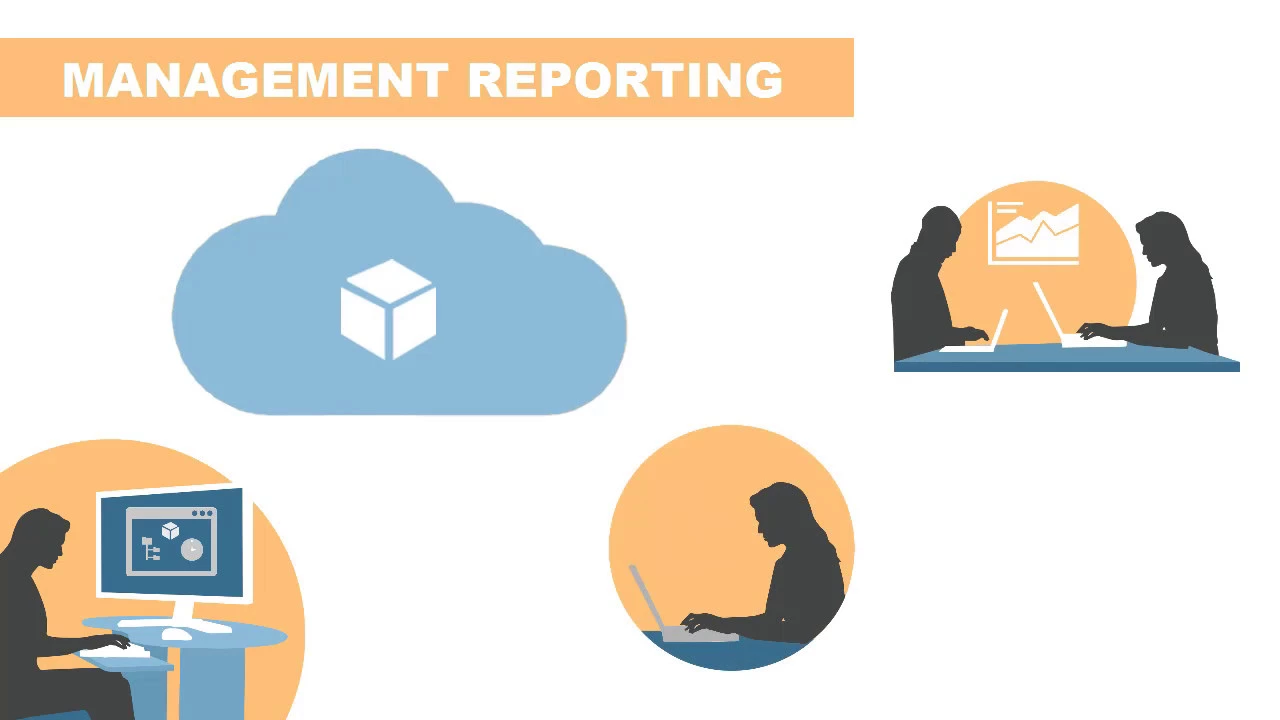
[Intro Music] Profitability and Cost Management is an Oracle cloud solution for cost and profitability analysis. Its secure, user-driven modeling environment helps you take financial data and transform it using complex multistep allocations and calculations. This data modeling lets you create the management reporting data you need, such as: Strategic, multidimensional profit and loss reporting Product and service cost reporting Cost awareness in areas like quality, support, care, delivery, and service Cost control, reduction, and benchmarking In this overview, you’ll see how management ledger applications in Profitability and Cost Management provide a reliable, flexible, business-focused platform for transforming financial data and meeting the need for financial data in operational reporting.
Applications use Oracle Essbase for multidimensional analytics, and leverage the Oracle Enterprise Performance Management platform for metadata and data governance, integrating with other Oracle EPM pillars such as Oracle Planning and Budgeting Cloud. Many management reporting needs require a complex series of transformations of your financial data, such as a waterfall of allocations, or multiple iterative calculations. Profitability and Cost Management provides a powerful platform for managing these complex transformations in an easy-to-use interface that puts administrative control in the hands of business users to build, maintain, and execute models.
A fully calculated model lets end users perform analytics and create management reports and dashboards. Applications use rules to control allocations and custom calculations. This enables business users to create and maintain calculation logic without any reliance on IT for programming.
You can sequence rules and group them into sets, giving you a granular level of control over the order of your calculation logic. Because rules are relationship oriented, you can create broad, complex allocations in the user-friendly interface without any custom coding. Simply define your sequence, source, destination, driver basis, offset, and context, and your rule is ready to go.
In this example, Facilities expenses for the Corporate cost center are allocated to the Facilities account across multiple cost centers. The Occupancy Square Feet account is used as a driver for the allocation. The offset for the allocation is applied to the source.
And the multidimensional context for the rule is taken from the rule set definition. Because of the sequencing of the rules in the rule set, this allocation is performed only after utilities expenses have been adjusted. What about visibility?
The Rule Balancing page gives you full audit and trace capabilities for all your calculation logic, and automatic documentation of calculation processes. The blue, underlined numbers on the Rule Balancing page are context-sensitive links that open ad hoc Smart View reports for further investigation. Profitability and Cost Management layers your calculation logic on top of your source data without changing it, making it easy to undo or redo calculation of a single rule, a rule set, or all of your calculations at once, an unlimited number of times.
Dashboards and Intelligence give you powerful analysis tools that let you create dashboards, graphs, and analyses such as profit curve graphs, key performance indicators, Smart View queries, and graphical allocation traces. And the Reports screen leverages Financial Reporting as a companion analytical tool that understands your model for pixel-perfect, production-grade reports. In this overview, you saw how Profitability and Cost Management gives business users the power to model financial data for management reporting.
To learn more, visit cloud. oracle. com.










![Data Modeling for Power BI [Full Course] 📊](https://img.youtube.com/vi/MrLnibFTtbA/maxresdefault.jpg)




![Meem Se Mohabbat - Episode 16 [CC] 6th Feb 2025 - Sponsored By foodpanda, Master Paints, Skin White](https://img.youtube.com/vi/lRZkMzpeWIM/maxresdefault.jpg)