the title of this video is my question Koons explains ends time and price squared this is a very important concept and lies at the root of every single thing W began ever did with a trendline or with the planet he was constantly looking for that one point when time or longitude was equal to price one of the least understood phrases as time and price squared or time and price are equal that we began popularize these phrases in this market courses but few people actually understand what they mean they have often been associated with a 45-degree
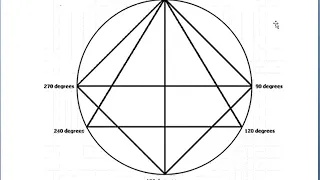
angle since it is the diagonal of a square and as such represents one unit of time for one unit of price so every point along the diagonal is one unit over in time and one unit up in price too over 2 up 3 over 3 up etc we use this phrase time and pray squared since only at the equality of time and price can markets reversed this is the fundamental principle of Gann that markets only reverse when time and price are at equality countless thousands draw hand charts with one by one grids and precise 45-degree
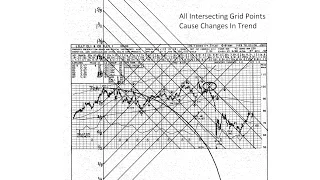
angles and software engineers advertise the absolute precision of their scaled charts but most of this is wrong if you look at this chart here we see every single diagram is basically drawn with a 45 degree angle it doesn't look like a 45 degree angle but by our definition of one unit of time and one unit of price all of these could be said to be 45 degree angles it is this relationship of time and price which is so important then this is where it ends theory of reversals come in when you have a time in
the price that are absolutely equivalent have you ever stopped to think about why a trendline actually works we see trend lines all the time and it hits a trendline the price and it bounces up off it hits it again it bounces a profit but if we really look at them we see there's a downward direction and it hits it there's some kind of equality here and it bounces off again so every time it hits the trendline you are at a price and time equality now let's not think about right now whether or not this is
a 45 degree angle but if it's working there is some proportion that what that has an equality of Tournament price otherwise it wouldn't work obviously if you go over 300 days and you're not up 300 points it doesn't seem to be a true statement but it really is but first we're going to have to examine the concept of time you know for a million years man has associated time with planetary movement usually the Sun or moon or combination cycles of Sun and Moon the ancients did monumental work in constructing the Great Pyramid Stonehenge the Mayan
pyramids and countless other structures to get precise planetary movements in an effort to catalog time passage being always referred in this courses to trend lines of one point per day one point per week and one point per month as typical trend lines are what he more commonly called them average momentum lines or trendline averages you must keep in mind that there are two distinct energies that can be tracked the unit of time and time and price calculations can come from either of these pure numbers like a top of 3,000 moving 3,000 minutes 3,000 hours 3,000
days or other fixed units without regard to weekends or holidays but just trading bars this is numerology the more common use is geometric and this varies slightly and is a planetary origin like the ancient recordings of the movement of the Sun the moon and the planets since the planets are elliptical in their orbits and they vary in speed within the location of their orbits these time periods vary on a day-to-day basis and the trend lines created from them are more like Gans average momentum line but then use the planets as precise timekeepers so the representations
previously of various slope triangles all equating to one unit of which is planetary longitude and one unit of price aren't correct 45-degree relationships if a top price is $73 and you move the moon or any other planet 73 degrees longitude then time and price will be equal and you will see a change in trend pure numerology works well but so does perfect geometry which lies at the basis of planetary movements this next chart was featured in my July 12 2009 teen stock cycles forecast newsletter clearly showing the potential for a plunge near August 1st based
on the geometry of this chart where we see some support angles connecting the lows and the support arc is accelerating up into a parabolic and was about to go maximum bullishness in this time zone where the market would normally top out and go plunging down here we see the outcome and it's up to date as of September 6th note the straight down crash predicted on August 1st actually came about exactly at the intersection of defensive applies this year the supporting of the you supporting arc down from below culminated in a high and the resistance arc
was coming down and we had a trend line through this vesica places right here intersecting the 28 20 and when coming up from the lower area up through 28 20 and the market plunged right to our 28 20 point and started to rally now to keep pivot will be this 2967 mathematical point here now normally on the cycle since the bullish arc had culminated you would expect it to fail similar to this pattern which also had a straight down plunge there at that intersection point and then you win sideways and then your water fall down
to this arc which would be down here on December 3rd but as long as you're making higher bottoms the technical trend is still bullish and it's possible to redraw these angles off a little bit different and have this arc common at a high on December 3rd which ties in more with the planetary combinations would call for a top in early December so the key will be whether or not we break a swing low if you ever go back home to 28:20 you're likely gonna go down to a low and have another leg just like this
otherwise the length of this leg will be added to the top and you'll have a projection of somewhere right up in there I might add that the best time to use the geometry is when you can tie it in with the planetary things usually that's the key of a good forecast a confluence of the geometry of the chart showing the footprints of the planetary energies and the actual planetary aspects giving the culmination date on July 31st right up at the top here the market was resting at least emini at 30 30 was the price and
Mars was 150 degrees to Neptune which represent panic and fear now if you take cycles from that 150 Neptune and he add 8 times 360 you get a price equivalent of that 150 aspect of 30 30 so the 30 30 price was culminating at that translation because of an Mars Neptune angle and as soon as that hit it broke and fell down to the mathematics my previous a YouTube video again Astro shows the another geometric approach using the Mars Jupiter converging triangles in the 1948 soybean chart but each of these shows that the prices themselves
will translate into the angles or longitude of the planets on the key dates that the geometry suggests in many of my other books and courses and videos you've probably seen this picture before where I say that time and price are interchangeable and the low in 2002 was a price of 760 850 but since price equals time we can say that there's a time component in there of 76 85 remember when we translate these things in the subconscious minds there are no decimal points so 7 6 850 is the same as seven point six eight or
seventy six point eight or seven six eight point five zero so the decimal point can be moved around in this case according to gams usual one point four day week a month I've chosen months and I use seventy six point eight five months using the average days in a month and it gave me the exact number of days until the next bear market low on March 6 2009 now you may have wondered why I chose months for the relevant time period but that was a disguise like and did with his one point per day week
and month these represented average planetary movement cycles with one point per month the exact Saturn movement over a year if anchored near the month of August this will vary slightly do the retrogrades and direct but usually nearly july-august period they come out to an exact count of 12 degrees per year or 12 24 36 48 for each year down the road and in this case I was using my Saturn trend line and I knew as the market headed down it was going to hit that Saturn trend line in most likely bounce on the date of
the low or though it did translate in the 666 as we'll see in a minute was something else the Saturn trend line was down here around 668 I believe were 6 of 80 and it was going to bounce off of that marker bouncing off a trendline however it doesn't reverse the entire bull or bear market you usually need price and time equality or at least a major proportion of time and price equality to get a major reversal so let's see an example are going up to the 2007 top to see how this work here's an
example using Saturn from the 2002 low up to the 2007 top and I'm using various trend lines on Saturn a 4 points per degree 4 degrees per point 8 degrees per point 12 degrees per point and that one actually hits the high tick here so we're using like a gam fan where we're doing the number of excuse me points per degree as trend lines and we see at the top the square root of three and if you looked at my earlier videos on the science of numbers you'll see that all major proportions in the stock
market are the square roots of two square roots of three and the square roots of 5 and they'll show up all the time so if we take the square root of 3 times the 65 point four eight degrees that Saturn moved from this low to this date we multiply it out we get 113 we add cycles of 360 degrees of a circle to get us to the relevant price area and we find out that's equivalent to 1553 which was really an exact top right here as well as since it was a twelve by one angle
twelve times that price equals 1554 so we had some proportions that were very strong here all coming out and you were resting right on the trend line from the low note also have from the first top which was the theoretical top that year this one was a five year anniversary of the low but then when the market broke the Federal Reserve pulled out all the stops cut their interest rates and in GM the market uptick here but note this trend line as it approached and you hit the trend line again you squared out this high
here right on the trend line on the date and that reversed the market then turned it into a bear market my previous books showed how you would have gotten the final low regardless once you were going down using the tangent of 30 the tangents are explained in my square of the range trading system books now you can use science tangents cosines with prices but the top at fifteen seventy six you take the tangent of thirty and subtract that from the high and you get the low so one of our principles has always been the time
and price of future bull and bear markets beginning and endings will be somehow incorporated into the final price of the high or low usually at major highs and lows though all the planets will come together and in the March of 2009 cycle it was primarily a Mars and Jupiter conjunction here's my little program again you get this with the volume one of my planetary of books and we see here Mars and Jupiter have an angle where they're going to a conjunction the zero angle which hits sometime between the night of the 6th and the 7th
and it occurred where the individual longitude here's the Mars longitudes and here's the Jupiter longitudes and if you subtract the longitudes from each other you get the angle between them so on the day the angle is zero or a conjunction and this is helio by the way they were sitting at 308 so we translate the longitude of the planets or the angles of the planets we've translated into numbers and we get 308 plus 360 gives us a target of 668 verses our extreme low tick that day of 666 so this was an example of the
new Mars Jupiter conjunction translating into the low price on the low-priced day the usual way we find out about price squares are through the use of trend lines and we square out things again said there were three things you can square you can square the high you can square the low or you can square the range so from a high to a low most of the times we square a range let's say you have a low of 50 and a high of 75 the range would be 25 between them so the lowest number that was
square out first would be the range and then the low would square out and then the high would square out here's an example using trend lines this is a proprietary trendline I only teach in my seminars but many other trend lines of works certainly all planetary turn lines work perfectly and there are a few other ones like my Jenkins two trend lines at work but I'm using this one because it demonstrates fairly well what the principle is here at our low we have put on a trend line and when the trend line goes up and
it hits the previous high this is a bear market drop let's say when it hits the high by law there should be an equality of time and price along this trend line and you should get a reversal and trend the market had been going up you square out by law it has to go down so where does it go down - it goes down until you get the next square out the next square out after the range would be the square of the low now if you had a big chart you could start at zero
and go up and when it got to 140 you'd be squaring out the low if you don't want to change your chart that way what we do is we double this range here we go from 140 up to 281 and we can use the same trend line and go up to the price of 281 and that would be the same as a zero angle starting down under the low and coming up to hit 140 at that point in time and then you get a square out and if you've been going down you have to go
square out and go up the beauty of actually doing zero angles like ended is you will find these correspondence here that you didn't notice they will follow up here rather than just get a point in time that looks like a low you'll also see some of the mathematics of the trendline coming up and then you will finally get to the point where the zero angle squares the high and at that point again time and price are squared and you must change your direction and you'll be going down now trend lines work well but the best
things of course are astrological trend lines and they're much easier to use so if we have a high here at 243 and a low of 141 let's say the range would be 102 so rather than having to draw the trend lines and stuff all we have to do is move our planets the range to 102 so here's my little program again over here and they punched in planet Mercury and starting with the origin date and I take the distance it's moved and it's moved a hundred and two degrees right on to this date and note
that this date is the exact hi so it has squared out then and by law we have to change direction at that point we don't have to wait for a trend line or something to break a week or two later we know at that point the uptrend is over and they have to be going down so this is a this is an easy way of using planets you can use the moon you can lose Mercury Venus all of them will give you various trend lines square out some will be much bigger than others and some
will be the small a told three days three weeks three months but every one of them in turn will reverse the market as it goes note to down here the high price was 243 and if time and price are equal well the 243 would be equal to a longitude of 243 so if we went through my program and looked up the longitudes and we found out the date when mercury hit 243 it would be this exact low that is when the time and the price and the time or longitude were equal and you must reverse
now note there's a double bottom here this double bottom is because of this next top that needed to be squared out this next type of you know I don't see the price on here maybe it's a 265 so you'd have to go another 25 points or so and that's what happened here this distance there is another 20 or so points of longitude on Mercury and this was the extreme high in this whole time frame so that extreme I was squared out on this low as the extreme low and then you went straight up again right
after that so we will find it is the converting of the prices to time in most cases and here's a price for example 16 7 team and what we want to do is subtract the circle of 360 360 360 until we get a leftover price within 360 degrees and in this case it's 177 so that's the price but we're going to say price is equal to longitude so 177 is both the price and it will be a longitude we then go over to 9 for September 4th and we find the longitude of the excuse me
the longitude of the the Sun over here was 177 and then you reversed and you went up again the price at this top occurred where the longitude was 162 and the price equivalent was 250 so we could either move it 250 degrees to this little reversal or we could go to the date when 250 degrees longitude was that deep which is this high whereas the date here the longitude was 162 so we could move the longitude another 162 or we would now be at 324 and that would also give us a major low if we
take this low right here the price of 1307 we convert that to a number within 366 or 360 we get 227 as a longitude now that longitude will hit until November 19th off the price scale so what I did to find a major harmonic of 2 7 to 27 I took one half of it to get a hundred and 1350 I looked up when that hits and that hits on July 16th was 1/2 of that in July 16th was this major top right there so we are seeing every one of these Peaks the highs and
lows the little reversals the big reversals here's an anniversary date again of the top when it returns back to 162 every year we find out on the dates when the price or the time is equivalent we reversals in the market most people miss completely that these numbers converted also have a compliment of 360 so 360 the price over here 250 pricing equals 250 longitude but what about the left over what about the 360 minus the 250 we have a hundred and ten left over in the circle well from the high price here if you move
the Sun 110 degrees you get the exact low so oftentimes the complement of your price equals time equation will give you the next low or major high also the actual longitude of 110 which was the complement here we had moved it went in to get this low but the actual date when the longitude is 110 is in early July remember 90 degrees is june straight up on June 20th so July 12th is the hundred and twelfth degree and in this case it had it had been the complement of this top here gave you this top
right here this low by the way here was a price of 1307 which translates into 227 and the complement of that is 133 so the longitude on e5 is 133 and that was where this little break bottom then to start the base and go up again these calculations are easily done with my little program I give you all in the first volume of the planetary things you just put in a planet or a pair of planets it gives you the listing for the longitudes and how many degrees they have moved so you can either move
the Sun a certain distance or you can look up the date when a longitude is hit and then that way it's very easy going forwards and backwards on these little things to find out where there's going to be an equality of time and price and of course you can find out much more at my website stock cycles forecast besides the other 11 books and courses I the three major planetary books including the ones with all the programs they're about $400 each if you buy them all one big package they're $1,000 but you can find all
that information on the website so let's look a little more and did this translations of price into longitudes and the Equality of price in time in most cases although you often won't see it on the high or low day it would be a direct plant translation into a planet for instance on Tesla here the high day although it had a high a 291 the low and that day was 281 and Pluto was sitting at exactly - 81 degrees so there was a direct degree two-point translation of the planet Pluto on the high day also on
the high day Venus was sitting at 161 longitude and if we took the high that day you can use the low - but I'm just example the high price of 291 and looked up the future date when Venus got to 291 it would come out right here or if we took Venus is longitude on the high day and moved it the number of degrees it was in that tie day it has moved 161 degrees you're now on the low day so you will often find many planets all coming together on the highs or low as
I'm only showing two here so as not to confuse you but every one of these highs and lows our history will be a different planet squaring out the numbers of the key high and low prices the implication of this is also that support and resistance in time will be support and resistance in price so here's a big low down here where the price was 285 and the Sun was 296 are very similar maybe it wanted to go to 296 but there was a sell program there's always a little slippage around so you got to give
it a loop but we could take either of these and say okay the theoretical price was 296 so the theoretical longitude was 285 and we can add our are 360 multiples to get our price levels so based on the longitude on the day of the low we add 360 and 360 and 360 we get these resistance areas with the red line if we go ahead and use the actual price of 285 and we add to 360 multiples we get these various other ones but we can see that from this one point in time it is
naturally generating ahead of time where the resistance and support levels are going to be so this helps us a good bit on long-term forecasting or long-term portfolio liquidation when we get to these various big support resistances so now up to now we've used the longitude of individual planets as the time but what about pairs what about the angle the separation of the degrees between two planets that works too here's Mars and Jupiter on the high de Mars and Jupiter were 71 point 37 degrees apart from each other if we take the high and we move
Mars and Jupiter until that angle increases by 71 37 we get this point right here which is another big blast off in the chart again we can do an easy calculation of how that takes place we put in the top thing we put in our Mars and Jupiter this is a Geo one marked as a pair so here's the Mars going forward here's the Jupiter and here's the angle between them going forward and this from our origin date this is the running total and we find out that it comes to 71 41 degrees on this
date which coincidently would be a double of the 71 40 because we were starting on a date where the orange angle was 70 140 so now it's going to be twice that longitude on that date so it's very quick to to scroll ahead or back and find out where these angles are here again we see various angles and angle returns here is Chicago Mercantile Exchange CME and the angle between Saturn and Neptune which is very important for that particular exchange so over here we had a top made when the angle was 103 point 6 and
do the retrogrades and direct these planets especially with two planets one could go retrograde the other would go direct and another one goes retrograde this guy comes out of retrograde there's various combinations where you can go back and forth through the same angle several times over the course of a year so when it came back to 103 60 you have another top right here in a plunge over here where we had a dramatic upsurge it occurred when the price was 84 90 well if we treat 80 for 90 as if it was an angle and
not a price and we look ahead to see if the Saturn and Neptune is going to reach an angle of 84 90 we find it does right here and it's a low and then we find it hits it here again and it's another low and we find it hits it here for the last time and it's a very explosive low so here we have three translations of the 84 90 price as a low and each time the angle hits it it generates another big low I might add that in the middle here looks like the
beginning of a big fall back when either side in the middle there was a direct translation the price was 101 and the angle between Saturn Neptune was 101 so there was the perfect equality right here and this was like the peak up and then down and kind of a fall back on either side to these various angles so you always want to watch for the perfect equality of price equals two as being a major pivot in the chart pattern here to the angles can give support and resistance again at the bottom down here we can
take the individual longitude of Saturn like 242 and we can add the price to it the price added to science side of longitude is 527 that gives us this resistance area here we can take Helio Mars on the low day that was 27 57 plus 360 of the circle gives you resistance at 387 right here here's the Mars Jupiter the angle between them was 137 we add the low price to it we get 422 it shows up as this major level of 422 and the Saturn one note there's a huge gap right to that price
when we got to the 527 the longitude on that day plus the price gives us support and resistance targets at the top over here the Saturn Pluto angle was 37 54 we add our low price then we add another 360 because we've gone above that so we get to 680 to 54 so we will see the market is very specific and it remembers the numerology of these highs and lows where the number is the price and the longitude are equal and that's why we can add 360 multiples we can add the price to the longitude
to the angle and we will get support and resistance when we get to those various levels here's a pretty good example of how they're interchangeable time and price and also I can use the square of 9 so much not down here the Sun was a longitude of 38 79 you can see it's an early May about a month after the first day of spring which is zero of the year and we can clearly see the low was in the 50s I show it to be 56 50 so when you're square of nine you would usually
take a price and do the square root plus two and that would give you the next rung and you'd usually have one price and the target would be the next price well here we're using a law as if it was a price low and we do the square root in the next rung where do we get we get the next price high right here the 67 70 68 is is the top price right over here so it is converting as equivalence both a longitude as a price or a longitude becomes a future price also note
the final price was two times the origin longitude so time and price are indeed equal and can be swapped this would only occur if human beings are translating the movement of the planets into numbers and those numbers turn out to be the prices that are trading every day the subconscious translation goes on each and every day in the minds of the traders and as the planets move and they reverse and they hit these highs and lows those are the key translations that turn out to be your major pivots another way and converted longitudes was mentioned
in this course and this discussion of trade in US Steel I had in my complete stock market trading a forecasting course I explained this mysterious veiled dialogue this way because it confused me in my younger years when I got the game course I read this over and over again it didn't make any sense at all to me so I'm gonna explain it to you he says figuring of $100 or par as the basis for stock prices and changing these prices to degrees 12 and a half equals 45 25 equals ninety thirty seven fifty equals 135
fifty equals 180 etc so he's basically saying 100 dollars is the equivalent of three hundred and sixty degrees and 1/8 of $100 well 1/8 of 360 degrees is 45 1/4 25 is a quarter of a hundred but 1/4 of 360 is 90 and likewise 50 is half of a hundred it's half of the 360 is 180 then it says when a stock sells at 50 on the 180th a tweeker month it is on the degree of its time angle well he's telling you time and price are equal when it's on that angle on the hundred
and eightieth day and the stock is selling at 50 it equals 180 in time and price r-squared and you ought to look for a trend so he goes on to say February 1st 1915 u.s. still made a low at 38 which is the closest to a price of 37 50 which is 3 ace of 100 or 3 ace of 360 would be 135 and he's saying he throws this in you I just say well where is he getting this 135 angle from we're talking about three years of a hundred dollars and 38 bucks and then
I was talking about some angle and he says steel was 14 years old or 168 months old on February 25th that year and then hit the angle of 135 so this is a key he's talking about months here and whenever he talks about months he's talking about the planet Saturn so we got to find out the Saturn has something to do with this 135 angle he says this showed that still was behind time it should have been 168 divided by 360 which would have been something like 46 dollars but it was only at 38 so
it was behind time based on Saturn but it was in a strong position because the angle apparently was 37 50 and it was above it so let's see what he's talking about so he does go on to say about the the percentage if you're using numbers use a hundred and the fractional parts of a hundred are the same as a fractional part three-sixty for your longitudes and he also mentioned the February first a date because that was a date when the rulership of US Steel Mars was changing sign if you look it up in an
ephemeris you'll see Mars was changing sign and unfit very first and he would expect when the ruler changes sign of the zodiac the steel stock would change direction and he also in the text the 135 angle he was mentioned it was 168 months old well no that's the fixed cross is the the odd squares 169 is on the lower left-hand corner fixed cross of the square and 9 and when Saturn comes around and hits that fixed cross you expect a major chin trend well that date he referred to Saturn and Uranus made a 135 degree
angle so now we're seeing that he's using aspects between the various rulers as numbers where he's going to buy or sell stocks so here's the calculation for late January 2015 if we throw in Saturn and Uranus as a pair we find out on January 25th approaching the 1st of February where Mars was going to change sign anyway here's the angle of 135 and he's translating that angle of 135 into 3750 so he's using this as if it's a trend line of the longitude of the planets and when as long as it's above that trend line
which would have been 3750 price the stock would be in a bullish position here's a letter of Ganz on the may set of the moon go coffee and he's showing you just don't always use a one point two one point of conversion here we have a simple one point to one degree and he's using coffee prices here and pennies and stuff 87 29 so it's it's like it would be eight 729 divided by three-sixty is equal to now 24 cycles of 360 but we're not worried about each of the 360 360 360 so we're going
to subtract those 24 cycles and just keep the left over so the left over 360 is equivalent of times 360 89 degrees left over an 89 is equal to 29 Gemini so you got 30 of Ares xxx tarus of 60 and 29 over so 29 Gemini is equal to one point to one degree in the price of coffee but sometimes it would respond to different units so he's trying well what if we do 30 points per degree so then we can go down here and we can say okay 87 2987 29 divided by a nice
and let's use 30 points per degree 30 points would be equal to 291 291 is Capricorn it starts the the tenth house so now nine houses times 30 degrees is 270 and this is 21 later so it's 21 Capricorn so at 30 points is one of his scales then he has a scale of 12 points so then we can see how is he getting this 12 points 87 29 82 7 29 divided by the 12 points per unit gives us 727 but it's above 360 so we want to subtract 360 and it's still above 360
so we subtract another 360 and we get 7 41 or 730 areas it would be 750 basically it's not quite 730 Ares but that's what he's doing here he's taking at one cent a degree all he's doing is basically moving the decimal point when a degree is taking this and moving the decimal point and he gets 87 29 so 87 would be 30 and 60 aries taurus 27 of gemini 29 or 30 minutes more would be 16 gemini and then he uses a dollar example remember before he said if you use dollars use 100 or
par instead of 360 so now on the hundred equals 360 he's taking the 28,000 161 value of the contract of coffee he's dividing it out and he's getting to 81 which is 270 is the end of Sagittarius so Capricorn is 11 and 70 1.75 would be 3/4 here 11:45 Capricorn so he's using these various points of 30 and 12 and 1 and dollar amounts and once he finds the translation and he'll find the planet which is located at seven-thirty Gemini are 29 Gemini or 21 Capricorn or 2716 Gemini he's doing this to look up what
planet is there what angle is that degree between two planets and once he finds it he will find the key to trading coffee because now I has to do is move those planets forward take the degrees they are and translate it backwards by these units to get the price coffee will be in the future because time and price are connected and they're always equal now a lot of questions I get always relate to currency conversions because far too many of you get suckered into trading currencies a lot I suspect you don't have enough money to
trade stocks and they hook you by saying for $1,000 down you can trade a hundred thousand worth of currencies but you know it's just a license to steal by the brokers it's very hard trading currencies with all the news items in the up downs and forcing you to liquidate every day but if you are gonna play that game the currencies are like the you can trade the number of things you can move the decimal points as if it was a dollar contract or you can do it in fractional parts of 360 you have to experiment
a little different currencies have different conversions so here would be a first attempt at the euro dollar from the high over here one point two five five four two times 360 would be about 452 degrees now I could reduce that to 360 but I'm just gonna use the moon moving 452 so from that high the moon move 452 he moved it again here he moved it again there moved it there and many of these are pretty good hits and it's just simple moon moving by this fundamental frequency of the high price but we can see
this is a big liquidating trend that continues to this day when you're in a big liquidating trend you're not gonna find big major reversals on a small chart like this usually the thing that's driving them is some major planet from back several years ago so you really want to look at a longer-term chart to find this out so here we see the same chart on a weekly basis so we can go back several years no 1 2 3 4 5 years or more and we have the high spike here that is 1.39 and we do
that same type of conversion to get 500 390 and I'm just trying it with the Sun and Mars so I move the the Sun 504 degrees on the weekly chart and it nails too high and you get a big crash down then I move Mars from that spike and we get the exact little week and then the second cycle of the Sun comes up to the secondary bottom and then the next cycle of the Sun isn't that big but it's still three weeks sharply down compared to what's been going on same thing for Mars here
reverses straight down again so usually you'll be able to find out what the ruler ships are in this case looks like Mars is very active I'd want to do with that they'd want to do some pears with Mars Mars and Uranus or Mars and Saturn and try the various pairs to see if they hit these points better and go back over 10 20 years if you can with several major highs and lows convert the prices and see if you can't get a common denominator number that will move your planets and hit almost all the targets
you need to hit and thereby find out what's what what to use when trading that stock or commodity now they get time and price squared or equal I was saying you needed an accurate trend line or a planetary trend line well you can also use my Jay TTL which I revealed in the secret science book and it's in a trendline based on the square of nine so that's what this was on this chart a Tesla I kept showing it in my newsletter month after month after month and just upgrading each of these intersections so from
the low you want to square out the vertical high but the first one you can square out is this low distance this too is a time and price of quality from the low this distance here can be squared out when it hits your trendline and that gives you the high over here and then the second 31 over here squares out right over here and the big top over here squares out right here with the big top right there so every little turn here is a different range along this trendline which is over so much and
up so much from the origin point and time and price will be equal at each and every one of these things guaranteeing a reversal and trends now when I did this last one it's at the next big turn and it was fairly significant there was one over here and it was going to hit over here and it was going to hit over here and that would be on December 10th well if you look up this chart you'll see it went up like a rocket ship right back to the high-ticket in history on December 10th and
then it crashed and went right off the page so when you square the various ranges on a good trendline you will always get reversal in the market that's time and price are squared so here's one last example I call it a perfect example it's from the again after volume 1 I was talking in that how bonds worked very well with 1 degree around us almost all the highs and lows are just simple wouldn't agree uranus moves but from the major top over in here the price was 88 90 i mean that nut bonds but the
US dollar 88 90 was the price and i put on a 4 by1 game and go of uranus and we can see it's hitting it and respects it and what you will usually note when you have a good planetary trendline it will start to bounce around it and so it means you're coming up to a time and price squared but it hasn't actually square it out yet it's focusing into a point and right on the load a we find out the angle between uranus and pluto from the high starting here and moving that angle forward
the angle is now 88 70 which is equivalent to the 88 90 between the high low range and close and that day so the angle between uranus and pluto is equal to the top price on the low priced day but also saturn had moved 16 46 which is the exact same as the price drop from 88 90 you take off the 16 46 you come right back down to the 70 something price that was on the low so the difference was the Saturn movement and we had Saturn was 135 Neptune on this date so we're
having all these various planets and distances moved and vertical drops and angles between the planets they are all equal at the major highs and lows in history and that's when you get these big things that go up for another 3 4 or 5 years or so before they square out again most of the little things been looking at will square out this high or square up this low and they're great trades but when everything comes together and you get three four or five of the big planets and they've all moved the exact same proportion and
the movement they're following a trend line and even this trend line comes down and it's going to square this low to right over and here someplace then you get your major changes in trend so to summarize here we find that longitude numbers are converted into prices people subconsciously feel the planets moving and they convert that distance into prices prices are also reduced to numbers within three six that we do it backwards if we find the price of a thousand subtract 360 360 and we get a leftover we can use various scales like one degree per
degree or 12 points per degree thirty per degree or maybe some oddball number if something was seventeen dollars for a low maybe one a try seventeen per degree these longitudes can be from individual planets where they can be angles of pairs of planets they can also come from various coordinate systems that can be geocentric degrees heliocentric degrees right ascension or acid aerial so you do have to play around a little bit but once you find out which is working it will work forever on that commodity so even though you may have to spend 3-4 hours
one afternoon trying these various systems once you have it you'll have at your whole life square outs are at the dates on either fixed longitude numbers that are equal to the price or movement distances of those longitude numbers so if you were to foul if you were at a price of 87 you might move 87 degrees or you might go to the day of the year when the longitude is like 87 which would be but like the first day of summer almost which is 90 degrees on June 20th planetary trend lines are an easy way
to visualize the square rocks you start at a low you draw a planetary trend line going up and when that trend line intersects the high you've squared the range so those are very simple that's where again his chart you'll see he's got these long-term planetary lines ago three four five six years and all he has to do is look at the price scale on the right side and see where the trend line is and he knows that's the number of degrees the planet has moved up from zero so we can very quickly see that number
of degrees and see if it's related to any prices so longitudes also create natural barriers of support and resistance if a line a high was on 290 we can add every two hundred ninety degrees up and and that will be supporting resistance but the big thing is longitudes will equal price and when they do this is where the reversals occur so this is Ganz time and price are equal or they are square and when they are square it is the fundamental thing you will get a reversal in the market every time if you do it
right so if you want to find more information on this you get my eleven books and courses you can read about my personal seminars both your New York City or on skype around the world the previous YouTube videos or on my website so I thank you for listening and I hope you enjoyed it