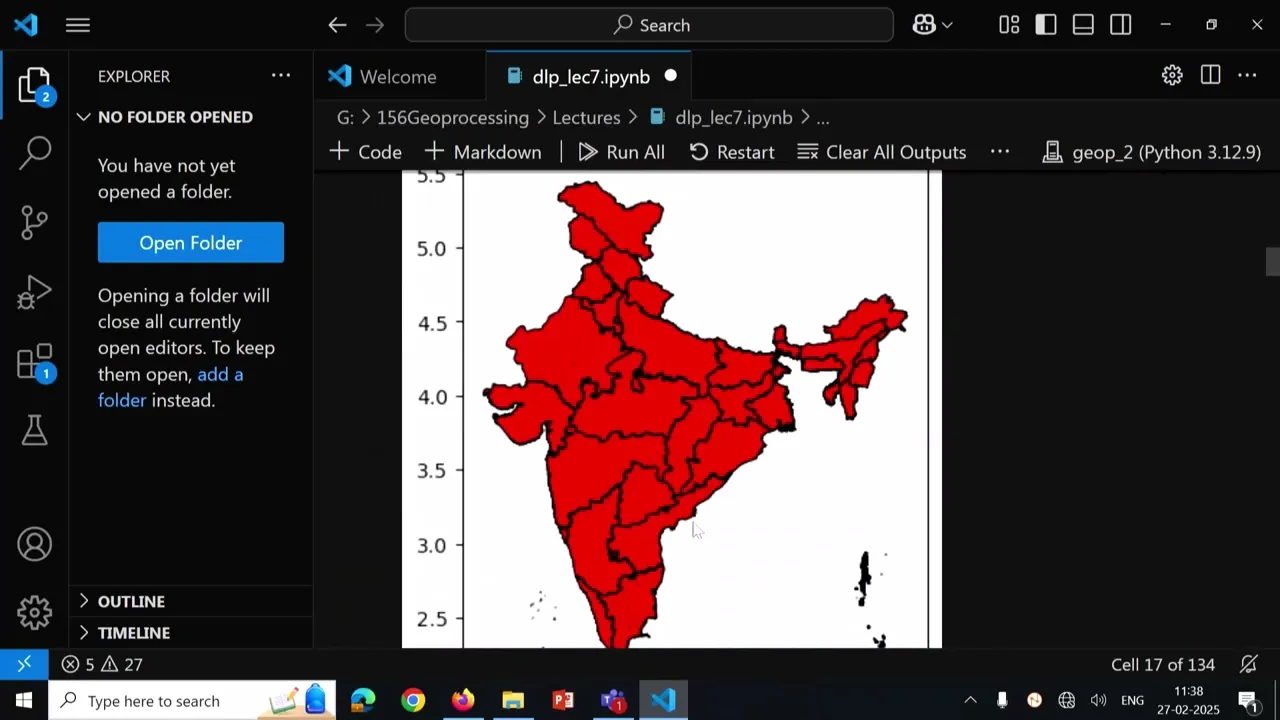
A very good afternoon to you all and welcome to the session on Vector data processing so actually in the previous lecture we discussed in detail about Vector data as we said that Vector data is more useful for representing the data where there is a discrete where data is of kind of a discrete kind right like where there are clear distinct boundaries between the between the data right like we are seeing the boundary of State the boundary of the state will be clear from one state to another state where we can clearly delaminate the data right
so in these in these cases Vector data representation was quite useful so we briefly first discussed about a library called geopandas as we said that geopandas was based on pandas so then we basically discussed about two primary data structures in Geo pandas one was we are calling Geo Series so that was the that was containing the all geometries Of our uh shave file or whatever data was GE series represents the geometries of our observation and the other non attributes other non special attributes were represented using other columns the entire data data frame we were calling
as Geo data frame so how of a as we discussed that a GE data frame can contain more than one GE series but out of these only one GE series will be designated as the geometry of our uh data uh Geo data frame then we Discuss uh how to read different formats starting from esri save file to Geo database geojson and other format to discuss about so today we will briefly see how can we create some use useful maps from that data and then we will go on doing some basic uh Vector data some basic
uh special analysis on that Vector data and finally we will see how do we write the output of the data to maybe two different formats right so as we this is An as you can see this is a map of some Metro right so now as done in the previous case now we need to import all required libraries so pandas geopandas numai and met BL Li so met anyway we need not explicit import M plot Li because uh goopa provides very high level interface for accessing uh M plotly functionalities right so first I am changing
the my working directory to the directory where all the data is available right now let Us discuss with our making maps and plots with you panda so today's first topic is how do we create beautiful Maps using and plots using J right so first now suppose I am reading the same file called containing the boundaries State boundaries of different boundaries of different states of India right so I I have created a variable called Vector underscore file in that I'm just storing the name of the File which I wish to read right as we said that
geopandas provides a high level interface to the m plot Li Library it was so what does it mean that we need not call the low functions of mat plot so we need not handle that thing so all the lowlevel functionality will automatically be handled by go pandas so geopandas provides us a top level interface directly we can call the plot function on the geo geo data frame object itself so we need not call it on Say PLT or somewhere so directly on the geod data frame object itself we can call the M plotly functions so
mapping shapes is an easy is as easy as using something like that ly calling the plot function so in the previous case in the uh when we were using directly Matt plot we are just calling the functions on Mt plot. pip plot pip plot. plot right so now similar to geop Panda's Geo data frame itself provides a function called plot so mapping shapes is as as easy as Using plot method on a Geo series or Geo data frame right so if you call if you call this uh plot function on GE series directly then the
all geometries of our GE series will be uh plotted on the screen or if even if you call that function on the entire Geo data frame so GE data frame also selects the geometry column of our data frame and it will render the geometries of all geometri under the GE series of the uh ge or Geo data frame right now suppose If you to read the file so reading the file as same as as we have done in the previous cases so GPD do read read underscore file and we pass it the name of the
file which we wish to read right now I'll call India equal to gp. read file and pass it the name of file now if I wish to see that file now we can call just like india. head so that just if you cursorily want to review the what the file contains then suppose then as we said That so now this file contains like the name of the states Legions of the states shape length area and there is a column containing the geometry so this represents the geometry so every Row in our geometry column represents one
observation right so it can be a single type maybe a multi polygon or polygon or anything so some shape files might not allowed to store different kinds of geometries like they can have a single kind of geometry on all column but some Formats allow multiple kind of geometries to be stored in different rows right now suppose if I PL I call now I call if I call just directly call India Dot Plot In my GE data frame if I call the function plot so it renders all geometries all geometries present inside that inside the GE
series of this our Geo data frame right now suppose if you wish to customize this this map like suppose if you to change the look and Feel of this map depending on our requirement like how do we if you wish to change the colors or or we want to change the color maybe color of the face or say color of the edges and all then we can specify these as an argument to our GE data frame plot function right so now suppose if I wish to instead of blue color suppose if I wish to use
green color for rendering then I can call the function our geod datf frame do plot and if I specify the color is equal to Green Say color is equal to Green then the all these blue color changes to the green color right so this way we can customize our look and feel of our map now suppose if you wish to change just the uh colors of the edges right suppose if I all edges if I want to say in the red color then we can specify PLT do plot and specify Edge color is equal to
red right now you can see that the colors of edges has changed to Red then similarly You can change other arguments so suppose if you wish to change the edge color to Black and face color say to Red pH color sorry H Color to Black and pH color to Red then you can specify these two arguments to the as an input to our india. plot function india. plot and HED color is equal to Black and pH coloral to Red if you do then you can see that the look of map has changed right now the
all faces have been shown in the red color and all Edges are shown in red color similar way you can use any color combination possible depending on your requirement right now suppose if you wish that you don't want to be put any color on these faces like inside the edes you don't want to uh uh do you want to fill with the any color right you just just want to fill the edges only with a color then you can specify it like India do plot Edge color is equal to Black and face color is equal
to if You sp pass none then what happens then you will not see that any color colors on the faces only edges will be now similar suppose if you to change the color of edge color from black to say green then you can specify like this and change the look and feel of your color depending on your requirement right so then even then you can call by default what happens the geometry column when you call the plot function on the geod data frame so it uh implicitly calls the Uh finds the geometry column of our
data frame and plots all the geometries available in that GE series or Series right so otherwise explicitly also we can call like data frame dot then we can specify the name of the column which contains so now if I see the boundary this is the name is geometry actually like if I call this may not work India boundary dot Suppose if I as we saw in the previous lecture that suppose if you wish to change the name of the column from geometry to something then you can call it like India boundary do plot La where
we have where the boundary column contains the geometry now in the our case geometry column itself contains the geometry so I can call it like this as well right so so otherwise suppose if there are more than two GE series inside your data frame Then you can suppose if you want to plot some other even say other geometry column from your data set then you can specify it like this as well you geod data frame dot name of the column W which contains some kind of geometri Dot Plot if you call that that particular column
also will will be rendered like all the geometries in that column also gets rendered so this was how do we create a basic map now suppose if you wish to Create a coroplast map uh from the data right so geopandas also makes it very easy to create corop Plath map so what is corop Plath map where the color of each shape is based on the value associated with some variable right so till now whatever we have seen that the plots all the all the uh shapes were B were colored in the same color so we
are giving the same color to all of the uh all these shapes right now suppose if you wish to color The shapes based on some value associated with that shape right suppose like if you want to create a population map and that suppose if you to give the color of each state based on the how much population is there in that state or maybe what is the average temperature throughout the year on that state so we can do like so when when we wish to color all these shapes based on certain attribute attached to that
shape so that that that that kind of map is called Corl map right so now let us see how do we create corl Maps so the basic idea is like we can just call like suppose if you see this our Geo uh Geo data frame so it contains a column named shape uh length and shape area right suppose if you want to make a coroplast map based on the area of that particular shape like suppose if you want we want to give like blue color to the areas to the shape whose area is say 10,000
and green color to the area whose shape is 30,000 and so on so depending on that suppose if you if you wish to so then we can specify it like this we can call it like our geod data frame do plot and inside that we can specify the column on which based on the values of which attribute the color of the shapes to be determined right so then you can say that India do plot column is equal to based on which column we want to color the Shapes so like like so similar to you can
specify on the other other so like suppose if I say india. head so like these are the other columns suppose shape length or state Legend suppose if you if I was to color them B based on the state Legend right so I'm not sure State Legend is a number or not I need to query it like I do it here then you can see that these all different states have been based on the legion so depend then you can choose a Particular value based on which you want to color your color attributes in your shape
file that you can use right now this with this just if you see on this we don't know what value this each individual color represents right now suppose if you wish to know that we want like we want to attach a legend also with this map right without the legend it is very difficult to read the map now we want to know that okay what value is being represented by this Particular color what value is being represented by that color so suppose if you wish to see that on attach that also to the map because
the map will be useful only when Legends are attached to the map so now let's see how do we create attach a legend to the map so when plotting a map we can enable a legion by using the legion argument right so we call geod data frame do plot and say column is equal to shape area then if you pass Legend is equal to true So what happens in that case the legion gets attached attached to the map right now you can say that a legend got attached to this so this may be representing some
value right 3.0 into 10^ 11 or somewhere so now Legend also got attached to that map and all all the shapes are colored based on the value of their area shape area right so similar way suppose if you are not happy with the orientation of the Legion right so then we can change the Or suppose if you wish to change the orientation of the Legion then we can specify Legion is equal to true and another dictionary we can pass to our plot function called Legion keywords so that will contain multiple uh key value pairs there
you can specify multiple Keys like you can say the label like here also like if you just see this in this we don't know right now it now we just know that this color represents this value but we don't know what is This value whether it is the population of that state or say area of the that state so it is not clear yet so now suppose if you wish to attach label also to the legion and if you to change the orientation then you can call it like this Legion keywords then you to the
legion keywords you can specify these arguments label like what is the label it attached to that Legion and orientation also we can specify right so here now Legend Al is a Total area and this now suppose same if I wish to create a vertical map vertical sorry not vertical map legend vertical then I can specify it like this orientation equal to vertical then and the total area is attached to this and this is the location so this way we can attach a legend to our map and change different attributes of that Legend also like orientation
of that label and there may be many more attributes you can go through the Documentation and explore now suppose if you you are not happy with the color Shone here right now suppose if you is to change the colors of this so then you can specify another argument called color map as well to the plot function right so I call india. plot and column I can specify and color map so with whatever uh M plot lip color color maps are available in the mat mat so those colors we can color Maps we can use as
an as an Argument to our plot function like cmap equal to xn if you pass on so the xn uh color map will be used for showing the colors of these saves right so this way we can specify any different different uh color map also we can attach to our uh geopandas FL right so the way color maps are scaled can also be manipulated right now we have just uh used a color map right now suppose if you used to see that how you Us to change color maps are how to scale the color Maps
right can be so we can specify the we get the the way color maps are scaled also can be manipulated using the scheme option like like suppose if you wish to modify the scales how the uh how how to scale these colors like based on the these values assign some particular color or like how you how to break this entire series into maybe say equal intervals or natural break right so the way color maps are Scaled also can be manipulated with the scheme option like if you pass another argument to our plot function called scheme
so with that we can specify how the map how the color maps are scaled right so that we can choose the colors of our our choice the scheme option can be set to any scheme provided by a by the map classify function there is a function called map classify so that also accepts multiple uh argument So based on the arguments Passed to that the uh color maps are scaled accordingly so the arguments which we can specify to the scheme function are called box plot you can specify the numbers to be broken into equal interval range
or say fer JS fer Jank sample head D bra brakes JS caps all on so these are different uh schemes with which we can scale the color Maps right so the classification scheme is a method like you can say that this the word what does the scheme the scheme is A method for binning continuous data values into say four or seven classes or by default these are five classes and map those to color palette right so by using these these these schemes actually these different schemes bin our continuous data value into say four or five
bins depend depending on certain like equal interval will bre break them into values of equal intervals like suppose if you have 10 have 10 discrete values and suppose if If I use equal interval so then it might range it might break into first into the range 0 to 2 2 to 4 4 to 6 like this it can range change or then there can be there are other schemes for scaling these values right classification scheme is the method for binning continuous values to into say four or seven classes so depending on our uh requirement or
how how how how is our data So based on that we can choose these different schemes for scaling the color Maps right And map these values to different different color pallets so the basically the commonly used classification scheme classification scheme for breaking the data uh into continuous data into classes is one one we call equal interval so in equal interval equal size data ranges we break that into equal size data ranges like say say 0 to 10 one one color will represent 10 to 20 another color 20 to 30 other color 30 to 40 Maybe
other color right so the prows are these are best for data spread across entire range of values if your data whatever you are plotting is spread over across across the entire range of values then equal interval is a good choice then it is easily understood by the map readers also the what then what is the problem with this avoid if you have highly skewed data or very big outliers if in your data you have very highly skewed data or you can Say that there are very big few big outline some some some outline outliners are
there in your series they are they they are very high right so the value of them is very high then equal interval may give you may not be the correct representation correct way to represent or break the color scales right so another scheme is called quantiles so equal numbers of observation each each bin so right in this in this we are breaking the range so say 0 to 10 10 to 20 20 to 30 or 30 to 40 like this we were breaking so what what might happen so there may be no value in the
range say 0 to 10 or there there there may not be any value in the range 10 to 20 but if you use the quantile scheme for breaking our series then equal number of observation will be there in the each bin like you can say 25th percentile 250th percentile 75th percentile or 80th percentile in that case what will haveen we will have equal number of observation In each bin so it advantages are it looks nice because it is best Spread spread colors across full set of data values right so it best spreads go spreads the
colors across the full set of data values thus it is often the default skill for mapping mapping software so generally so quantiles uh scheme only they use by default all software they use quanti scal only because all bins contain equal number of samples Vin range is based on the number Of observation not on the data values right so the range of bins are based on the number of observations total observations are there on in our data not based on the data values like based on the range of data values so those different classes can have
similar or very different values another way is called natural break it it minimizes within class variance variance and maximizes between between Class variance right so within Class variance it tries to minimize on if you took take the natural brakes as a schema for color map scaling so what it does it minimizes the within class variance like within the class the observations are there that will be close to uh each other and between class differences like from one class to another class the variance will be Max maximum right so typical methods is for natural break are
Fisher JS so the pros advantage of this is great for Exploratory data analysis because it can identify natural grouping so it can help us identify okay natural groupings then what are the dis disadvantages this class brakes are best fit to one data set so that same means cannot be always for multiple layers like suppose if you are trying to plot uh multi layer multi-layer data so class brakes are best fit to one data set right so the same bins cannot be used for multi-layers like when you are using Multi-layer plotting using view pandas and color
scheme if you use natural BL it might not be quite useful in that that case right so let us see how do we plot that so you can say India or data frame do plot we can specify the column say column is equal to savee area uh like because we used to color them based on the area of that s shape area of the shape of that area what is the total area of that shape and color map Suppose if you to the exent color map legend isal to true and scheme so scheme for color
map scaling right natural bra then figure size equal to 10 by 10 if I do it can say that so with this you can specify the colors now similar way you can specify other other color scheme say equal underscore interval so then we can specify color scheme as equal interval as well or or say Quantiles so I'm not sure if quantiles directly is available if it not we'll go ahead so quanti so in the case of quantile you can see that this way the colors so all now all observation contain equal number of samples right
now suppose if I I want to attach some uh fictional population to each of uh these uh data each of these states right so then we can specify it like so and we we Are assuming that the population in certain state is uh directly proportional to the area uh area of that like the bigger the area the greater the population of that state so right so I'm just scaling that by the area with NP NP do random. uniform say in the range 1 -0 to 1.02 so so we are just calculating a random number and
we are that is we areum that is proportional to the area of that sa so a fix population got Attached to that data frame if you see now India so we have attached a random population to the random new column called population that contains the random randomly scaled values right so this is there is another column called population that contains the some fixes population of that state right now suppose if we want to create a corl map based on the population of Those State we have we will assume that already we had population available from
the state so if to calculate that so we can call this function now our data frame do plot color based on the column population and which color map to use see exent color map and Legion true and scheme say natural break suppose if we wish to use then we can p like this right now this is the corl map based on the population of that particular State like These two states might might have equal anyway not because their area may be same so because of that their population have been because we have just assigned a
random population to these states right now suppose if you want like sometimes what happens you have some observ you have some observation available uh available with you and for certain observation there is no data collected on the ground maybe because of Various reasons right now suppose in your plot if you want to show these missing values supp your data set has a missing values now how do we represent those missing values in a corop Plath map now let us see that now in this case now what I what I am doing India dolog india. State
Assam in the population so the population for the Assam state I'm assuming that it is missing right so I'm assuming I'm Assigning np. n to the all the rows where state is equal to equal to Assam right india. log where India state is equal to equal to Assam comma population column we are taking and assigning in that value np. n so np. n right so Asam we are assuming here that the we don't have observations of like for the Assam we don't have population values available as of now we if you see that right now
let us see how do we how do we differentiate these missing Values in the plot from other normal values in some cases one we want to like in some cases one may want to plot the data which contains missing values for some features right or the there may be multiple reasons because which because of which the data is missing like for some features one simply doesn't know the value like one simple example May for certain features we exactly don't know the values however passing key missing keywords we can specify the Style and label of features
containing none or n right so with this if we pass on another argument called missing keywords we can specify the style and label to be used for the features which has these value values Associated right so now we we are uh calling india. plot and other things are same I like column you want to use population color from creating the corl map and color map we are using accent then Legend support if you wanted to Legion true and scheme Natural brakes figure size and you specified and you need to specify another dictionary called missing key
kwds so missing key keywords equal to we need to pass it as a dictionary containing the value like what color we wish to use for coloring those missing values and like Edge color face color and there may many more arguments right color Edge color then hatch like what hatch to use On those shapes then label what label you want to attach to this right now suppose if I see this so as you said that for Assam we have given that there are missing values in the Assam right so here we have specified that with the
H color red you just draw this the shape of Assam using red color and use H SL double triple SL foring the hatch similar we can specify other hatches maybe let's try star how does it look Like or it work or it might not work like this you can say that star Stars we have done then you can specify any other color or hatches for this blue if I I say then like this right so clearly we can make the missing data distinct from another data like this seeing on the map you can specify that
and the legend also has like this these are the missing values in your map right so quite very easy only missing _ kwds argument we Need to pass now let us see how do we create these multi-layer maps to till now we had seen that only single layered Maps like we were we were just plotting the single layered map now suppose if you by combining Maps so but before combining the layers different layers we need to ensure that they share a common coordinate reference system otherwise if they like one is in geographic coordinate system and
another is say any other projected coordinate System like LCC or any other projection or UTM then when you if you try to map or plot the map then plot plot them together so they will misalign right so before combining Max first first thing first thing we need to ensure that they share the common CRS right now let us see how do we ensure that before going going ahead now uh now here what what we have we have two layers one containing the boundaries of all states of India and Another is containing the headquarters of each
state right so now we have headquarter that is being represented as point layer and state boundaries are represented as polygons or multi polyon right then we have a file called State headquarters that contains the location of a state headquarter like maybe the capital of each state where the capital of each state is located state _ hq. CHP that is a point point feature that contains Point features right so first I Have read both of these files India equal to GPD read underscore file our Vector files containing State boundaries and state headquarters State headquarters gp. read
file state headquarters right now before uh plotting these first as I said that we need to ensure that they are in the same coordinate reference system so if I call india. CRS it says it is projected coordinate system LCC wgs84 that is based on another geographic coordinate System and these are the parameters of that coordinate system now I if I call the check the state headquarters. CRS so this is also in the this is also in the same Pro coordinate system like you can say projected coordinate system LCC wgs84 and this is also based on
the geographic coordinate system wgs84 and other parameters right so now because these two uh vectors are in the same coordinate system then we can go ahead With plotting so now next how how do we plot it actually for creating a multi-layered map we we need to depend on the either by first we explicitly create the plots uh figure and AIS right so then this we keep on passing the figure on AIS sorry access to on which to plot the data right so first we have called like in if you see if you remember in the
first lecture we talked about this PLT do subplots so PLT do subplots creates a figure with a single Axis right now why while calling so in the previous case while when we are calling the plot function directly on our data frame we are just calling our data frame do plot and we are not passing them any argument now suppose if you pass it our argu our data frame. plot an argument called access like on which exis or subplot draw this render this particular data right so that we can specify it like this india. plot ax
equal to Whatever X is we have created and then we can specify the argument like P to the plot whatever we have color and H Color so color is white and H color is black and similar now suppose if you want to plot another layer on that so State headquarters our state headquarters layer do plot and through this also we can pass the axis is equal to ax so whatever ax we have created that axis only is going to be as an input access to this plot as well so What will happen these two layers
will St plotted on the top of one each other top of one another right then you can specify marker color and marker size as well and other things right so this way we can create a multi-layered map like here you can say that on the base base we have the boundaries of all states and on the top of that we have the state headquarters represented as point layer right so all these are represented so this way we can Create any multi-layer plot using uh go pandas so now let us see how do we create interactive
plots as we have seen in the first lecture as well now we will continue that alongside static plots you pandas can create interactive maps based on the folium library as well so these are some static plots now suppose if you want to create an interactive map interactive plot where you can Just uh pan Zoom or even you can go to this area explore it like what it looks on the backside some satellite image and all also you can plot right so for that now let us see how do we create interactive plots using goop Panda
so anyway first I have Vector file containing the district boundaries of allate all districts of India and from this we have discussed in detail about filtering or subsetting uh file while reading right so GPD doore file I'm Passing it Vector file and where we are passing it an SQL clause C to is like where state is equal to Gujarat suppose if you want to just patch the boundaries of all districts which are falling under state of Gujarat right so you can call like this and if I see gdf doad can say that only this districts
districts of Gujarat State have been extracted right now if you for creating an interactive map from this we can either call gdf like gdf dotplot if you Call all the pro will be plotted and if you wish to create a uh uh interactive map so we can call gdf do exlore I call gdf do explore and you can say that a interactive map got created there and it shows the information about all these states like if I click on this it says District chud chudur Gujarat and this there are no remarks District length shape length
shape area and all attribut which you Which are there in your shape file or whatever format you have all will be displayed that a popup right now if I if I go to any state the detail about that district is shown to me immediately so whatever attributes you attach to that that will be shown automatically right like this you can create an interactive map just by calling explore function on your data frame then you can specify many more arguments to this explore function like You can specify color column if you want to make this color
as corl map then you can specify on which column based on values of which column to make it corl like column so column equal to District so like suppose may be on the name of name of districts we want to color them then tool tip also districts i s District name value in the tool tip when whenever you over over around that geometry so on the tool tip it will show the name of the district then tiles so We can use there are different options for using the tiles on the back a base map right
so CP positron or there are other Maps which can be used as a base map then color map to be used like set one then other you can specify other style keyword like color and other things on this plot like gdf do explore and you can pass on these arguments also to the right now you can see that based on the name of the district all uh these Shapes has been colored and just if you H around that the name of that District only is shown previously it was showing all the attributes now it is
showing just the name of that district and a legend also got attached to this like junar kach Kaa and all so like this we have created and we can create a interactive cor interactive corl map using goopa now as we uh previously we said that when whenever you are creating a Multi-layer map all your input features should be in the same projection system right now let us see how do we manage projections so coordinate reference system is a coordinate reference system describes how coordinates in the geospatial data set relates to the location on the surface
of Earth right now supp if you just see the look at the file there is a column called latitude and longitude so that may be showing some number say 30 comma 50 but we do Not know what that 30A 50 represents is it 30° comma 50° or 30° 30 m or 50 m right so until there is a CRS attached to the file we cannot interpret those numbers like how we don't know how to map those values or Draw those values on the map so for that we need to have information about CRS as well
so basically a CRS consist of a three model of the shape of the earth say data approximated as a sphere or spheroid the units of coordinate system And the origin specified as as the meeting of the equators and Prime Meridan so at least geographic system will consist it is actually a 3D model of the shape of the earth which approximates the is which is approximated as a sphere right the units of the coordinate system the origin origin is must then the projected CRS consist of a geographic coordinate system like on based on which this is
has been created a map projection and Related parameters uh parameters for projecting the three dimension map to two dimensional that those other parameters as as you can say the map projection is a mathematical model that uses to transform the coordinate data right so finally uh a map projection is basically you can say is a mathematical model for transforming the transforming from three dimensional to two dimens three dimens space to two dimensional space crss are important because Geometric shapes in GE series or Geo data frame objects are simply collection of coordinates in an arbitrary space right
then CRS tells how to these coordinates are related to the places on the Earth right so whether this is representing a latitude longitude or location in say meters right so CRS is must for that and when you try to create a CRS using geopandas so geopandas can accept the definition of CRS or mathematical Model say in the forms of say PR pr4 string that specify project equal to Long light ellipsoid data and other parameters we can specify or parameters broken out as dictionary also you can specify like project equal to lat long ellipsoid colon wgs84
data so either either of these format we can specify the parameters of CRS in our F so now let's see how do you identify the CRS of GE data already we have seen an example but just for the Sake of completion I try to complete that so State boundary do uh SHP and we are trying to read that file and if you just call your data frame do CRS you call your data frame do CRS it shows the coordinate system of that CRS of that particular file right so it said that the file is in
projected coordinate system LCC wgs84 is the name of the projected lard conical transformation And it is based on the following geographic coordinate system and the are other parameters like L name is LCC wgs84 access info East easting in meters northing in meters area of use undefined coordinate operation name unamed method lamber conical confirm then these are the datam and ellipsoid and prime meridian information right so this way we can query the CRS similar way setting a projection is how one tells pandas how to interpret Coordinates CRS can be set by calling your uh ge series
or data frame. CRS right if you just call your data frame. CRS it just fetches what CRS is attached to your file and suppose if you want to initialize it a new value then we can call it your GE series. CRS is equal to maybe either we can specify it as say n is equal to with projection system using the epsd code of that projection system or we can specify them in PR for string or something like this also we can Create right now so here we are assigning that CRS to be none like we
are assuming that we are we want to remove the projection system from the file so if you assign our data frame. CRS equal to n the projection system from that that will be removed and if you try india. CRS it prints none right now if I just print say done now let us see how do we reproject so reprojecting is the process C of changing the representation of Locations from word coordinate system to another coord coordinate system so the data can be re reprojected using the method called 2core CRS like the first first first question
was now how why do we need to reproject right so we might be working combinely on data from say three or four or maybe 100 of sources and if all of these data are stored in different projection system right so before doing any kind of analysis on all the all of these data we need to bring Them first to the same CRS right so so that only we can go ahead with the analysis otherwise our results will be incorrect so reprojection is required for bringing them to the same projection system right so that is one
example so reprojecting basically is transforming from one coordinate system to another coordinate system right so now I'm reading the same file called India do read Vector file so that storing the boundaries of India the India do CRS If I do this is in projected coordinate system called LCC wgs84 so now suppose if I want to reproject it to the say code called geographic coordinate system with code epsc 4326 right so then I need to just call india. 2or CRS right so the for setting the projection we are just calling data frame docs so dot if
you just called Data frame docs it will just patch the coordinate resp reference system if you Call CRS equal to if you assign some value to that it will assign those that coordinate system to the to that data frame and for reprojecting to underscore CRS to which projection system you us to reproject it to right now if I call India do it says that this is the geographic coordinate system with wgs84 and this is the information or parameters of our projection system now if I plot this India Right now you can see that I [Music]
not Indore rep actually I should have Indore project so India was in M meters now you can say that India so this is in wgs84 not LCC this is geographic coordin GCS so now you can see that that it has been converted to latitude and longitude and if I call India plot this was our original so that Was in projected coordination actually the title is incorrect so there you can see that these all latitude or or say X and Y are in meters but after reprojection they have become say in the range 70 to 95
and 10 to 35 so they are in latitude and longitude like but just by calling two underscore CRS method we can reproject and you for shave file and now let us see how do we write geal data of these Vector files so writing for reading we have the Function called uh read file so similar way for writing we have function Cod right like I have try I'm trying to read this Vector file District bound. CHP gdf gdf do head these are same as we have discussed in detail right now suppose if you want to subset
this like just uh extract the rows which contain information about Gujarat so we can call it Gujarat equal to gdf gdf State equal to Gujarat it will just filter only the row which have Gujarat as state in their column and then suppose if I want to attach extract only these columns from that like district and districts State remark and the geometry only so then I can extract like this only Gujarat I just I'm removing all other columns and just only saving these column District State remarks and geometry Gujarat do plot if I see this is
the state of Gujarat and I if I see head of Gujarat so you can see that these are the the these columns only we tried to extract from more main file like this right now suppose if you wish to write this to the file then we need to call the function toore file right if you call your data frame. 2core file and specify Gujarat do shape if it is there I will just try to remove R already this is there so I will just delete all these files from here and if I run this at
GDs gat2 fat. SHP so you'll say that all Associated files will be created here automatically right now you can say that this Gujarat has been created Gujarat cpg dbf PRD SHP and SSX all these file got created here right so then these files either you can open with Z pandas itself for your analysis or you can open them with any standard GIS software similar way suppose if you wish to write a g GI Json file right so then you can specify Gujarat 2or file the name of file say Gujarat geojson and you need to specify
another argument here called driver which driver to use like Jal there are different drivers for handling the intricacies of different formats right so we can need to specify driver is to so by default the driver is for esri shape file then suppose if you want to write it in a different format say gojon or go package they can then you can specify driver is equal to gjon if you say the Gujarat file will be stored at Gujarat gjon if it is available not there then if I write it it will be saved at Gujarat gjon
so now if I see Gujarat so there is a file with name Gujarat do geojson if I open it so any this will contain all the key value pairs as we have disc May feature or feature collection type of as a key value pairer all GI Json data right like this we can write a GI Json and similar way suppose if you want to Create a GE package so these all geojson and all other were able to save only single layer now suppose if you wish to write multiple layers and that you want to write
in a go package so then you can specify like like suppose here I want to write a layer two layers two layers into the file one containing polygons and another containing point point point shape right so District boundary file District then I'm just reading those files District boundary for for state of Punjab and the district headquarters of Punjab see District boundary these are the headquarters of all districts of Punjab then if I plot and see them then they they look like this and then suppose if I I want to write them so then our district
boundary. two file like Punjab do go package then which layer what what layer I want to give to that so layer is equal to District driver driver now you need to specify G gpg and similar way District HQ do2 file and the file name of the file also is same then the what name you want to give to that layer and driver so with that a file with Punjab gpg will be created there so P Punjab do geo package has been created that contains two layers if you open it with any G software or directly
with goop pandas then we can see that a file is created with two layers so now we just try quickly cover Some basic geo special analysis that we can do with geopandas and actually there are many more things that can be done so in special analysis our goal is not just to make nice Maps but to actually run analysis that Leverage The explicitly special nature of our data like we want to extract some useful information from that speci not just create the map so that process of doing this is what we call as spatial analysis
so to construct spatial analysis we need String together various geospatial operations in the such a way that the end result answers the questions answers the questions of our question of our interest there are so many such special operations so these operations also also known as special queries so the queries basically can be divided into two parts one what we call measurement queries so the measurement queries will fetch do some measurement on those geometri like we want to know what is the length of Feature a so suppose feature a is a line you want to calculate
what is the length of that feature and suppose feature a is an polygon you want to calculate the area of that feature or if it is a polygon what is the perimeter of that or how a how far is a from say certain other point B or how far a is a polygon and as polygon From A Distant point right and there are a second type of analysis of queries that what we call relationship queries so that there we we Want we try to find out the spatial relationship between two objects right we can say
we want to find out if if is feature a within feature b or we can say we want to identify does feature a interact intersects with feature b or does feature a cross feature b or does feature a within feature B and all right so these kinds of queries are called relationship queries so we will first try to uh do that And come back there so so now let us see now any will read first the same file our state boundaries. SHP and if you go india. head it calculates this right now India is our
uh full data frame now suppose we have a in this we have a column called geometry right now these are the geometri now suppose and we have the area also already we have like whatever shape file Are downloaded from survey OFA that itself has a shape of that each polygon also attached to that now suppose we we did not have this shape uh area of these polygons right so suppose if you wish to calculate like you want to do a measurement query on these on this geometry column right so we can call this our India
or data frame do area area if you call what it does it will calculate the area of each polygon in our geometry column like there are so Many polygons in our geometry colum every row represents a polygon or multi polygon so suppose if you to calculate the area of all of these polygons then just is as simple as calling or data frame do area so what it will do it will calculate the area on each OB area of each observation of our go Series right if I call india. area so you can say that it
has just calculated the area of all these right so this is like let's calc Because this was already in projected coordinate system so we can directly calculate the area do area if you call then now suppose if you want to calculate attach it in a new column called new area so I call like India a new column with name area equal to India do area if I do a new column will be created there there you can see the difference between what area was already there in that column and what our go pandas has calculated
now you can see That previously when whenever we have with the shape file itself the area was like 7.83 276 into 10 the^ 9 so the similar thing is there in the in our new calculat area as well right right here these all these these two areas are closely matching so like this you can calculate area length or whatever you us to do uh whatever measurement query you want to perform on the geometry right so suppose if you want to Create a geometri like how do we create a geometry for that we will be using
a package called shapely so shapely is basically used for creating the geometries right suppose if you wish to create a GE series that contains a polygon a line string and a point like these all thing we are uh creating together so from shapely do geometry import polygon line string and point right as we said that GE series is like a a column so Every every row of that column will contain some or other geometry right so suppose if you us to create a geometry so we are calling here s s equal to GPD do GE
Series so we are creating a GE series that contains a polygon so these are the vertices of our polygon right so these are not explicit explicitly we have not closed them so like if you would specify something called a polygon so g c automatically implicitly we'll close it like the end End node also is going to be the starting node only so that we not we not need not specify separately right so we are creating three things inside inside this a polygon a line two lines and a point and if I see this s so
like this if I call S do plot here you can see that a polygon there is a polygon a point and maybe the one two lines are there so one line is this another line Maybe by seeing the Coordinates you can see that like this we can create a CO now suppose if we are creating another line called line string and if you wish to check check that where this entire series whether all like if you want to check that check for all the elements of our go series if they intersect with this particular line
right so if you want to see the spal query then we can call S do intersects line so what what it does it checks for all elements of s if they intersect Anywhere with the line which we have passed here right so then it will check true true true so it means that these all geometries intersect with the line right so now similar if you wish to do some another kind of proximity analysis that also can be done like here we have the we have containing the state boundaries and another file containing the all major
towns right so then we are reading them State and Towns and we are just fetching the all the towns of States Andra prades and suppose if you us to fetch all the states all the towns actually suppose if you assume that in our town shap file we don't have the attribute called to which state that particular Town belongs to right so then suppose if you wish to know from the these towns which all towns are coming and under the states of Andra right so then we can call this towns do within Andra do Geometry. entire
Andra geometry just you want to represent at a single so we can call this like towns do within Andra so all the towns which are coming within the Andra state that we can uh fetch using this it's one towns we can call like this then here we can say that like so all the all the major towns which were intersecting or within the boundaries of Andra state only all only those S so this is kind of of a special special Query right so this way we have extracted all just all the from our towns major
towns layer we have just excted only the towns which are falling under the which are within the boundary of state of Andra Pradesh right now suppose if you us to create some proxim analysis so that also can be done quite easily like suppose here we have the states file there are towns major towns and state headquarters and now suppose if You wish to see that which all towns are coming within say 10 kilometers of our state state headquarter of that particular State suppose if you want to query like this right we have three uh layers
here one is containing the boundaries of all states and another is containing the major towns of the entire country and there we have another file containing the state headquarters right now suppose if you wish to know that all which which all major towns are coming Within say some 10 kilometers of their state headquarters right so from for All State suppose if you want to extract only the towns which are within certain distance of our state headquarter right so we to do s such kind of analysis these are the files and I have read all these
files so first thing what we need to we need to create a buffer around our state headquarters right now suppose how do we create a buffer around our All Points of Our state headquarter then we can call State headquarters do buffer and distance 10,000 right so create a buffer of 10,000 M around each state headquarter so we will call that as headquarters buffer right now we want to identify the towns near headquarter so we can say towns dot within H HQ buffer right HQ buffer is by call CU do plot so you can see the
small buffer has been created around all of these State headquarters and if I call towns. within SQ buffer. unary Union so that will just fetch all the um towns which are within the buffer of this within the buffer of that within the within the distance of 10,000 kilomet from the state headquarter right now we we are just uh fetching all towns do towns near HQ from our towns database only the towns which are falling nearer and if I plot them all together then we can say that these are some State headqu headquarters and that There
are the towns near that and if I say towns _ HQ so like this is the detail of these these all major towns which are near major C towns which are near there uh State headquarter like you can see in dadun clementown rajur jajra rur so these are the areas which are within 10 kilometers of the state headquarter like the similarly for other states like the we have just fetch fetched only the major towns which are within 10 Kilometers of the that particular State headquarter uh Capital you can say right then suppose if I if
you used to explore them on interactive map you can do it like this as well right so if I go to thead so these are four major towns which are within 10 kilomet of theun headqu theun Lo like whereever they have assumed that this is the location of the within 10 kilm these are the cities right so somewh similar way if I go to say some Southern State Goa bangaluru I think there are no City like Chennai Chennai so these are the major towns within the proximity of the state right so this way we can
do any kind of proximity analysis and suppose if you create some other geometries from that like if you wish to create a convex hell around your entire geometry right so convex hell returns a representation of the smallest convex around that polygon right so represents so what is The convex cell convex cell is a represent is a representation of the smallest convex polyon polygon containing all the points in the objects unless the number of point in the object is less than three right so this is a convex representation of the All Points inside our basic geometry
like suppose India do convex hell if I do right you can say this is a convex representing a convex uh polygon representing all the points inside Our main geometry similarly if you wish to create envelope so envelop represents is a representation of the points or smallest rectangular Point polygon that contains the objects right so this is by calling envelope we can create envelope around our main uh ge series similarly if you just just want to simplify so the want to if you want a simplified representation of the geometric objects like all points in the simplified
object Will be within the within the tolerance of the original geometry right so suppose if we want to create a simplified uh from the complex geometry you want to use to is a simplification of that then you can call india. simplify and you can specify the tolerance distance or and if you to preserve the topology you can say true or false so sim. plot if you do it say a simplified representation of our entire go Series Right so with this we come to the end of lecture so I thank you very much for attending the
session





![Lofi Jazz Study Music ✨ Lo-fi Jazz Mix for Deep Focus & Work / Concentration [Chill Beats]](https://img.youtube.com/vi/q9naUafb5Vs/maxresdefault.jpg)
![Upbeat Lofi - Deep Focus & Energy for Work [R&B, Neo Soul, Lofi Hiphop]](https://img.youtube.com/vi/THh4fT0O7IY/maxresdefault.jpg)







![Upbeat Lofi - Power and Energize Your Workday - [R&B, Neo Soul, Lofi Hiphop]](https://img.youtube.com/vi/ONcY0BM5EAg/maxresdefault.jpg)