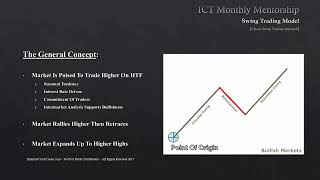
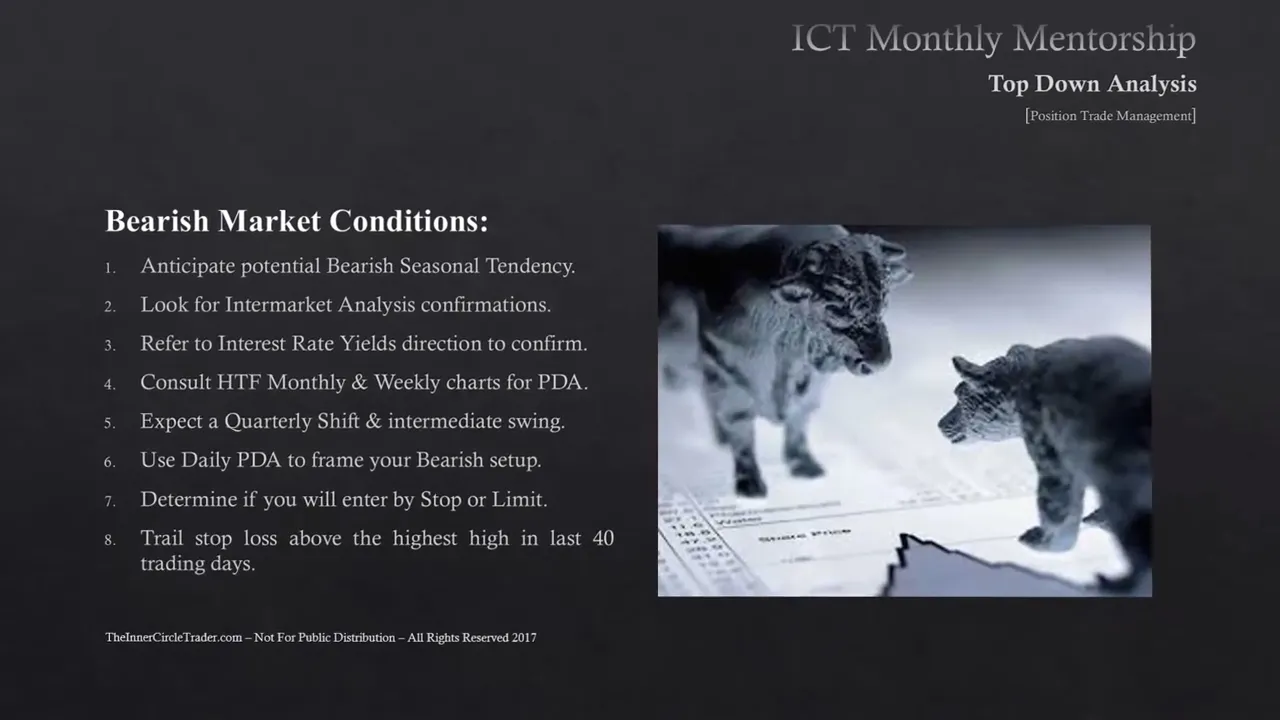
welcome back folks this is lesson eight of the January 2017 ICT mentorship this tutorial is going to be specifically dealing with the possession trade management okay for bullish market conditions we like to anticipate potential bullish seasonal tendencies and again like I preface in every one of the seasonal teachings it's not a Beyond though it's not a Panacea it's just a rule of thumb a road map if you will about what may unfold in price action just because it's done it for the last 40 plus years doesn't mean this year or next year or the three years from now when you sit down in front of the charts doesn't mean that's going to be the outcome you see in price but we start there because seasonal Tendencies are just that there's a tendency for price to do certain things since we're looking for bullish market conditions we're going to be focusing on the bullish seasonal tendencies that are most likely to occur in the next three to four months we went through some of my ideal seasonal Tendencies which ones I like and how it go in to the marketplace and look for them what we do after we identify what most likely will unfold for a bullish seasonal tendency is we have to look at inter-market analysis confirmations is there something to suggest there really is a bullish technical picture for that seasonal tendency to come to fruition if there isn't any technicals to align with that seasonal tendency this season it's a seasonal isn't going to drive price but technical is in alignment with the seasonal tendency are a very powerful couple what is the interest rate markets telling you okay are are yields increasing because if the yields are increasing it's going to be good for the currency that you're trading if we see Divergence between the yields that may suggest there's going to be a shift or a pause in the underlying direction of the marketplace at the current moment when we look at inter-market analysis we are blending the two of interest rate yields and we're also blending the four major asset classes the stock market interest rates Commodities and currencies all four of them together should be confirming your general outlook on the marketplace now you may not get clear pictures from all four but if you're getting three to indicate that your directional bias for your asset you're going to be trading is in fact what they're suggesting as well or confirming then you probably got a pretty good trade idea lined up once this occurs we go into a higher time frame monthly and weekly chart for PDA now PDA is premium discount array or PD array I'm going to be abbreviating that for the remainder of this mentorship so that way when you receive PDA it's the premium discount arrays that means the order blocks all the things I look for for institutional reference points we're looking for a higher time frame weekly and monthly charts to indicate where institutional overflow on those particular time frames will look to seek to trade to when we understand there's two higher time frames then we'll know what the daily chart is going to do and we're going to be focusing on the daily chart for a quarterly shift or intermediate price swing every three or four months we're going to be looking for this new price Wing to occur and we're going to be looking at inter-market analysis interest rate yields to suggest that is in fact unfolding we're not trying to pick the absolute low and we're not trying to pick the absolute High we are trying to get in sync with that quarterly shift to get the meat in between in other words the biggest portion of the move that's what we're focusing on we use the daily pdas to frame our bullish setups in other words we're looking for ore blocks voids gaps rejection blocks you know old highs hold lows we're looking for those things to to frame our buy setup we're waiting for that to occur based on what we see on the higher time frames and with intermarket analysis and hopefully a seasonal tendency is also suggesting a bullish move as well when we have these things in alignment we have a great deal of confluences in our camp we're looking for a high probability scenario in that case once you get to this stage what you're going to have to do is to you're going to have to determine whether you're going to be a buyer on a stop or a buyer on a limit it doesn't matter which one you'll elect to go with but just understand that if you are going to be trading with limit orders there's a probability of you missing moves or missing your fills because you're demanding a specific price level when you go on a buy stop generally you're going to end up getting filled more times using that order but unfortunately that creates a little bit more Gap in between where you're entering and where your stop loss is going to be if as long as you're not over leveraging your account which brings us to how much money should you be risking no more than one percent and again keeping the idea that you're taking big positions in terms of the time that you're in there but not big positions in the terms of how much you're allocating to the to the trades so you're looking for big moves with a little bit of your account by having that your risk is going to be reduced but your maximum payout is going to be massive in terms of how many Pips you draw but still it's going to be relative in terms of the percentage because it's just the nature of this time frame once you determine you're going to be buying on a stop or a limit and you enter the position you're going to be trailing your stop loss below the lowest low in the last 40 trading days now this brings us back to the ifta data range why are we looking for the lowest level last 40 trading days because if we're looking for a bullish move the market will most likely not want to go back 40 trading days to find the low it's going to be looking for the highs in the last 40 trading days so that means we are going to have a trailing stop loss order that's very handsomely behind the current market price and it's going to take a very significant price move to stop you out it avoids getting knocked out of the marketplace prematurely and when you're trading long-term trends or long-term quarterly shifts the worst thing it can happen is get knocked out prematurely and then the market moves take place and you miss out on that move in this time frame you are not looking to Trail your stop-loss Ultra tight you have to have some freedom in the market you can't just let it you know you can't demand really Ultra tight stops in long-term trading you gotta allow it to move a little bit gyrate pool back against you sometimes and initially when you first get in the trade you just gotta have to weather that and unfortunately it may not be your cup of tea but that's again the nature of the Beast once the trend starts underway and it starts moving in your favor if it moves 50 percent of the range that you expect to see unfold on the monthly and or weekly chart because that's what you're actually trading off of you're executing on a daily chart once that range moves to 50 of what you expect to see in terms of profitability say say it's a 500 pit range or a thousand pip range If It Moves if it's a thousand foot range we're referring to If It Moves 500 Pips in your favor you need to still consider what the lowest low was in the last 40 days your stop loss is going to be below that but when we get above 50 percent then we're going to be looking for the lowest low in the last 20 days once we get about three quarters of the way of the entire weekly monthly range you want to start trailing your stop loss below the most recent low in the last 20 trading days okay and I'll talk about that in examples in a moment but your permitting price to seek out the liquidity on the upside and giving it a lot of room to consolidate if it needs to before it goes another leg higher if you keep your stop loss below the lowest loan the last 40 trading days you're going to have a better chance of staying in the move and not being stopped out prematurely okay for bearish market conditions I could probably just save this slide and decide everything I just said for the bullets just reverse it but for completeness sake we are being paid to do this now so I want to give you both sides uh the bearish market conditions again we're anticipating a potential bear seasonal tendency so we're focusing on the Bears tendencies that have the most ideal conditions what times of the year are they expected we already know what they are we went through those in three teachings and once we understand what is most likely to occur seasonally again we're just looking for it first there then we're looking for inter-market analysis confirmations is there a suggestion across all four major asset classes currency markets interest rates Commodities and the stock market are they all in agreement with the expectation you have for the next three to four months and if interest rate yields are confirming that direction as well interest rates rising or increasing or decreasing is that Salient to your expectation for the bearish move that you're trying to to take on for next quarterly shift if this does align then we go to the higher time frame monthly and weekly and we start looking for the ranges and we look for the PDA for monthly and weekly objectives institutionally where are we looking to go how far are we looking to go down where are the old loads where are the bullish order blocks where are the liquidity voids on the downside where are the fair value gaps below us where are the mitigation blocks and potential Breakers we have to be valueful of okay all those ideas we have to start mapping those out because they're either going to be speed bumps or they're going to be rocket fuel for our next price leg in our bearish expectations so we have to be mindful of them going forward we'll have them already in our charts we won't be surprised by them and once we have all these ideas then we can expect that quarterly shift to take place and then therefore have an intermediate term price swing moving over the course of two to three potentially four months at maximum where we see a bearish move take place once we have the scenario outlined okay and we expect the monthly and or weekly ranks or swing to take effect what we're going to be doing is focusing on the daily chart and we're going to be utilizing the daily pdas that means the daily premium discount arrays or basically we're looking for bearish order blocks we're looking for bearish liquidity voids to fill in we're looking for old highs to sell above we're looking for rejection blocks above and old highs handles body and we're looking for uh bearish Breakers to trade into we're looking for mitigation blocks to trade against and sell off of all those ideas we're looking for that on a daily time frame to get in sync with the move we expect to see unfold on the monthly and weekly charts so we're using the daily PDA to frame our bearish setups once we have our setup what we're looking for is the determination are we going to be selling on a stop or are we selling on a limit order and that's going to be a matter of personal preference again like I said with the bullish market conditions if you're going to be selling on a limit chances are you may not get your fill so just take that into consideration and if you're 100 certain you have to have the entry selling on a stop is almost a guarantee you're going to get that fill because you're going to be selling on weakness and once that price is triggered you'll be short and again but it opens a little bit more risk from where you enter and where your stop loss needs to be which brings us to once you're in the move you're going to be using a trailing stop loss above the highest high in the last 40 trading days and what that's going to keep you from having happen is a premature stopout you don't want to get knocked out of the market before you actually see the move transpire you don't want to have any opportunity for the market to have a move against you and see it take off once it knocks you out that's enough it's very frustrating to see that happen and if you wait a long time for these long-term setups to get set up just to get knocked out prematurely you exercise so much patience to get to that stage than to Once get in it and then it knocks you out worse thing can happen is you get fearful or never get another opportunity to get back in and it takes off and runs away from you then you have to wait for another higher level objective to get in to uh and then you obviously lose some of the potential profit but nonetheless you can still get in the positions but it's nothing worse than that and having all the analysis done the homework the patience factor and get in in the market talk you know knocks you out prematurely because you're trying to have too much of a tight stop loss you don't need to do that on a higher time frame trading in fact it's better if you keep a wider stop and you try not to rush to move it up to break even because break even on long-term trading is just the worst thing they possibly ever consider you don't want to do that so we're going to be trailing your stop loss above the highest high in the last 40 trading days and by doing so what you're doing is actually giving the market room to breathe and move around when you identify the range at which you're trying to see unfold on the monthly and or weekly chart when the price moves 50 percent of that range in your favor okay in other words it's moved half the distance you thought it was going to even at that moment okay you're still going to be using the highest high and last 40 trading days your stop is going to be above that okay because you're not trying to get knocked out once it moves to about three quarters of the the range that you anticipate seeing then what you're going to be doing is you're going to be looking for the highest high in the last 20 trading days because you're getting really close to that ultimate objective and it may not really get there so you want to lock in as much profit as possible if you use the highest high in the last 40 trading days and you've seen three quarters of the move you may see a deep retracement that maybe end up becoming the actual reversal that you didn't expect to see think like Optimal trade entry it could go 79 of the total move you expect to see but then fail and go the other direction and you would just be knocked out with a great deal of more larger loss by using that trailing 40-day stop loss above the highest high and last 40 trading Days by reducing it to only 20 trading days we're using ipta procedures for data ranges but we're using measuring the ranges okay and grading the scale of how far that move has already happened when we start getting mature in our move we want to start locking in more aggressively that that position but we're only going to drop down to a 20-day look back once we get to three quarters of the move that we expect to see then we have to start dropping back in terms of how far we go back in terms of using a stop loss basis you know we're not going to use 40 trading days the entire duration of the trade we only get three quarters of the move under our belt you know obviously we're going to be looking to lock in some of that profit and keeping it from moving a great deal against us so by using a 20-day look back every single day while we're in the trade once three quarters of the move has been seen what you're doing is you're ultimately bringing that stop loss closer to the market price but not so close that knocks you out if it does knock you out and goes to the below a 20-day low chances are you probably May really handsome profit or you probably saved yourself a complete reversal and watch it erode more profits if you would have stepped just kept that that 40 trading Day High so let's take a look at a couple examples real quick and then we'll put in this January teaching up okay we're looking at the Japanese Genesis the weekly chart and we have the high up here and we have these equal lows we talked about during the live uh teachings of the mentorship and then below these equal lows we have these two panels which makes the bullish order block and what we're going to do is we're going to add a Fibonacci just to grade the scale of this entire range so we have this high all the way down to this low I'm sorry this is high rather of this candle and that gives us our range low and this is our Range High okay and here's equilibrium right in here okay so we're looking at this move here after market structure has been broken we have this swing low here it's violated here and then we have a rally so we're going to be looking at this high in here only daily looking for an ultimate move down to this level here so we're going to go to a daily chart now dropping down into it and we're going to be looking at the sell side first okay here's that move we'll refer to this in a minute when we get to the um the buy side objectives but here we have this High here price has the um a break in Market structure here and we have a rally up it goes into this last up candle which is a PDA on a weekly basis and it's also a PDA for the daily and it's a bearish order block for us here trades right up into the body of this candle which is the open comes in at 121. 69 the high on this candle comes in at 21. 72 so only three Pips higher than this opening price at that candle here we have the up candle so we're going to be doing what we're going to be deciding if we're going to sell short on a limit we're gonna be selling short either on a limit above this close or we're going to be selling on a stop down here which one are you going to do but what we're doing is once we get in we have to use the high in the last 40 trading days I have here a range that's already been created with 40.
right here so there's 40 trading days from this day here which is the trade day here because you have the up candle this is the day you would trade Look Back 40 days your stop loss has to be above here so your range of risk is framed out for you by doing this and let's just say you're going to sell a limit if you have a stop loss of 250 Pips you got to be above that say 260 Pips that's your stop okay some of you are probably cringing with that 260 Pips good grief it's long-term trading folks and I mean you really gotta change your uh way of thinking about it because it's not going to be the same as it was when we were discussing complete uh intraday action and then you can do things like this you can go here is one two three four five six seven eight and we won't get nine it just falls short of that okay so we have basically eight r on this trade that's falling short even at the objective so we can have uh that one off here and here's AR right there okay so selling short up here we have 8 times 260 Pips the thing about that that's a massive move okay it's huge move okay and as you trade this what you're doing is you're you're continuously every single time you look at the trading day you're in you're going to be looking back and again I have another Ranger here 40 pip uh 40 trading days range or approximation let's say like that okay every trading day you're going to keep looking back what was the highest high in the last 40 trading days okay each trading day you're looking at the right end of this here okay every single trading day you're looking at the highest high and you're keeping your uh stop loss above that high whatever that whatever that high is okay like right in here looking back in the last 40 trading days your stop is above this high at this point here we have that real deep trading retracement your stock has got to be above these highs okay this is where we actually hit the objective so anything past that doesn't mean anything but at this moment here your stop has to be above this hot here so it keeps you from getting locked knocked out prematurely and again eight times 260 Pips that's this huge huge move so we're going to focus now on the buy side and we saw that Weekly bullish order block down here and we expected it to trade back up to the weekly bearish order block in here here's the buy Looking Back 40 trading days your buy uh buy position has a protective sell stop below these lows in here okay if you bought in here before the election and we had that big wild whipsaw even with this wild whip saw if you would have bought this day here on a limit below the close here on the limit on this candle if you bought here on this candle on a limit on this day here yeah you would have saw profits and then on the election day you would have rode through all this probably would have been scary for you but even then 40 trading days back your stop has to be below here so you're not knocked out long term you're in there and again the same thing you're looking for the lowest low when you buy it in the last 40 trading days like for instance if you bought here your stop has to be below this low let's see which one's lower this one the low is 109. 19 and then you have this candle here yeah one and 9 19 so it's got to be below this low here and then you have another buying opportunity on this day here again your stop still stays below here on this day again your stop still stays below here on this day here the lowest low in the last 40 trading days is here still but we have to change gears now once we get half the range I'm going to add a fib to this we have our low foreign here and once price trades through this here we start looking back 20 trading days and we start trailing our stop loss below the lowest low in the last 20 trading days so we get 20.