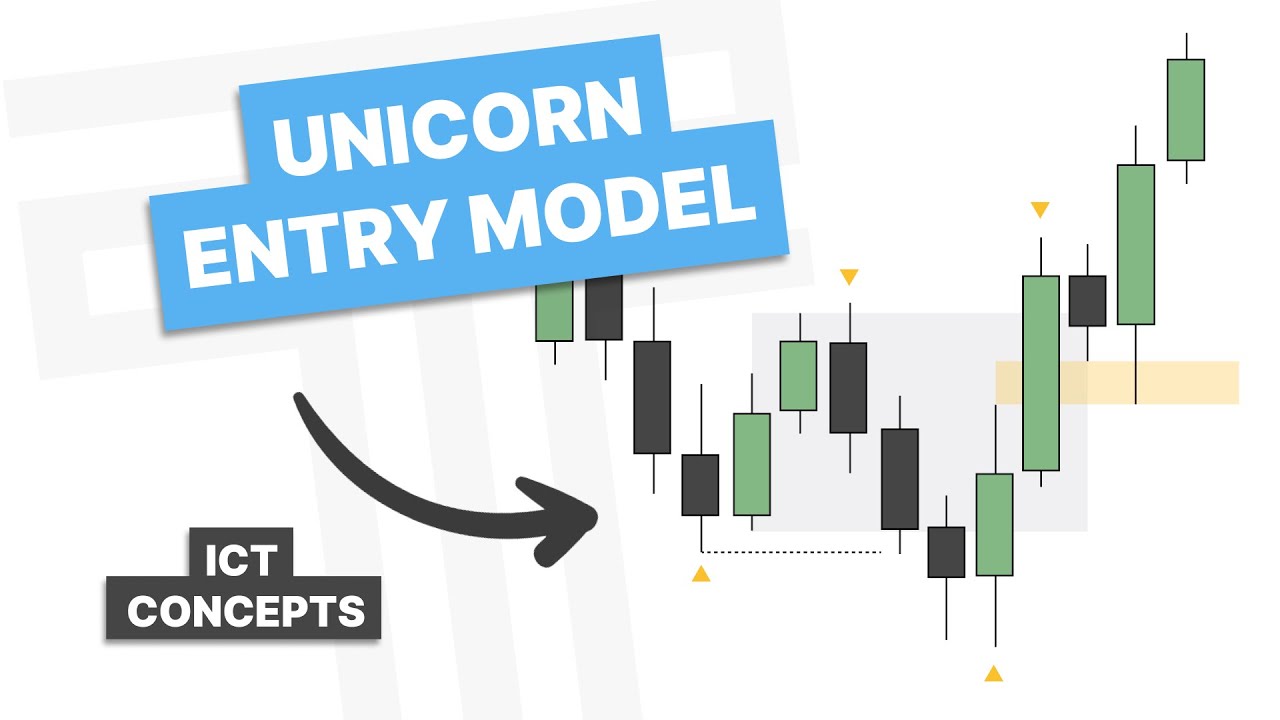
what is up guys welcome back to another video as you can see we now have a face camera so nice to meet you my name is Lucas and I'm here to provide you a simplistic approach to trading the markets you probably already know a lot of people out there make trading way over complicated and more complex than it needs to be the simpler the better and I'm here to make things very simple for you and easy to understand so the video of today's topic is a much anticipated one the unicorn model it is the strongest algorithmic technique and in order to understand that we're going to break this into three parts first going to go over what a breaker is we're going to go over what a fair value Gap is and then we're going to go over a very important aspect which is time at the end of this video we will also be going into some examples to fully understand what a unicorn is and you will be able to implement this model into your trading by the end you find this insightful if you think a friend might like it might find it insightful as well share it give it a like comment and also subscribe I would really appreciate that enough talking let's dive right into the good stuff so we must first understand that the market only reverses in two ways we have breaker swings and then we have failure swings breaker swings take liquidity prior to the reversal being old swing high or swing low they are breaking liquidity hence the name breaker swings failure swings fail to take any liquidity prior to the reversal hence the name failure swing now these are both just ways of smart money order mitigation a failure swing is simply an mitigation block and a breaker swing creates breaker blocks all right now that we understand the only two ways the market can reverse let's figure out how can we identify a breaker correctly so let's further understand these Breakers they involve price making a higher high failing to sustain that high and then breaking down below a previous low the focus is on the swing low that formed between the two highs when price returns to the swing low it can now be considered as resistance and used for a bearish trade setup the same is true for the reverse a bullish breaker happens when the market trades lower takes out an old low and then breaks above that high that made the new low the focus is on the swing high that formed between the two lows when price returns to this swing High it can now be considered as support and used for a bullish trade setup so to properly Mark out the breaker we want to Mark the highest up Clos candles or series before the leg that took liquidity we marked the full range not just the bodies to properly Mark out a bearish breaker we use the lowest down closed candles or series before the leg up that took liquidity we mark this full range not just the bodies the most important thing when considering a breaker is that it occurs at a higher time frame PD array PD arrays I use are fair value gaps and swing highs and swing lows so you want to be looking for them only at these levels not just at areas in price having a higher time frame narrative is most important now that we fully understand a breaker what is a fair value Gap fair value Gap is a three candle pattern where the wick of the first and third candle don't overlap fair value Gap show an imbalance in price in the form of one-sided delivery a bullish fair value Gap is what's known as a busy buy side imbalance sells side INE efficiency a bearish r Val Gap it's what's known as a CBI sells side imbalance buy side and efficiency so what resides in this Gap a lack of fair value there's an imbalance so price will seek to return to the Gap to rebalance the imbalance essentially just offering fair value and then once that's done we can now seek liquidity higher in the case of ay or lower in the case of a CBI we now know what a breaker is we now know what a fair value Gap is let's combine the two and you get a unicorn entry function the strongest entry function you will find in the marketplace so how can we properly identify this well we want to see displacement creating a candle body closure above the breaker high in the case of a bullish breaker in the case of a bearish breaker we want to see displacement creating a candle body closure below the breaker low most importantly we want to see that displacement create a fair value Gap so that fair value Gap has to be aligned ining with the breaker it can't be above it it can't be below it it has to be aligning with the breaker at least a portion of it lastly we need to have unicorns aligned with time time is of the utmost importance here the time and these kill zones provide us with the volatility needed for price to reach its targets time is not only just kill zones but it is also the economic news calendar which I believe I have a video going over everything you need to know about that check that out up here or where is it up here so check that out anyways back to the kill zones we need to have a Kill Zone aligned with our unicorn use the London session you can use the New York session if you're going to be trading Forex pairs I recommend trading the London session 2 a. m. to 5 a.
m. eastern standard time and if you're going to be trading indices focus on the New York a. m.
session 8:00 a. m. to 12: p.
m. before diving into some realart chart examples I want to leave you guys off with a checklist to follow in order to identify and determine these high probability unicorn setups because you just don't want to take any breaker overlapping of the fair valy Gap at any moment in time certain things have to be in line in order to take that we don't trade patterns first thing you want to have a clear draw liquidity based on the higher time frames how do you determine this well understand the market does to think seek liquidity or offer value with your understanding of that finding a bias is very simple second you want to have a higher time frame PD in line with that bias right so for example you're bullish you want to have a 1 hour for Value Gap that is also a bullish for Value Gap and take that as long as it aligns with time right that's the third point you want to have time aligned with that unicorn entry function this means that unicorn must be formed in London session or New York session and lastly you want to have the actual unicorn formed so you want to look for that breaker and you want to look for that overlapping fair value Gap with the breaker and then have when you have all of that combined you have the Unicorn inside of time inside of a higher time frame PD in line with the higher time frame bias draw liquidity you have yourself a high probability entry function so now let's dive into some real chart examples so here we are on the NASDAQ 4our chart let's find our draw on liquidity first so we need to understand that price is trading at all-time highs right here at this moment in time so there's no reason to look for lower prices we just want to look for a higher time frame PD we can use to trade in line with that bullish buy so what can we see right here well first PD I see the only PD I see is this 4-Hour fair value Gap resting low price right there now what else can we observe in this chart recall the early concept that was taught on this channel months ago external range liquidity and internal range what's happening right here we are sweeping external range liquidity we're now likely going to draw into internal range liquidity once we reach that internal range liquidity we're then likely going to seek external range liquidity again erl to IRL IRL to erl now that we understand that we're simply going to wait for price to come into a higher time frame PD inside of a Kill Zone and look for our entry model here we are on the 5 minute chart now we're just waiting for price to enter our higher time frame PD right here we are inside of a Kill Zone which is this this gray shaded box from adm. to 12:00 p.
m. New York Eastern Standard Time so let's wait for that breaker to form first and then that fair Valley Gap to displace right through it so you can already see the breaker forming right here potential we can anticipate that Mark this up as the potential breaker to be it is the highest up close candle right there that swept lower time frame liquidity right there right perfect now we just want to see displacement Above This breaker high and right there we see the displacement we see the closure above the breaker and we see the fair Valley Gap overlining so now we have a valid unicorn setup right here for us to take now our entry will always come at the high of the breaker stop loss will always go at the low of the breaker and we will simply Target to R right off of that no thinking is really required here very mechanical so now that we're in let's see how this played out and I did take this on a personal Live account if you want to see the executions on that I did post it to Twitter when was it July 10th so if you want to go back and fact check me on that you can go ahead so this was that unicorn setup we had our draw liquidity we had our 4H hour p 4our for Val Gap we had our entry function occur within a Kill Zone and we simply Target to R moving on to our next example we are on the gold Futures daily chart right here first thing we want to find is our bias what is the bias right here well this is a very simple read let me know if you can find it I'll give you a few seconds right here all right we see daily internal range liquidity to external range liquidity very simple here here we also just see previous day's High getting sorry previous day's low previous day's low getting swept right here forming a rejection candle sweeping that previous day's low getting some nice displacement right there we can expect this next daily candle to expand right towards our external range liquidity Target we have a bullish buyas bullish draw liquidity right here we want to look in the lower time time frames here and find a PD we can use to get in line this could be a 1 Hour 4 Hour even a 15-minute Gap let's do that here we are on the 15minute chart and we just want to find a PD array we can use to get in line with that bullish higher time frame bias what do we see right here right as we enter the New York Kill Zone we see a 15minute bullish for Value Gap being painted right here we now have a pdra in line with our bias we can now go down into the lower time frames and look for an entry right there so I just tried going down into that 1 minute time frame on trading View and it just didn't load any of that one minute candle data it's impossible now to look at that since it is few weeks ago here is the Twitter screenshot of the execution right here we can still look at this just fine where's the breaker right here we have that swing low swing High breaking this swing low and Then followed by the display Above That Swing high right so here is your breaker pattern right there and then you have that fair value Gap right here overlapping with that you want to Mark the highest up close candle right here in this range we simply enter at the breaker high right so this would have been your entry I was late to this that's still fine we enter right there stop loss below the breaker and Target to R just like that and as you can see we had smooth delivery all the way up to that daily external range liquidity right there beautiful unicorn here we are on the S&P futures weekly chart on our next example we are now first going to look for our draw on liquidity our bias how can we determine that remember Market does two things it seeks liquidity or offers fair value let's observe the story that was told by Price here we had a weekly fair value Gap that could have been the reason for lower price prices clearly it failed likely to happen next fail to offer fair value there's only one more thing that can happen next which is seek liquidity we see that happen or we see that liquidity right here that we're drawing towards to next likely and we see an opposing pdra created via this weekly VY this bullish fair value Gap right here now what is this this is weekly internal to external right here IRL to erl beautiful very clean context we can work with and expect bullish trade setups to present themselves going into this next week now let's dive into the lower time frames and see what other pdas we can use to actually frame a trade setup within a Kill Zone so here we are on the 4our chart we want to confirm a change in state delivery on this time frame from a weekly level basically commencing the market make your buy model once we can observe that so we see that right here we see a 4-Hour fair value Gap displacing higher so let's mark that up it is a breakaway Gap though so I don't expect price to come down into that level let's go down a time frame here and look for a pdra we can use to get in line with these higher prices let's move forward in time and we see a 1eh hour fair value Gap right here which is beautiful to now expect higher prices out of right we have our bullish bias and now we have our higher time frame PD right in line right here let's mark the high of that handle that's simply buy side external range liquidity and we have basically 1 hour internal external range right here let's go down one more time frame and see if we can find this breaker occur right here which I already see it it is simply let me Mark out the diagram actually if you're still having trouble seeing the breaker very simple right we have a swing low created price enters that higher time frame PD right then we see price displace above this swing high price comes back to that swing high high right so think of it this way swing low swing High That Swing High breaks the swing low price then breaks Above That Swing High we want to Mark the up close candle in this range right there with a fair value Gap overlapping right so this depiction right here can be easily seen right here is that lower time frame liquidity sweep there which on this diagram which is here getting a bit messy lower time from liquidity sweep URS right here when to Mark the up closed candles this whole range overlapping with this small fair value Gap there enter at the high of the breaker and stop loss at the low of the breaker targeting a 2R from that beautiful right there and our entry occurs right at the Kill Zone open right at 8: a. m.


![How I Beat the Mental Game of Trading [After 5 Years of Failure]](https://img.youtube.com/vi/4gaaGDldQwY/maxresdefault.jpg)