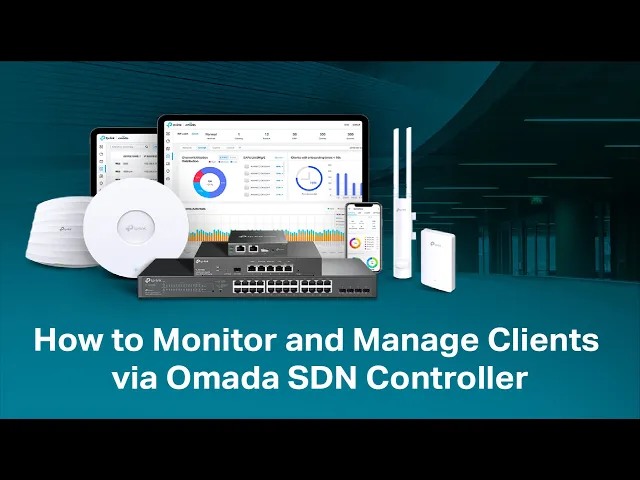
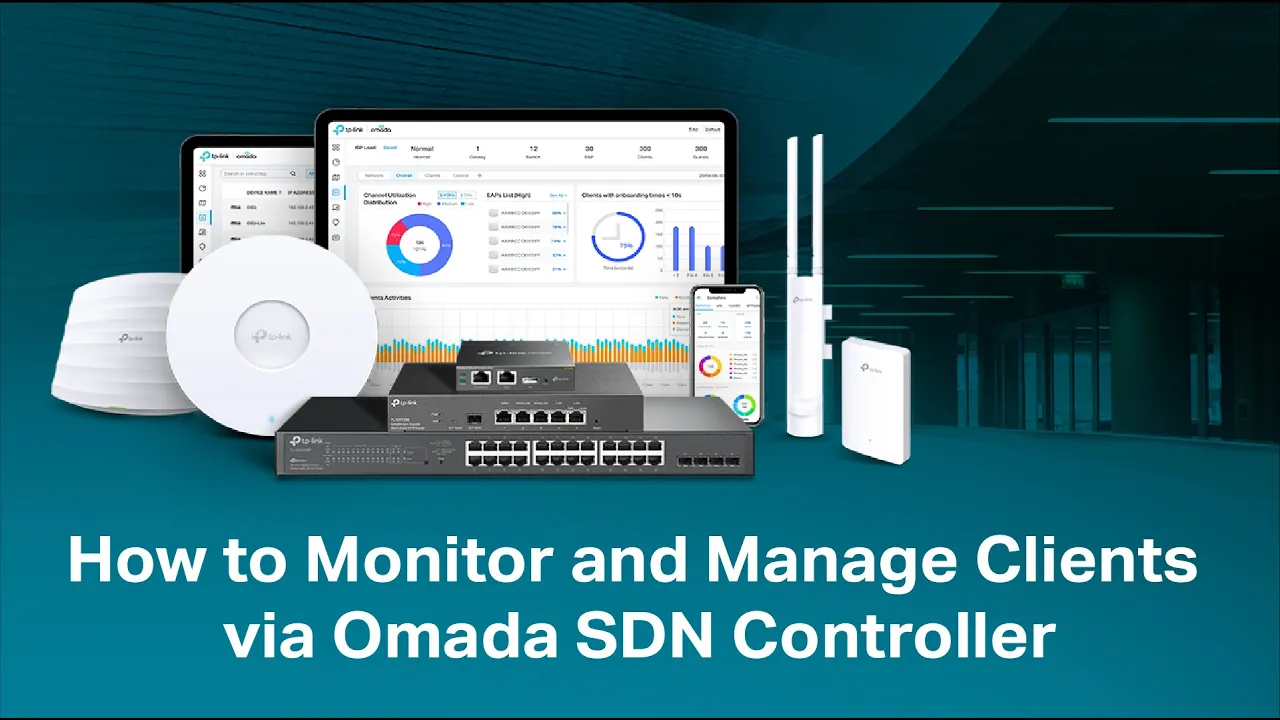
the omata sdn controller provides a straightforward platform to Monitor and manage clients connected to your network the clients page displays all connected wired and wireless clients on the chosen site and their general information you can also open the properties window for detailed information in configuration this video will show how to monitor and manage manage clients via the omata sdn [Music] controller to quickly Monitor and manage clients you can customize the columns and filter the clients for a better overview of their information quick operations and batch configuration are also available click the icon here next to
the action column you will have three choices default columns all columns and customize columns default columns include the following username IP address status SSID network AP Port activity download speed download upload and uptime the status column displays the status of a client which can be pending authorized and connected pending indicates that the client has not passed the portal authentication and is not connected to the internet authorized means that the client has been authorized and is connected to the internet connected indicates that the client is connected ected to the internet via non-portal Network the SSID network
and AP Port columns show the connection information of the clients the activity download speed download and upload columns display the download and upload information of the clients the uptime column refers to the client's online time you can also customize the information shown on the table based on your own needs for instance the wireless connection column displays the connection information of the wireless client including the the 802.11 protocol used and the frequency band when this icon appears in the wireless connection column it indicates the client is in the power saving mode if you would like to
change the list order click the column head and this icon to choose the ascending or descending order an example can help you better understand how to make use of these columns to Monitor and manage your clients suppose you are a network administrator of an apartment building when you're are dealing with complaints about the speed of a wireless network work you can add the wireless connection SNR TX rate and RX rate columns to the client's table these columns can help you monitor the wireless connection rates of the clients click SNR to arrange the SNR information in
ascending order so that you can easily find out the clients with the lowest SNR and check their wireless connection rates you can use a search box above the table to search for specific clients by their name IP address Mac address or channel for example if a client encounters some wireless network problems you can easily locate and monitor the client by searching its name to filter the clients by their connection type use a tab bars above the table for wireless clients you can further filter them by the frequency band and the type of connected wireless network
by choosing different frequency bands you can quickly filter out clients connected to specific bands in terms of the type of connected wireless network use users refers to the clients connected to a normal wireless network while guests refers to those connected to a guest Network for quick operations on a single client click the icons in the action column click this icon the clients will be disconnected and then reconnect to the network this quick operation is helpful after you modify your network like changing the range of Lan IP addresses so that you can force a clients to
update the network settings by by reconnecting to the clients click this icon the client will be blocked from the network you can go to Insight known clients blocked to check the clients being blocked in this way the available icons vary according to the client's status and connection type to select multiple clients and add them to the properties window click on the upper right hand corner and then check the boxes when you finish choosing clients click edit selected and and the chosen clients will be added to the properties window for batch client configuration in the properties
window you can view more detailed information about the connected clients and manage them to open the properties window click the entry of a single client or click here to select multiple clients for batch configuration after opening the properties window of a single client you can view the basic information traffic statistics and connection history under the details and history tabs the listed information varies due to the client's status and connection type in config you can set a name to better identify the client configure a rate limit use a fixed IP address and lock the wireless client
to a specific AP the rate limit setting here is only applicable to wireless clients connected to eaps when you enable use fixed IP address the controller will automatically create a DHCP reservation entry for the client this setting requires an omata Gateway as a DHCP server if you lock a wireless client to an AP the client will not be able to connect to another AP so as to address the issue of frequent roaming between APS and realize more stable connections after all the settings make sure to click apply before closing the properties window otherwise the configuration
for the client will be lost to manage multiple clients at the same time click here select multiple clients and click edit selected you can view their names and IP addresses in the clients Tab and remove clients from batch client configuration by clicking here in the action column under the config tab you can configure rate limit and IP settings and lock the wireless clients to a specific AP in batches click apply to save the configuration on the insights page you can monitor the site history of connected clients portal authorizations and Rogue APS for better monitoring you
can specify the time period and classify clients in known clients a table lists all clients that were connected to the network before on the site in the table you can view the client's basic information role and connection statistics including download and upload traffic connection duration and the last time it connected to the network you can also take actions to block unblock or forget the client here in past connections a table displays information about previous client connection sessions Association success includes information on the connected clients such as Association time duration upload and download traffic and more
a new record will be created on the list when a disconnected client reconnects to the network Association failure by recording the failure cause can help the network administrator trace the connection failure in pass portal authorizations a table lists all clients that pass a portal authorization before the insights page also includes information such as switch status port forwarding status and VPN status to learn more please refer to the user guide of the omada sdn [Music] controller