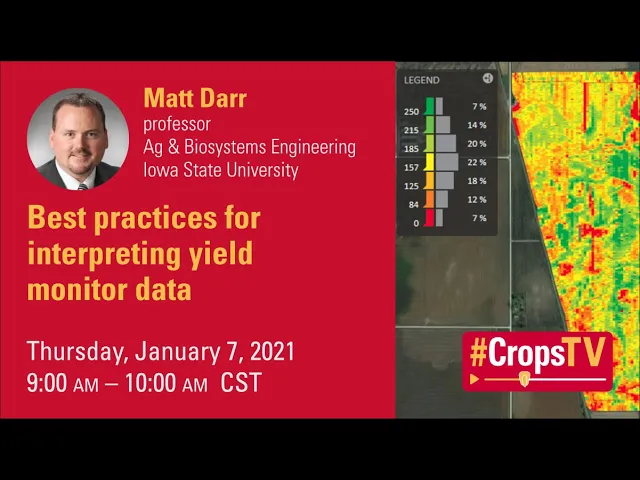
[Music] hi this is matt darr with the agricultural and biosystems engineering department at iowa state university i'm pleased to be with you with you here on cropstv to talk about some best practices for yield data analysis now we think about yield data analysis this is a very timely point of of the season to be talking about how to think about your your yield data and the uses of it and how to make sure you maximize the value from it you may be looking at yield data that was just collected from the past season or you
may be making plans for different types of field trials and treatments that you're putting in play for next year hopefully throughout the course of this presentation i'll be able to provide you some some tips and suggestions to make sure you get the most value from that data let's start with a with a little reminder about the value of data and why yield data is so important to us in making decisions about our crop production system within agriculture our yield is generally controlled through the law the minimum which means that whatever our weakest link is for
a given season that's normally what's going to drive our yield down or be the cap of our yield potential if we have a drought you know that water stress is going to be our limiting factor if we have too much rainfall or heavy nitrogen leaching that's going to be our limiting factor yield data and and quality on farm data can be a resource to help us understand where that that leaky part of the barrel is and allow us to make crop production decisions that hopefully plug that hole and continue to to rise the water level
across the board now um it's it's it's uh it's not realistic to think that we can fix everything in a given year and when we think about you know yield data we really should have a long-term plan on uh how to maximize the information and insight that we gain from that data and use it to continue to not only plug holes but continue to raise that water level across our farm now when you put this analogy of the law the minimum or these principles into into practice for us in agriculture i usually think about this
in terms of three different areas that that ultimately drive our macro level yield limitations or yield potential on our farms the first one is factors that involve soil climate or the environment and for many of us this is the the primary factor involved in spatial management and why we would want to do spatial management on a on a farm we've got a yield map up here on the right side of the screen and what you see in that map is different pockets of high yielding and low yielding regions many of which which correlate to things
like soil types or differences in landscape position those aren't things that we can just change we can't fix our soil type or or create a new soil type per se but we can change our management practices and hopefully use yield data to influence those changes and enable us to to maximize the potential we have in those areas the second thing that can be a primary driver to our crop input decisions is the inputs that we choose so what we choose in terms of the hybrids that we select the type of tillage or management practices that
we use the rate of fertilizer or or nutrient crop nutrient plans that we use all of those factors also will will ultimately impact our ability to maximize yield potential data can play a key role there as well data particularly on farm trial type information can help us to understand what type of of scenarios and crop production practices are maximizing our potential on our our individual farm so for both number one and number two here data is a key way that we continue to evolve our management practices and hopefully grow in a in a more profitable
more productive scenario in the future the third aspect of of crop production limitations is is what i call our production system job quality and this ultimately is simply the the the quality in which we execute the crop cropping system and uh the image here on the right again shows uh some tire tracks to the field which are a fairly common limitation right soil compaction or or maybe a plug nozzle on a sprayer or a nutrient applicator those are factors that that will often cause additional yield drag that that frankly is a is a little bit
more difficult to to capture and react to but also is is a piece of that overall yield puzzle so how does yield data play into all this well ultimately if we're going to uh to plug the hole in the barrel and and identify what our limiting factors are in production we need data to do that we need high quality machine data usually as applied data for how we're implementing different practices along with yield data that we can use to correlate against that and understand where we have opportunities to to improve so i'm going to walk
through a number of tips today and and talk about different strategies to maximize the quality of that data i want to start though with a quick background on yield monitoring technology the basic technology for yield mapping and yield monitoring and agriculture really hasn't changed a lot since its introduction in the early to mid 1990s this is a technology that that we've had available for 25 going on going on 30 plus years and has been a reliable component of our ag information systems for a number of decades the the basic technology uses an impact plate on
on the majority of manufacturing solution manufacture solutions to correlate or or or transl transition the the mass flow of grain into a measurable signal that we can record and turn into a map and again when these are done well we should see strong correlation of things like you know yield to soil type or yield to to uh different production system practices i often get asked what's the you know how accurate are yield monitors and what should our expectations be for yield monitor accuracy and and it's important when we talk about accuracy to be talking about
or being thoughtful of scale that of the uh of the accuracy at a field scale if we're looking at comparing the the total yield of a field to uh way tickets now we should be or certainly have the capacity to be within one to two percent of of accuracy or one one to two percent of total bushels from the yield monitor versus what we get from away ticket at a at a field level that's very realistic in today's with today's technology as we go to a smaller scale if we maybe look at like a grain
cart for example or a single semi load we're going to have a little less accuracy but again i would say that we should expect our yield monitors today to be within five percent of what you would get with a uh weighing a semi over over a set of scales so so we have really strong performance in that space and although yield monitors can and often are highly accurate the level of accuracy is driven by the the quality and the frequency of which we calibrate and how we maintain that calibration quality over the course of the
of the season and that's particularly important as our crop conditions change so what are some goals uh related to yield data analysis and why are we talking about this today if this this technology's been around for 25 years why are why why is it still a topic of interest first of all when we think about the goal of yield monitoring right the goal is to translate machine collected data into actionable insight right it's that that insight actionable insight is really key uh this has been the the holy grail of precision ag since the introduction of
yield monitors and in the early 1990s to help us manage our spatial characteristics of fields more productively or more economically efficient there's usually a multi-step process in working with yield data right number one is we have to collect high quality data we have to have good data to begin with that data usually requires some level of cleaning to correct for artifacts or or deal with maybe some some erroneous data that's creeped into the system and then finally we want to relate that back to our other management factors so again as an example on the right
we've got a a yield map that was from a field that was planted with two different varieties or hybrids in a side-by-side trial and on the north side of that field you can see some stripes of green and some stripes of red and if we uh analyze the yield from the field on a bi-hybrid basis we can draw out analytics that that are able to document and show us the type of uh impact that that hybrid selection has in that field on that year right those types of insights are what helps us to drive better
decision making over the course of of a crop production system and again although we don't usually hit a home run on the on the first at bat here with data it's the continuous use and investment and data that allows us to grow and evolve over time and improve our management decisions so this has been the same for quite some time so what's changing or why are we why are we where are we bringing up data analysis in a deeper way today and there's really a couple things that's changing or evolving within the within the data
marketplace first is there's a strong trend towards more cloud-based data systems or cloud-based analysis systems for yield data if you think back 10 15 years ago the primary method that we worked with yield data was extracting that data with a memory stick of some sort an old style compact flash card or a usb stick and somebody on a desktop computer had to analyze and and clean and process that data in order to drive insight today through really strong advancements in information integration and vehicles we have a lot of systems now that that simply automatically port
yield data via cellular or wi-fi connection up to a cloud or a website solution which has been a tremendous value for producers right this helps to eliminate the need to manually transfer data eliminate some of the headaches that come along with that process and allow us to more effectively automate the the data process the analysis process the downside of course is if you know as strong as all that automation has been it has removed some of the the touch points in the system where you have you know humans that do provide some oversight to to
data quality and so data quality issues or in questions about data quality are as much of a concern today as they were a decade ago the other aspect that's that's changing in the um in the in the data analysis space is that the resolution of our of our implements is getting better and better and so you know it wasn't too many years ago when we would think about a a planter you know being able to change uh rates on the fly across the field and maybe it takes you know five or ten seconds for that
rate change to happen but our entire planner could change rates right uh today we have scenarios where individual rows on a planner can change rates almost instantaneously and so we've we have some some considerations need to go into how we deal with this data when we have very high frequency changes or or fast changes of information across the field so let's get started and talk through a number of tips to watch out for again whether you're you're looking at yield data for right now from the past season or you're thinking about how to plan ahead
in yield data analysis for next year hopefully all these tips help provide some insight into some best practices number one tip is is to watch for crop property changes that occur across the across the year in the midwest if we think about a traditional corn soybean scenario our single biggest driver to the need to calibrate a combine is crop shifts crop moisture shifts in corn in particular with corn as the as the moisture content of the crop changes over the course of the season the accuracy of the yield monitor will also change and this is
particularly important for high moisture corn we've studied this topic extensively at iowa state the the graphic that's up on the right is the uh the culmination of a a about 500 individual grain cart loads that were tracked across an entire season looking at at uh accuracy characteristics of yield monitors in a in a normal calibration process uh relative to the to the moisture content of that crop um in this case we started the year in a field that was about uh 20 moisture corn and if you if you look at twenty percent on the on
the x axis of the graph you'll notice that's about zero percent yield error and that's what we would expect when we calibrate a yield molar we should have zero percent error after that point we simply let the combine go for the rest of the year and uh shortly after that first field we got into some higher moisture conditions all the way up into 25 26 percent corn and what you notice is that as the the moisture increases above 20 percent in in corn grain moisture we have an increasing amount of of yield monitor air and
this is very very indicative of what a typical impact plate based yield monitor system would would would respond to when we're below 20 we really don't have much change i mean the yield monitors are are typically very stable and the data quality is very good or less than 20 percent so why is this important and why should you be cognizant of this if you're starting to look at or analyze yield data well first and foremost if you're trying to compare hybrid performance or crop management differences across two fields and you have differences in the moisture
content of those grains and you didn't calibrate in each individual field you're likely going to create some bias or add bias into the system we know that uh calibrations take time uh they're not uh they're not they're not easy to do and and many producers don't even have you know may not have the infrastructure to do these in a in inside of a field um and so you know knowing that it's important to be thoughtful and and take into consideration uh if there are significant moisture differences in the crop you may not simply be able
to to trust the yield comparison is strongly across multiple fields and you know the worst the worst thing you can do is to make an inappropriate decision or a bad decision on a hybrid simply because it's being biased by uh by moisture content this also gets tough if you're in a situation where you're harvesting a side-by-side trial or you might have two different hybrids that you planted in the same field and one hybrid is you know hybrid a is uh at 20 hybrid b is at 22 well just that extra two percent of moisture in
this high moisture range is going to add a sort of a ghost increase of five percent yield increase in that higher moisture crop and again that's something you have to have to be cognizant of or aware of to make sure that that those moisture shifts don't creep into your decision-making process now moisture is not the only thing that affects yield data quality certainly your harvest speed and i'll talk about that a little bit more today test weight surface moisture of dew for example on soybeans when they get tough at night this can all induce different
different errors into a yield monitoring system but by far the crop moisture shift again particularly in corn is the uh the key driver to requiring calibration and and we should be cognizant of that we're looking at yield data analysis so the next tip is to is to be leery of data that might have come from any crop damaged fields and you know this is a very unfortunate topic particularly this year in in iowa where we had you know millions of acres that were impacted by the derecha events that that happened in uh in august of
2020 when we calibrate a yield monitor we're calibrating that yield monitor for a for a certain flow rate or a certain amount of grain flow through the combine and when we get into damaged crops and we start to have large swings and maybe harvest speed we have to slow down quite a bit or fighting material getting into the header all of those factors are going to induce errors into our yield data which is going to make it difficult to use in any sort of analysis additionally if you think about the use of yield data in
a multi-year analysis or why we would want to include yield data multi-year analysis that's all about predicting the future right trying to project our yield information our yield performance to predict what might happen in the future and and we simply don't want you know heavily damaged crop information to to uh to creep into that system so you know it's a it's a best practice if you've got fields that have uh you know significant areas that have that have been either hailed or uh or have significant wind damage that you really need to think about removing
those from your yield data analysis to make sure they don't bias your results to kind of go a little deeper into that we did a trial a few years ago so this was not from the you know not a dorito impacted field this happened a few years ago where we were in specific tests to look at what happened when we had drastic changes in combine speed in order to you know assess that impact on the yield map right simulating that that that effect that you would get with with down crop on the right side of
the screen here you've got a a map that shows uh multiple red streaks where we intentionally reduce the combine speed to about a third of our normal speed 25 to 30 percent of our normal speed which is uh you know down to about one mile per hour and if you take a look at how those lines of where we had particularly slow harvest speeds match up with the yield map on the right on on the left excuse me you'll see there's basically a one-to-one correlation that everywhere we see a red line that was a low
harvest speed we also see a red line that was a low yield okay and again in this case this corn was all standing this was we just intentionally slowed the machine down this this indicates the type of yield response or data quality issues you will see if you have really slow harvest fee speeds that are outside of the normal calibration range for that combine this data should be filtered out before this information is analyzed or before you start to compare these these yield points back to other treatments and most gis systems will allow you to
do this simply by filtering out data for specific parameters like in this case the uh the harvest speed the other thing to be leery about as you think about dealing with crop damage fields from this year and also preparing yourself for next year is i would really encourage you if you were in uh that in this you know millions of acres that were doricho impacted and and uh um and dealt with down corn or tangled soybeans you know you've likely pulled a lot more dirt and other debris through your combine than you ever have in
the past the photo that's shown here was was shared with me by a producer out in near cedar rapids iowa that ruined an entire impact plate this is the plastic face on on the front of a yield sensor in the combine and completely wore through that material due to the increased amount of dirt and abrasive material that was processed through the machine if you haven't started your your combine maintenance or if you haven't put your combine away for the year i'd really encourage you to jump up and take a look at how does your yield
sensor look and how do the other components of the the clean grain system look dirt is extremely abrasive and problematic for for many materials that you find on on a combine in particular the kind of plastics that are used in in many sensing applications once this happens once you wear through these uh plastic faces on yield sensors they're essentially useless right they're essentially worthless in terms of data capacity and not only will be an indication of of the reason for poor data this year but if aren't correct corrected you'll you'll have more years of problems
behind you number three is to be thoughtful of correcting your crop flow delays within your combine you know on average it takes about 13 seconds for grain to get from the head of the combine back to the mass flow sensor the combine itself is going to average quite a bit of grain together in order to uh to produce that single yield data point that we see on the yield map when we when we visualize yield data we often do it in a in either a point data or a rectangular form and the the size of
that rectangle we normally show as the distance the combine traveled within a single second and then the width of the the header that's that's involved the reality is that it's never really we're never really measuring a rectangle in the field we're actually measuring more of a chevron type shape that is uh and the specific shape of that is based on the the speed of the vehicle when you have a a corn or soybean head that has to auger or or use a draper belt to move material from the outside of that head into the center
of the machine to be processed you will naturally create delays from your outside rows getting to the center of the header to the feeder house if you've got a a 40-foot head if you're talking about like a 40-foot draper head on soybeans or or a 16-row corn head you'll find that at a two-and-a-half mile an hour ground speed you've covered 19 feet or you have crop from 19 feet of travel distance merged into that single point even before you've reached the point where your your combine itself is filtering the data as you speed up if
you get up to four and a half miles an hour that number increases to almost 35 feet and this is substantial when we think about the size of an area that we can correlate back to a single yield zone or a spatial feature in the field now cropped crop flow delay is relatively easy to correct in software and most uh commercial you know yield data systems has the ability to to make adjustments in this space it is it does require some tuning based on the individual combine and the crop that you're harvesting so if you
switch from corn to soybeans the same combine the crop flow times or flow delays may be different when this is set wrong a couple things will happen first of all you end up getting some some clear striping that happens in the field where where your your spatial features no longer match up to each other very well that causes noise which is difficult to interpret or makes the yield data more difficult to interpret at the when you're doing your analysis but even more importantly when you start to analyze that against you know input layers or treatment
zones from from a herbicide trial or fungicide trial or seed trial whatever it may be that noise is going to skew your results and this is an easily correctable factor i've got an example to show of of two fields side by side we've got corn on the left soybeans on the right although i show two fields here these two fields are actually side by side each other and actually north and south and so they share a fence rail right um they were both harvested with the exact same combine obviously uh once set up as corn
and and then also set up as soybeans if we look at the corn map we'll find that the spatial features in that are are actually very crisp and appear very clean when we see you know whether it's uh the areas that are this is a wet year so we have some drowned out areas we also see some depressional areas that we have you know lower yielding zones but the edges are crisp it all lines up fairly effect fairly cleanly in the soybean map everything looks more jagged the headlands have more jaggedness or or or color
variation if we look at some of the what appears to be water features or sort of some depressional landscapes in the field that are lower yielding they're just noisy it's not consistently lined up it's not um fluid in the way that we can visualize that data that's a hundred percent based on a simple correction to crop flow delay uh to improve that data set and if we're going to use this for analytics you know it's it's important to make these adjustments so that we have data that looks like the map on the left rather than
the map on the right because without that we're not going to to really achieve the maximum data quality that we would be after number four is to uh to avoid or be thoughtful of the size of an area that we're that we're considering when we uh perform a treatment analysis within a field uh this is one of the more common questions that i've received over the last few years when when when talking to folks about yield data analysis is is how small of an area can i really trust in a yield map i've got three
zones that are that are circled in the yield map that's shown on the screen currently one of them large one of them medium and one of them very small right and the question is you know if my planter can respond on a row by row basis or very quickly at a row by row level you know what's what's the rest of this take what can my combine respond to the same speed can i get you know high quality analytics to tell me my yield potential in those uh different areas and and the reality is although
implements have gotten more precise with higher resolution over time our trend in combines is the opposite direction our combine yield monitoring is matched up in dimensions to the width of the head and if you if you look over the last uh two and a half decades since uh since the yield monitor was introduced almost three decades of course the the size of combines has trended up right folks that probably used a six-row head when the first yield monitor came out are now using an eight-row head or maybe a 12-row head right and so we're actually
losing resolution at that uh at that scale we did some trials here in iowa as well as at a in cooperation with uh with a uh with ohio state university in ohio this year as well specifically experimenting with the um the relationship between size of plots or treatments that we can install and the minimal minimum detectable yield within those treatments and we set a field trial up that was a large scale field trial using production scale equipment that controlled the amount of nitrogen and corn right and we would expect that if we have large differences
in nitrogen we should see some measurable detectable differences in yield we laid the trial out in in the i'll explain the colors first the the green colors in these in this map is our full rate of nitrogen it received 50 pounds per acre pre-plant we then side dressed it with 150 pounds of nitrogen for a total nitrogen level of of 200 pounds per acre and this was a continuous corn field the red areas also received 50 pounds of nitrogen up front but received no side dress application so essentially between the red and the green you've
got the red with 50 pounds of total n and the green of 200 pounds of total n and so we should expect with that strong of a difference in in nitrogen we should fully expect that we'll see a yield difference between those zones so then we went in and and changed the frequency at which we adjusted those rates we started with 12 and a half foot blocks so this is a 30 foot wide treatment and we used a side dress applicator that had pulse width modulation nozzles and we were able to during side dress every
12 and a half feet turn that applicator on and off on and off in order to create that pattern throughout the field the next 30 rows we doubled it we went to 25 foot increments then we doubled it again and went to 50 and then 100 200 all the way up to 400 foot increments and of course at 400 feet we should expect that we definitely should be able to measure those differences with the combine and we're really questioning is how small can we make these zones and still measure detectable differences in a scenario where
the where we we have a treatment that's that's a big enough difference that we should definitely see a yield response i've got a few arrow images from that field and and this was a field in uh in story county uh iowa so um it was uh damaged by the by the doricho event but fortunately for this trial at least was uh was still standing and uh so although we had some some goose necking and and uh some bending of plants we were able to still uh complete an effect complete harvest or complete this trial and
uh with the three arrow images here you can see that the patterns that were created that sort of document the the uh um the the the the response that we achieved and uh you know if you if you look at those green areas of crop that's where we had the uh the 200 pounds of nitrogen and in the areas that are yellow or nitrogen stressed right we've got a we've got 50 pounds of nitrogen so we would certainly expect to uh have a yield a measurable yield loss in those regions so with our combine and
again these plots were set up on 30 feet and so we lined our 12 row combine up and simply harvested straight across the field and harvested directly through these different treatments hoping that we could detect the differences by analyzing the yield data for each strip and comparing the yield of the 200 pounds versus the yield of 150 pounds of nitrogen for each of the individual strips let's take a look at the data if we start with the the the 12 and a half foot plot length strips this data is presented as the yield difference between
the um no side dress versus the the full rate of side dress and so at 12 and a half um feet of plot length we have an average yield difference of zero there was no detectable difference in the crop stress or nitrogen stress that occurred at that point at 25 feet we have a very similar result at 50 feet we barely have a statistically non-zero result and that's still only about eight bushels per acre difference as we get out to 100 200 and then and then 400 you can see where we start to settle out
at about 30 bushels per acre of uh of a yield difference and that number is you know would make sense given that the the top end of yield potential was already taken off this field both through through the droughtiness that experienced throughout the season and then the the doricho event on top of that so what's this data tell us right um you know the first question is did we really not have a yield response difference at at the at the 12 or the 25 or the 50 foot uh plot lengths right and the reality is
if we look at the arrow imagery it would suggest that we had just as much crop stress in those areas as we did in the 200 and 400 foot areas that had no side dress applied right so this is telling us that when we have particularly small plot lengths or small features that we're trying to measure in a field that the amount of averaging and co-mingling of grain throughout the combine as it's processing is simply limiting its ability to accurately distinguish or detect differences in crop yield and so you know we need to be thoughtful
of this or be thoughtful that if we're trying to compare differences in a field it's important to make sure we've got plot lengths that are sufficiently long enough to get high quality yield data to make those comparisons this not only applies to a situation we're trying to switch treatments along the length of a field it would also apply to you know things like uh hybrid trials that might only be you know 300 400 feet in length but we may also be harvesting those slower because of the the nature of of plot harvesting or we may
only be taking a half width of the combine in those trials and all of those factors can can affect our ability to to accurately measure these detectable differences if you look at this data in a different way this is a a graph of the same data but graph a little differently so in this case i've normalized the yield so you know this field averaged about 180 bushels per acre so the 100 percent is essentially 180 bushels and then it kind of spreads from there right and this is really interesting right if you look at the
the the two bars on the very right at the 400 foot plot lengths we see a noticeable difference in the yield of the gray bar which is where we had the full cider side dress application versus the yield in the uh in the green bar right so we're detecting the differences from those plots in the yield data right notice how as we go from right to left as you go from 400 down to 12 and a half feet that the yield of the zero applied area increases and and when you get to the 12 and
a half feet there's i mean they're just the same right there's no distinguishable difference between the uh um between the the the five and the and the or sorry the zero applied and the 150 applied rate and and this is totally indicative of the amount of of co-mingling again and mixing of grain that happens in the combine so you know we can relate this not only to to field trials but also to spatial features so if we're trying to measure actual differences on the very top of a hill or a small landscape position where you
know it's only 50 feet wide or 100 feet wide we'd be really careful about inferring too much from yield data in those conditions because our yield maps just aren't our yield technology just isn't great at being able to distinguish those differences precisely there's some implications here on field trial design too that we should be thoughtful of with with field trials we usually think about two different ways to do that we can use experimental strips or or maybe learning learning strips replicated strips across the field or we could use experimental blocks and for me i think
the my recommendation is if possible definitely start with experimental strips across the field when you do replicated strip trials side-by-side strips across the field you really eliminate this this issue of the the combine being able to switch and accurately measure yield between two different types of treatments now this isn't perfect though because if you're in a situation where for example soybeans and you might have a soybean trial that is planted in at a single one heading angle and you normally harvest your soybeans at a slight offset angle in order to uh to improve header feeding
and harvest efficiency then then we have no ability right to to accurately measure yield in those in those trials um you know if you harvest across strip trials instead of with the rows you're you're never going to be able to get high quality data because of the mixing that'll happen in those replicated strips that's where the block approach is really preferred and and there are many many great examples of this but but soybeans would be the common example where you know if you're if you're going to harvest an angle you really need to be using
block trials in order to to validate those results now within the block trials i still recommend as a starting point i always tell folks to to start with a minimum block size of two acres to really help eliminate issues with uh potential combine uh data quality or data biasing uh you can go less if you have experience and really know how to set these up so you know i think we're we're very supportive of folks that are doing this down to about a about an acre in size but only if you've got experience and have
the ability to to to maximize the the potential based on on the logistics and how you organize the trials uh tip number five is is uh balancing exploration and experimentation these are really two different things right and i think uh you know when we talk about you know scientific outcomes at uh in iowa state you know we're usually focused on replicated trials right replicated in in treatments as well as replicated in sites and and that's experimentation right that's where we're going to conduct true replicated trials across the field exploration i think is equally important when
we talk about value of data though that's where you might try you know some new management practice just to get experience with it right just to get experience or start to gain some of those key insights and i'm really supportive of folks you know looking at both sides of this where i caution and recommend though is to make sure that if you're truly planning to make strategic decisions with your farm based on information from from harvest make sure that information is is grounded in replicated experiments make sure you've got duplication your data and repeatability in
your data so that so you can make that landmark decision to switch your practices and be confident with those uh with those results and yield data can support this the the image on the right shows uh about a 50-acre replicated strip trial with different nitrogen rates um that that a cooperator completed in order to uh uh help dial in what the right rate for their farm was and just learn more about you know where their you know optimal point was both in terms of economics and with uh um um and with yield potential a few
comments as you're thinking about setting up these replicated field trials for next year first of all keep them simple it's you know the simpler you can make a field trial the better i like to tell people think about asking yes no questions right uh is is seed a versus better than seed b is tillage depth a better than tillage depth b right um you know try to avoid situations where you plant you know multiple different different test treatments and you have to uh and parse each of those out from the from the field i really
encourage replication across the landscape the the image is shown here is an example of a of of a test trial that we've run a number of times which is changing soybean seeding rates across the field and so essentially the entire 180 acre field here has been replicated in trials where half the field is is yellow and that's our base rate and then we have [Music] four other um treatments that are gone that go into this field and allow us to uh parse out the yield differences between those so the replication is really important it helps
to make sure you're covering different landscape positions it helps make sure that if you have you know a pond or or an area that gets really dry or burns up that that spot is not going to isolate or otherwise negatively impact your ability to to draw results right replication will take care of that think about logistics as well early on in the process it's it's important to be thinking of how you'll harvest it to make sure it gets planted in the correct way now i mentioned this was a soybean trial that we that we have
on the graph here and and you know we know we plant our logistics that if we're going to do a soybean yield trial we need to harvest that field with the rows instead of at an angle and those logistics you want to be thoughtful of early on in the process to make sure that that all is taken care of and finally ask for help right whether it be your local extension professionals or others in ag retail that you work with there's a lot of folks that can help make sure you get these set up in
a way that does result in high quality data so to wrap up i want to just leave you with a few final comments right first of all yield data is certainly can be highly valued and is one of the best ways to improve your crop production management and the decisions that you put into your production system i hope the tips here are are things that are noteworthy and can and can help you make great decisions from your yield data yield data does have what we call a strong treadmill effect right meaning that you have to
work out it all year it's not just something that you know you do once and then and then and then walk away from you really have to be in a mindset that it's it takes strong planning ahead of the season uh great execution in the spring and then the time and focus to get quality yield data throughout the fall in order to unlock that actionable insight and uh when i when i when i talk to folks that that that you know might might have a lot of history of yield data but haven't been able to
unlock a lot of action from it it's usually driven by the fact they're not thinking about that you know year round and thinking about what can they do in the spring to set them up for high quality analytics in the in the fall that can make their decision next year or the year after easier and then finally fortunately there's going to be more and more data automation coming right the trend that we see today with with uh cloud-based connections to to yield data automated analysis that's that has real advantages to us within agriculture but it
also has i would say maybe even an amplified challenge of dealing with data quality and it's it's it's super important for us to to be thoughtful of that um with with automation systems uh it's just simply more difficult to catch all those uh issues with data quality and uh the more we can eliminate them up front uh the the more powerful and more useful our analytics will be you