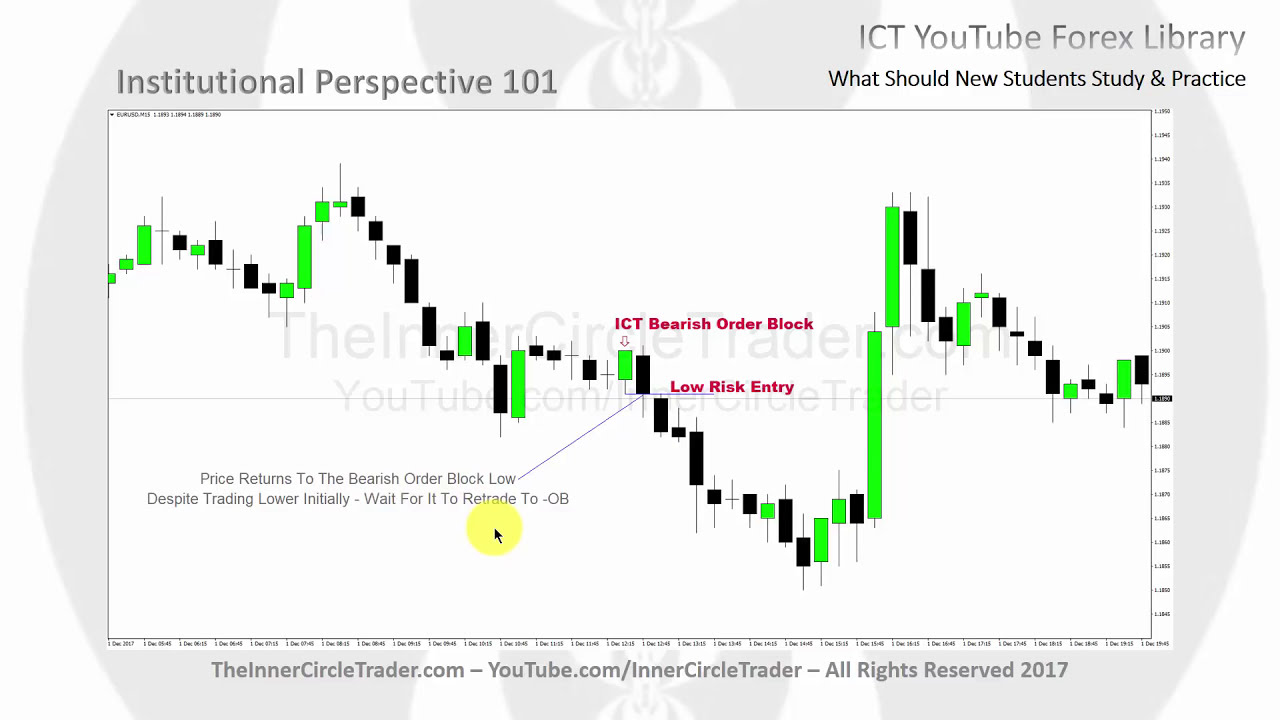
welcome back folks this teaching will deal with target selection and profit objectives ok target selection and profit objectives the points of focus in this module will be measuring bullish weekly targets where to anticipate weekly highs to form measuring bearish weekly targets where to anticipate weekly lows to form ok folks look at the examples I've just shown in the previous teaching the weekly bias and we're going to assume again that our analysis led to a bullish analysis for this week under study here and before we even consider running target measurements from the intraday price action each
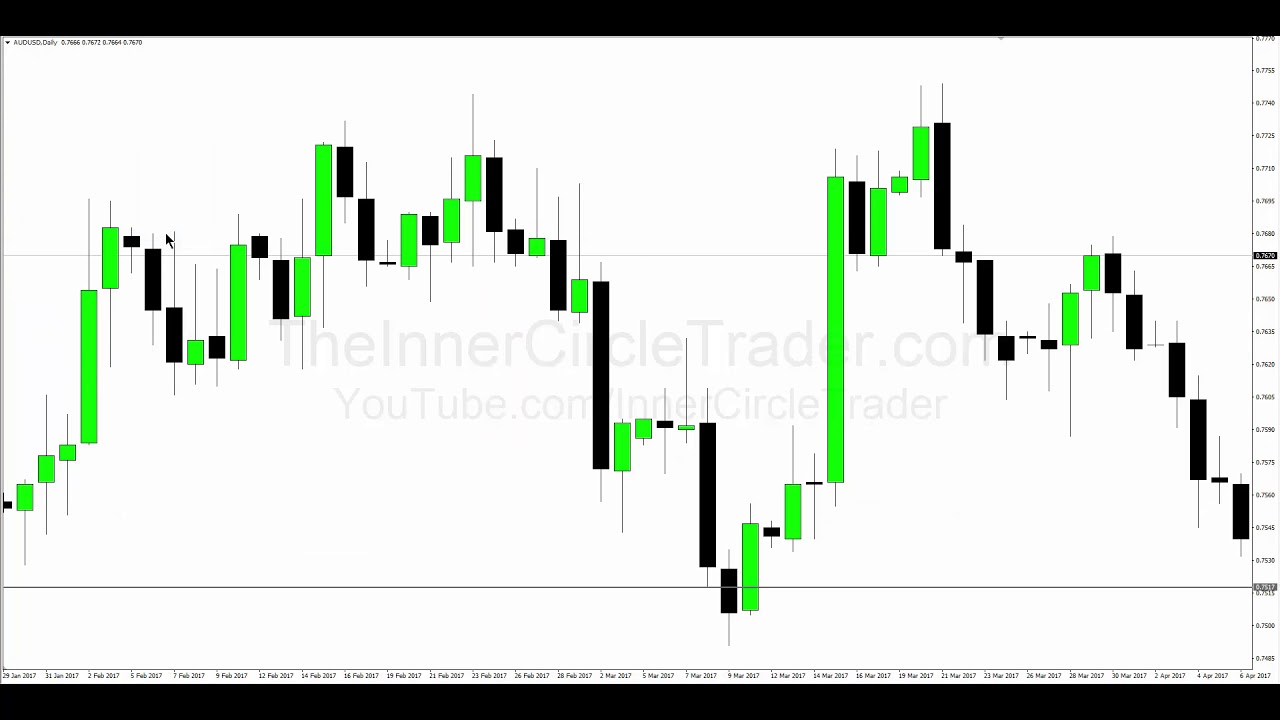
day we have to have a premise in mind that sets the tone for this market to be bullish ahead of the weekly beginning or Sunday's opening so we're going to scrub over to the left of our price action here you can see we have the impulse leg here to the high so we're going to run our fit on that using the lowest body open or close to the highest open body or closed right there okay now we're going to put some horizontal lines in because these are objectives that could happen going into the new week
because as the market was closing here it started trading on Sunday declined Monday and then Tuesday creating a beautiful hit on the 70.5 level profitable trade entry and we're going to put it on target 1 and I'm going to put it on target 2 up here and I'm gonna put one more at symmetrical price swing so these will be our objectives relative to this price swing okay since we're trading with a longer term idea in mind we want to be looking for the move beyond this swing high to what levels that may reach 4 ok
so it started one target two and then symmetrical price swing so at that we're going to take the fib off and now we can go back zoomed in and look at some of the measurements we're going to do one individual days now these levels will be in my mind going forward based on the previous swing ok so then we have a chart back the way it was before looking at those projections now we have Sundays opening here market drops down again alright mention in a weekly bias video I'm not really concerned about Mondays trading I
want to see if I'm bullish a move moving lower on Tuesday so now we can take a look at some of the measurements in addition to and see which ones line up said the bulk of what I'm gonna teach you here is an overlapping or confluence of Fibonacci levels in the form of extensions ok so right away we have this high back here that price has been moving lower what I want to do is incorporate that with a projection from that low gear on Tuesday up to the highest body open or close here and it's
actually a little bit area right there so I'm looking at the body to body in this price swing why am i measuring this because what I'm looking for is the movement lower to pick up by orders and once this high is taken out how far up will we reach into in terms of price objectives okay so and now I start looking for overlaps we're kind of close with this target to to this one but not that close but then we have this level here this is where a little bit of thoughts gonna have to come
in because on a larger price when we did when we scrubbed over to the left side of the chart and we drew those horizontal lines across we have one target here and then another target here but look what happens right in the middle of that we have this level here to target to lies directly right in the middle of that so that's like an equilibrium concept right away I see that that draws my attention so I'm going to draw now another horizontal line here and I'm going to change the color of this one to delineate
why I'm drawing it so this is all gonna be based on this price swing and everything to the right of it and you'll see what I mean as I go so now I want to take another measurement of this open or close highest one in this swing keep it anchored to here and see if there's any measurement up here that has a confluence again this one's a little too far away but look how far away we are here to want to just did on an equilibrium so right away this is another confluence now how far
away would I be willing to allow price to move about 10 to 15 pips depending upon the type of market structure there is but anything more than 15 pips I'm not really willing to let that be deemed a confluence if it can be less than 10 pips it's even better in this instance we have 1928 1924 so we're less than 5 pips real close okay and I'll tell you how we can pick a specific level in mind once I go through all the possible swings all right so we're looking at not this level here and
reason why I'm not going to use this price swing is because we have this low and this low here and then we drop down something like I'm not concerned about this one okay so I'm not interested in this swing at all this swing is the parent price swing this is a subordinate price swing within the overall swing from this low to this high so even though we traded down came back up it really was a new significance so this low to this high is much more significant now we can start looking at smaller price swings
and the optimal trade entry here okay so we have the lowest open or closed up to the highest open or closed in this price swing price comes down hits to 62% trades on level optimal trade entry and we start looking for extensions okay we have the 300 extension within again less than 15 pips so now we have another confluence right there and now I'm going to measure every price swing that moves slower so every price swing down I'm gonna measure that so it's this one here it's going down picking up orders why am I looking
for that because I'm looking for the expansion up the up side now watch look what happens now we start seeing an overlap here so we have one confluence here at that level and we also have another one right here but to 500% okay so you can already start seeing the grouping that's occurring right here this little price swing here why is this significant because it comes down and takes out an area of short term law works but this is catching my eye this would have caught my if we started breaking higher right away I'd be
looking for the highest by the close which I the highest and lowest open or close relative to each swing high and low here and I'd look for another extension and we don't need to draw another one because it's right on here that's 200 extension okay and there's no other cut there's really not confluence to need to be drawn here so we can see that there's room to justify this level here this would be a target but we have a lot of grouping ray up in this area here so now what I'm gonna do is I'm
gonna take that and just highlight it now I don't draw these boxes on here or these rectangles when I'm doing this I look for just the levels and I can start keeping an eye on where they're starting the group now once we have an area where they start to converge here and then over here right away we're below that price level as we're coming up so this is going to be a nice objective to reach for which is basically the 119 big figure because if you won 1898 you can go to more pips just with
just a spread or chaotic price action would take us right up into that 119 big figure if that trades through then we'd be looking for an area in here we're all these overlaps starts to take place I'm going to take all of the horizontal lines off to make a little bit cleaner and we can see that the lowest point at that level started was 1 1924 and then we have the highest point comes in at 1 1935 so you're stuck with the decision rather to go with what level are we looking for and here's your
choices you can be conservative and get out at the 20 institutional level right before all those confluences agreed you can get 1 1925 you can get out 1 1930 round number or you can hold for one 1935 because their 5 levels 0 levels and obviously the one 1920s institutional level waiting for the confluence of target 2 so this just started to one that price wing we had relative to this swing here so all I'm doing is measuring all lots of possible overlaps of the Fibonacci and looking for an agreement on a specific area then I'm
either picking a 5 level or a zero level the close I can get to an institutional level the better truth be told one 1920 would be my level and I'd look for that only and I would miss out on all the remaining portion of the move and we're going to do similar things here so we have again a sell idea so we're looking for where is going to be the object that we would reach for for covering our short positions if we have a bearish week in mind what type of things would we look for
for overlapping for target selection and profit objectives well we're going to looking for movement up is meant to be gathering cell entries to go short so we want to be focusing on that now I'll draw our up and first and foremost I like this swing here and we also have an equal load down here so right away I'm already thinking if we're bearish on the week and we're lucky enough to get in here and get short on Tuesday if this occurs my mind is thinking 20 30 pips below this level they're equal lows they're probably
gonna want to reach for that and we'll come to that in a minute but for now we're going to look at the overall price swing right there so we have an initial confluence put target 1 or net parent price swing here so again the idea is it starts here it runs higher they sell it sell more they sell more finally price in the weekly high and it starts to break down we want to see this low broken but how far will it go it can go to target one or target two and just to save
time we won't add that symmetrical price point but you would add it and you would look for other confluences but we had the benefit of hindsight here so we'll stick with that just for the purpose of keeping the video short and you'll see that there's confluences that line up with this one here a lot so let me keep both of them and train ok so now we can take every price swing - now I don't like this one because it was part of a consolidation and we basically came back into that same area so I
want to look at the lowest open or close here - this open or closed and the swing high up here and right away we can see another symmetrical price swing overlapping so this is what I'm saying it takes a little bit of work and thinking to figure out which level you're going to be aiming for and now we can start doing Fibonacci extensions on the optimal trade entries so we have three on an extension down here so we can look for that level right there and we have another optimal trade entry going to use the
bodies of the candle Bost body candle here and highest open or closed on this swing here I'll trade entry cell on Wednesday leaving the opening on the week start to expand then we have 200 extension down here right there and we're a little too far away in my opinion for this one so I'll line up so again all the groupings still around this level here and we're also gonna look at this swing right there to here so we're looking at the overall price swing from this high down to this low right here's what I'm measuring
why am i doing that because that's the biggest dynamic price move so I want to see if this is gonna be replicated and we get that same measurement to measure move idea from this high to this low using the bodies this is the bulk of the volume and then projecting it down again would take us right to here so we have an overlap there as well okay so we can see a tight grouping around here so we're gonna leave no interest with this one here because it's a lot of overlap here so we're gonna shade
in again this area here this is going to be the bulk of our interest and we're going to delete all the other horizontal lines we'll just leave one for target selection purposes okay so the top of that shaded area where the upper most overlap occurred comes in essentially at 120 689 the lower one comes in at 26 81 so we have a range of 8 pips not bad so we can look to take our profit again we're songs short this week in theory so we're looking at 120 689 so above that would be what 120
690 round number or 120 695 which is what I would look I would look to get there because the lowest portion of that range was down here so if it's gonna reach as far as that by our overlapping fibs that means 126 81 could be the low but then you have to factor in the spread dollar cad so you may end up getting you know 2685 that would be r and that's the best case scenario okay so 2685 may get you out if it trades at 2681 you think it's going there you want to cover
you got to add your spread to that so we'll say 2685 would be r your limit to get out i want to be out before that i want to be out of 26 95 I want to be just a little bit ahead of all those overlapping fields because I want to make sure I get my price so I'll always leave a little bit on that's why I see most of my exits I always have that little bit of a tail and move left I just want to be out I don't want to be in there
you're demanding I get to very lowest low I can call that and make that public and look like a rock star but I am hardly ever really in news moves ollie to the end because I don't trust them and think about what we're dealing with here but dealing with Fibonacci okay and we're also looking at a variants between everyone's delivery on the price everyone's price is gonna be slightly different and it's the reason why I teach you to use the bulk of the volume with the bodies of the candle and not the wicks the wicks
are always going to be slightly off relative to your brokers okay and there's a lot more to this that I can teach you by way of the mentorship but this is certainly well enough for those individuals that can't afford to be part of the mentorship I just don't have it in mind to ever want to do it that's fine that's cool I'm not twisting your arm but I've given you enough here to find reasons to suspect a highly probable target for weekly objectives until next time wish you good luck and good trading hopefully you enjoyed
this presentation if you like to find more you can visit my website at the inner circle trader.com