the world we live in is awash with data that comes pouring in from everywhere around us on its own this data is just noise and confusion to make sense of data to find the meaning in it we need the powerful branch of science statistics believe me there's nothing boring about statistics especially not today when we can make the data thing with statistics we can really make sense of the world and there is more with statistics the data deluge as it's being called is leading us to an ever greater understanding with life on Earth and the
universe beyond and thanks to the incredible power of today's computers it may fundamentally transform the process of scientific discovery did you know that Dick's is now the sexiest subject around did you know that there is 1 million boats in Sweden that's one vote for nine people it's the highest number of votes per person in Europe being a statistician you don't like telling your profession at dinner parties but really statistician shouldn't be shy because everyone wants to understand what's going on and statistics gives us a perspective on the world we live in but we can't get
in any other way statistics tells us one of the things we think and believe are actually true and statistics are far more useful than we usually like to admit in the last recession there was this famous call into talk radio station the man complain in times like this when unemployment rates are up to 13% and income has fallen by 5% and suicide rates are climbing I get so angry that the government is wasting money on things like collection of Statistics I'm not officially a statistician strictly speaking my field is global health but I got really
obsessed with stats when I realized how much people in Sweden just don't know about the rest of the world undergraduate course called global health these students coming to us actually have the highest grade you can get in Swedish college system so I thought maybe they know everything I'm going to teach them about so I did the pretest when they came and one of the question from which I learned a lot was this one which country has the highest child mortality of these five pairs I won't put you to test there but it's Turkey which is
high as there Poland Russia Pakistan and South Africa and these were the results of the Swedish students at one point eight right answer out of five possible that means that there was a place for a professor of international health and for my course but one late night when I was compiling the report I really realized my discovery I have shown that Swedish top students know statistically significantly less about the world than the chimpanzees because the chimpanzee would score half right if I gave him two bananas with Lanka and Turkey they would be right half of
the cases but the students are not that I did also an unethical study of the professors of the Carnegie Institute that hands out the Nobel Prize in medicine and they are on par with the chimpanzee rare today there is more information accessible than ever before and I work with my team at the Gapminder foundation using new tools that help everyone make sense of the changing world we draw on the masses of data that's now freely available from international institutions like the UN and the World Bank and it's become my mission to share the insights from
this data with anyone who listen and to reveal how statistics is nothing to be frightened of view of the global health situation across mankind and I'm going to do that in a hopefully enjoyable way so relax so we did the software which displays it like this every bubble here is a concrete this is China and this is India the size of the bubble is the population and I go to state your race here between this sort of yellowish afford here and the red to your third on there and the brownish ball four very bad start
down here and United States Ford is going offroad then and the boat was doing quite fine this is the war to tie off the got off track in outer office coming on the healthier side of sweet and that's about where I saw the world when both the Toyota this was a great leap forward when China fell down it's a central planning by moxie to China recovered then they said never more stupid central planning but they went up here no there was one more inequity look there United States or they broke my frame Washington DC is
so rich over there but they are not as healthy as Kerala in India it's quite interesting isn't it welcome to the USA world leaders in big cars and free data there are many here who share my vision of making public data accessible and useful for everyone the city of San Francisco is in the lead opening up its data on everything even the Police Department is releasing all its crime reports this official crime data has been turned into a wonderful interactive map by two of the city's computer whizzes it's community statistics in action crime spotting is
a map of crime reports from the San Francisco Police Department showing you no dots on maps for citizens to be able to see patterns of crime around their neighborhoods in San Francisco the map is not just about individual crimes but about broader patterns that show you where crime is clustered around the city which areas have high crime in which areas have relatively low crime we're here at the top of Jones Street on Nob Hill quite a nice neighborhood what the crime Maps show us is the relationship between topography and crime basically the higher up the
hill the less crime there is cross over the border into the flats essentially as soon as you get into the kind of lower lying areas of Jones Street the crime just skyrockets so we're here in the uptown tenderloin district it's one of the oldest and the densest neighborhoods in San Francisco this is where you go to buy drugs right around here we see lots of aggravated assaults lots of all the thefts basically the huge part of the crime that happens in the city happens just right in this five or six block radius if you've been
hearing police sirens in your neighborhood you can use the map to find out why if you're out at night in an unfamiliar part of town you can check the map for streets to avoid if a neighbor gets burgled you can see is it the one off or has there been a spike in local crime if you commute through a neighborhood and you're worried about its safety the fact that we have the ability to turn off all the nighttime and middle of the day crimes and show you just the things that are happening during the commute
is a statistical operation but I think to people that are interacting with the thing it feels very much more like they're just sort of browsing a website or you know shopping on Amazon they're there looking at data and they don't realize they're doing statistics what's most exciting for me is that public statistics is making citizens more powerful and the authorities more accountable we have community meetings that the police attend and what citizens are now doing are bringing printouts of the maps that show where crimes are taking place and they're demanding services from the police department
and the police department is now having to change how they police how they provide policing services because the data is showing what is working and what is not people in San Francisco are also using public data to map social inequalities and see how to improve society and the possibilities are endless I think our dream government and data analysis project would really be focused on live information on stuff that was being reported and pushed out to the world over the Internet as it was happening you know trash pickups traffic accidents buses and I think through the
kind of stats gathering power of the Internet it's possible to really begin to see the the workings of a city displayed as a unified interface so that's where we are heading towards the world of free data with all the statistical insights that come from it accessible to everyone empowering us as citizens and letting us hold our rulers to account it's a long way from where statistics began statistics are essential to us to monitor our governments and our societies but it was our rulers up there who started the collection statistics in the first place in order
to monitor us in fact the word statistics comes from the state modern statistics began two centuries ago once it got going it spread and never stopped and guess who was first the Chinese have Confucius the Italians have da Vinci the British have Shakespeare and we have the table varakin the first ever systematic collection of statistics since the year 17:49 we have collected data on every birth marriage and death and we are proud of it the Tamil market recorded information from every parish in Sweden it was a huge quantity of data and it was the first
time any government could get an accurate picture of its people Sweden had been the greatest military power in Northern Europe but by 1749 our star was really faded and other countries were growing strongly at least though we were a large power thought to have 20 million people enough to rival Britain and France but we were in for a nasty surprise the first analysis of Cobell markets we need that Sweden land two million inhabitants Sweden was not only a power in decline it also had a very small population the government was horrified by this finding what
is the enemy found out but the tabal market also showed that many women died in childbirth and many children died young so government took action to improve the health of the people this was the beginning of modern Sweden it took more than 50 years before the Austrians Belgians Danes Dutch French Germans Italians and finally the British caught up with Sweden in collecting and using statistics it was called political arithmetic there was a lovely phrase that was used for statistics governments could have much more control and understanding of this society how is working hair is developing
and essentially so they could control it better it wasn't just governments who woke up to the power of statistics right across Europe 19th century society went mad for facts and despite his late start Britain with its Royal statistical Society in London was soon a statisticians near Varna I love looking at old copies of the Royal statistical society journal exist full out was such odd stuff there's a wonderful paper from the 1840s which shows a map of England and the rates of bastardy in each county and so you can identify very quickly the areas with high
rates of bastardy big in east anglia toys makes me slightly laugh that Norfolk seems to top the bus to the league in the 1840s one of the founders of the royal statistical society was the great Victorian mathematician and inventor Charles Babbage in 1842 he read the latest poem by an equally great Victorian Alfred Tennyson vision of sin contained the lines fill the cup and fill the can have arouse before the moon every moment dies a man every moment one is born so keen a statistician was Babbage that he could not contain himself he dashed off
a letter to Tennyson explaining that because of population growth the line should reach every moment dies a man and one and a sixteenth is born I may add that the exact figure is one point zero six seven but something must be conceded to the laws of metre in the nineteenth century scholars all over Europe did amazing work in measuring their societies they were hoovering update on almost everything but numbers alone don't tell you anything you have to analyze them and that's what makes statistics when the first statisticians began to get to grips with analyzing their
data they seized upon the average and they took the average of everything what's so great the bottle average is that you can take a whole mass of data and reduce it to a single number and though each of us is unique our collective lives produce averages that can characterize whole populations I look to my local newspaper one week and sort a pensioner had accidentally put her foot on the accelerator and crushed her friend against a wall devastating hideous horrible thing to happen and then there was a second one about the young man who didn't have
a driving licence was driving a car under the influence of drugs and alcohol and he rushed into a pedestrian killed him what's remarkable absolutely remarkable if you look at the number of people who die each year in traffic crashes it's nearly a constant what all these individual events somehow when you sum them all up there's the same number every year and every year two and a half times as many men died in traffic crashes as women and it's a constant and every year the rate in Belgium is double the rate in England they're these remarkable
regularities so that these individual particular events summer sum up into a social phenomenon let's see what Sweden have done we used to boast about fast social progress that's where we were in my lectures to tell stories about the changing world I use the averages from entire countries whether the average of income child mortality family size or carbon output okay I give you Singapore the year I was born Singapore had twice the child mortality of Sweden it's the most tropical country in the world a marshland on the equator and here we go it took a little
time for them to get independent but then they started to grow their economy and they made the social investment they got away malaria they were the Magnificent helps us that beat the poke us in Sweden we never thought it would happen that they would win over Sweden but useful as averages are they don't tell you the whole story on average Swedish people have slightly less than two legs this is because a few people only have one leg or no legs and no one has three legs so almost everybody in Sweden has more than the average
number of legs the variation in data is yeast as important at the average but how do you get a handle of variation for this you transform numbers into shapes let's look again at the number of adult women even for different heights plotting the data as a shape shows how much their heights vary from the average and how wide that variations the shape a set of data makes is called its distribution this is the income distribution of China 1970 this is the income distribution of the United States 1970 almost no overlap and what has happened China's
growing it's not so equal any longer and it's appearing here overlooking the United States almost like a ghost isn't it it's pretty scary the statisticians who first explore distribution discovered one shape that turned up again and again the Victorian scholar Frances golden was so fascinated he built the machine that could reproduce it and he found it fitted so many different sets of measurements that he named it the normal distribution whether it was people's arms pants lung capacities or even their exam results the normal distribution shape record time and time again other statisticians soon found many
other regular shapes each produced by a particular kind of natural or social processes and every statistician has their favorite the Poisson distribution the processor is my favorite distribution of users absolute cracker the press'll shake describes how likely it is that out of the ordinary things will happen imagine a London bus stop where we know that on average we'll get three buses enough we won't always get three buses of course amazingly the personal shape will show us the probability that in any given hour we will get four five or six buses or no buses at all
the exact shape changes with the average but whether it's how many people will win the lottery jackpot each week or how many people will form a call center each menu the portion shape will give the probabilities the wonderful example where this was applied to in the late 19th century was to count each year the number of Prussian officers cavalry officers who were kicked to death by their horses now some years there were none Samia is there one from years over to up to seven I think one particularly bad year and but with this distribution how
many years they were would not one two three four Prussian cavalry officers kicked to death by the horses beautifully obeyed the Plus on distribution so statisticians use shapes to reveal the patterns in the data but we also use images of all kinds to communicate statistics to a wider public because if the story in the numbers is told by a beautiful and clever image than everyone understand of the pioneers of statistical graphics my favorite is Florence Nightingale there are not many people who realize that actually she was known as a passionate statistician and not just a
lady of the lab she said that to understand God's thoughts we must study statistics but these were the measure of his purpose statistics was for her a religious duty a moral imperative when Florence was nine years old she started collecting data her data was different fruits and vegetables she found freedom in two different tables trying to organize them in some standard form and so we have one of my girls first statistical tables at the age of nine in the mid 1850s Florence Nightingale went to the Crimea to care for British casualties of war she was
horrified by what she discovered for all the soldiers being blown to bits on the battlefield there were many many more soldiers dying from diseases they caught in the Army's filthy hospitals so Florence Nightingale began counting the dead for two years she recorded mortality data in meticulous detail when the war was over she persuaded the government to set up a Royal Commission of Inquiry and gathered her data in a devastating report what has cemented her place in the statistical history books other graphics she used and one in particular the polar area graph for each month of
the war a huge blue wedge represented the soldiers who had died from preventable diseases the much smaller red bridges were deaths from wounds and the black wedges deaths from accidents and other causes nightingales graphics were so clear they were impossible to ignore the usual thing around florence Nightingale's time is just to produce tables and tables of figures on your app serially tedious stuff that unless you're actually dedicated statistician it's really quite difficult to spot the patterns naturally but visualizations they tell a story they tell a story immediately and the use of color and the use
of shape and you know can really tell a powerful story and nowadays of course we can make things move as well first Nightingale would have loved to have played with she would have been produced wonderful animations I'm actually certain of it today a hundred and fifty years on nightingales graphics are rightly regarded as a classic they led to a revolution in Nursing health care and hygiene and hospitals worldwide which saved innumerable lives and statistical graphics has become an art form of it's very own led by designers who are passionate about visualizing data this is the
billion pound ogram this image arose out frustration with the reporting of billion pound amounts in the media five hundred billion pounds for this war fifty billion pounds for this oil spill doesn't kind of make sense these numbers are too enormous to get your mind round so I scraped all this data from various news sources and create this diagram so that squares here are scaled according to the billion pound amounts when you see numbers visualized like this you start to have a different kind of relationship with them you can start to see patterns you can see
the scale of them here in the corner this little square 37 billion that was the cost predicted cost of the Iraq war in 2003 as you can see it's grown exponentially over the last few years so the total cost now is around about two thousand five hundred billion it's funny because when you visualize statistics like this you understand them and when you understand them you can really start to put things into perspective visualization is right at the heart of my own work - I teach global health and I know having the data is not enough
I have to show it in ways people both enjoy and understand now I'm going to try something I've never done before animating the data in real space with a bit of technical assistance from the crew so here we go first an axis for health life expectancy from 25 years to 75 years and down here an axis for wealth income per person four hundred four thousand and $40,000 so down here is cool and sick and up here is rich and healthy now I'm going to show you the world 200 years ago in 1810 here come over
countries Europe brown asia red Middle East Queens Africa south of sahara blue and the americas yellow and the size of the country bubble showed the size of the population and in 1810 it was pretty crowded down there wasn't it all conquerors were sick and poor life expectancy were below 40 in all countries and only the UK and the Netherlands were slightly better off but not much and now I start the world the Industrial Revolution makes countries in Europe and elsewhere move away from the rest but the colonized countries in Asia and Africa they are stuck
down there and eventually the Western countries get healthier and healthier and now we slow down to show the impact of the First World War and the Spanish flu epidemic what a catastrophe and now I speed up through the 1920s and the 1930s and in spite of the Great Depression Western countries forge on towards greater wealth and health Japan and some others try to follow but most countries stay down here now after the tragedies of the Second World War we stopped a bit to look at the world in 1948 1948 was a great year the war
was over Sweden topped the medal table at the Winter Olympics and I was born but the differences between the countries of the world was wider than ever the United States was in the front Japan was catching up Brazil was way behind Iran was getting a little richer from oil but still had short lives and the Asian giants China India Pakistan Bangladesh and Indonesia they were still poor and sick down here but look what is about to happen here we go again in my lifetime former colonies gained independence and then finally they started to get healthier
and healthier and healthier and in the 1970s then countries in Asia Latin America started to catch up with the Western countries they became the emerging economies some in Africa follows some Africans were stuck in civil war and others hit by HIV and now we can see the world today in the most up-to-date statistics most people today live in the middle but there are huge difference at the same time between the best of countries and the worst of countries and there are also huge inequalities within countries these bubbles show country averages but I can split them
pink China I can split it into provinces there goes Shanghai it has the same wealth and health as Italy today and there is the poor in line problems why show it is like Pakistan and if I split it further rural parts are like Ghana in Africa and yet despite the enormous disparities today we have seen 200 years of remarkable progress that huge historical gap between the west and the rest is now closing we have become an entirely new converging world and I see a clear trend into the future with aid trade green technology and peace
it's fully possible that everyone can make it to the healthy wealthy corner well what you have seen in the last few minutes is a story of two hundred countries shown over two hundred years and beyond it involves plotting a 120 thousand numbers pretty neat so with statistics we can begin to see things as they really are from tables of data to averages distributions and visualizations statistics gives us a clear description of the world but with statistics we cannot only discover what is happening but also explore why by using the powerful analytical method correlation just looking
at one thing at a time doesn't tell you very much is you've got to look at the relationships between things how they changed how they vary together and that's what correlation is about and that's how you start trying to understand the processes that are really going on in the world and in society most of us today would recognize that crime correlates to poverty that infection correlates to poor sanitation and that knowledge of statistics correlates to being great at dancing correlations can be very tricky I got a joke about silly correlations that was this American it
was afraid of heart attack and he found out that the Japanese ate very little fat and almost didn't drink wine event much less heart attacks than the American but on the other hand he also found out that the French eat as much fat as the Americans and they drink much more wine but they also have less heart attacks she concluded that the what kills you is speaking English if you smoke yourself to death the time the pace the cigarette weights tilt the best example of a really groundbreaking correlation is the link that was established in
the 1950s between smoking and lung cancer not long after the Second World War a British doctor Richard Dahl investigated land cancer patients in 20 London hospitals and he became certain that the only thing they had in common was smoking so certain that he stopped smoking himself but other people weren't so sure a lot of the discussion of the early data linking smoking to lung cancer said was not the smoking surely that thing that we've done all our lives that can't be bad for you maybe it's genes maybe people who are genetically predisposed to get lung
cancer are also genetically predisposed to smoke maybe it's not the smoking maybe it's air pollution that smokers are somehow more exposed to air pollution than non-smokers maybe it's not smoking maybe it's poverty so now we've got three alternate explanations apart from chance to verify his correlation did imply cause and effect Richard Dahl created the biggest statistical study of smoking yet he began cracking the lives of forty thousand British doctors some of whom smoked and some of whom didn't and gathered enough data to correlate the amount the doctor smoked with their likelihood of getting cancer eventually
he not only showed a correlation between smoking and lung cancer but also a correlation between stopping smoking and reducing the risk this was science at its best what correlations do not replace his human thought could think about what it means I mean what a good scientist does if he comes up with a correlation is try as hard as she or he possibly can to disprove it to break it down to get rid of it to try and refute it and if it withstands all those efforts at demolishing it and it's still standing up then cautiously
say we really might have something here however brilliant the scientists data is still the oxygen of science the good news is that the more we have the more correlations we'll find the more theories we'll test and the more discoveries we are likely to make and history shows how our total sum of information grows in huge leaps as we develop new technologies the invention of the printing press kicked off the first date an information explosion if you piled up all the books that had been printed by the Year 1700 they would make sixty stacks each as
high as Mount Everest then starting in the nineteenth century became a second information revolution with the Telegraph gramophone and camera and later radio and TV the total amount of information exploded and by the 1950s the information available to us all had multiplied six thousand times then thanks to the computer and later the internet we went digital and the amount of data we have now is unimaginably vast a single letter printed in a book is equivalent to a byte of data a printed page equals a kilobyte on to five megabytes is enough for the complete works
of Shakespeare ten gigabytes that's the DVD movie two terabytes is the tens of millions of photos added to Facebook every day 10 petabytes is the data recorded every second by the world's largest particle accelerator so much only tiny fraction skip six exabytes is what you'd have if you sequence the genomes of every single person on earth but really that's nothing in 2009 the internet added up to 500 exabyte and in 2010 in just one year that we doubled to more than one zettabyte back in the real world if we turn all this data into print
it would make 90 stacks of books each reaching from here all the way to the Sun the data deluge is staggering but with today's computers and statistics I'm confident we can handle it when it comes to all the data on the Internet the powerhouse of statistical analysis is the Silicon Valley giant who the average person over their lifetime is exposed to about a hundred million words of conversation and so if you multiply that by the six billion people on the planet that amount of words is about equal to the number of words that Google has
available at any one instant in time Buddha's Computers Hoover up and file away every document web page and image they can find they then hunt for patents and correlations in all this data doing statistics on a massive scale and for me Google has one project that's particularly exciting statistical language translation we wanted to provide access to all the web's information no matter what language you spoke there's just so much information on the Internet you couldn't hope to translate it all by hand into every possible language we figured we'd have to be able to do machine
translation in the past programmers try to teach their computers to see each language as a set of grammatical rules much like the way languages are taught at school but this didn't work because no set of rules could capture language in all its subtlety in ambiguity having eaten our lunch the coach deposit well that's obviously incorrect written like that it would imply that the coach has eaten the lock it would be far better to say having eaten our lunch we departed in the coach those rules are helpful and they are useful most of the time but
they don't turn out to be true all the time and the insight of using statistical machine translation is saying well if you ought to have all these exceptions anyways maybe you can get by without having any of the rules maybe you can treat everything as an exception and that's essentially what we've done what the computer is doing when when he's learning how to translate is to learn correlations between words and correlations between phrases so we we feed the system very large amounts of data and then the system is seeing that a certain word or a
certain phrase correlates very often to the other language Google's website currently offers translation between any of 57 different languages it does this purely statistically having correlated a huge collection of multilingual texts the people that built the system don't need to know Chinese in order to build a Chinese to English system if I don't need to know Arabic but the expertise that's needed is basically knowledge of Statistics knowledge of computer science knowledge of infrastructure to build those very large computational systems that we are building for doing that I hooked up with Google from my office in
Stockholm to try the translator for myself okay so it says Whedon's finance minister has a ponytail and the gold ring in your ear so I guess it very means in his same-sex partnerships has stock homes new bishop and his partners are three years on okay so so that's those kinds of words he sent her are one of the challenges in in translation to get really those right mt bishops one can its use it right right is more often than not it would probably be his nice very idiom todo limpio order okay when Sweden is taking
part in Olympic gold is not to win the translator is good but if they succeed with what's next that would be remarkable one of the exciting possibilities is combining the machine translation technology with the speech recognition technology now both of these are statistical in nature the machine translation relies on the statistics of mapping from one language to another and similarly speech recognition relies on the statistics of Matt mapping from a sound form to the words when we put them together now we have the capability of having instant conversation between two people that don't speak a
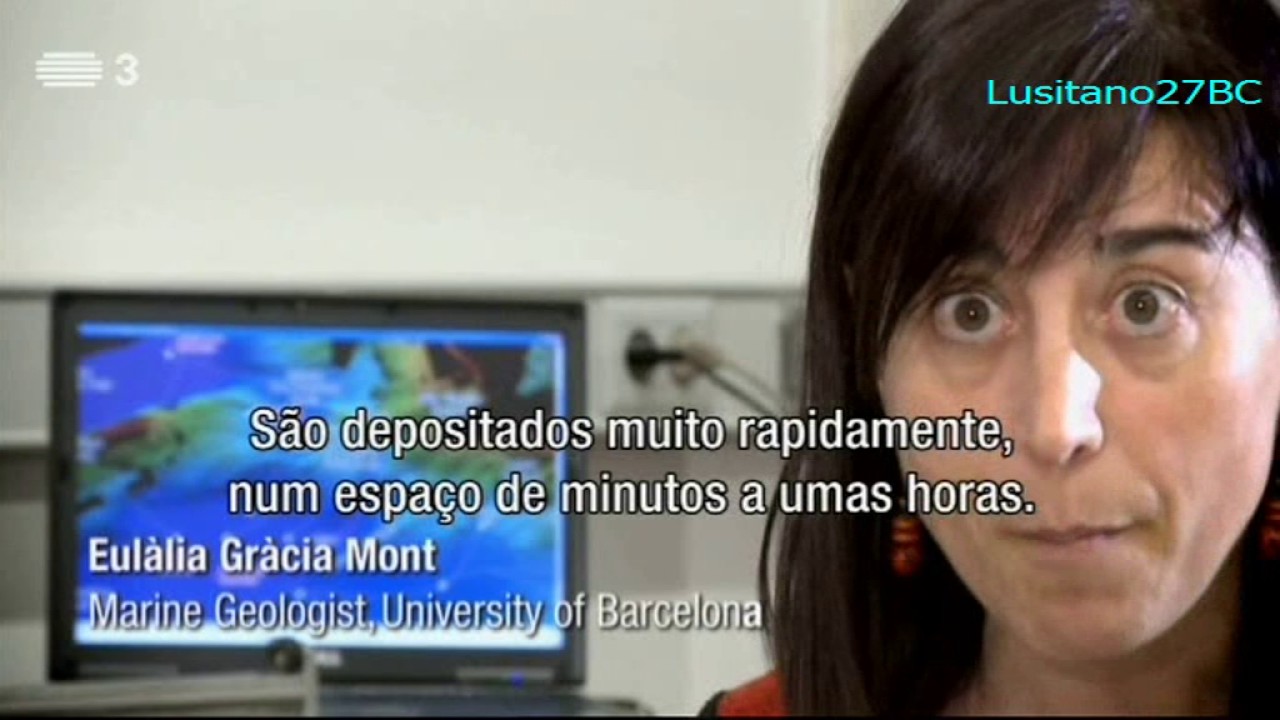
common language that I can talk to you in my language you hear me in your language and you can answer back and in in real-time we can make that translation and bring to get people together and allow them to speak the Internet is just one of many technologies created together massive amounts of data scientists studying our earth in our environment now use an incredible range of instruments to measure the processes of our planet all around us our sensors continuously measuring temperature water flow and ocean currents and high in orbit our satellites busy imaging cloud formations
forest growth and snow cover scientists speak of instrumenting the earth and pointing up to the skies above are powerful new telescopes mapping the universe what's happening in astronomy is typical of how profoundly this new torrent of data is transforming science astronomers are now addressing many enduring mysteries of the cosmos by applying statistical methods to all this new data the galaxy is a very big place and it's got billions of stars in it and so to put together a coherent picture of the whole galaxy requires having an enormous amount of data and before you could do
a large Sky Survey with sensitive digital detectors that meant that you could map many many stars all at once it was very difficult to build up enough data on enough of the galaxies in the past large surveys of the night sky had to be done by exposing thousands of large photographic plates but these service could take 25 years or more to a complete then in the 1990s came digital astronomy and a huge increase in both the amount and the accessibility of data the Sloan Sky Survey is the world's biggest year using a massive digital sensor
mounted on the back of a custom-built telescope in New Mexico it's scanned the sky night of the night for eight years building up a composite picture in unprecedented resolution the phone is some of the best deepest survey data that we have in astronomy both on our own galaxy and on galaxies further away from ours all the Sloan data is on the Internet and with it astronomers have identified millions of hitherto unknown stars and galaxies they also combed the database for statistical patterns which will prove this proof or even suggest new theories so we had this
idea that galaxies grow they become large galaxies like the one we live in the Milky Way not all at once or not smoothly but by continuously incorporating basically cannibalizing smaller galaxies they dissolve them and they become part of of the bigger galaxy as it grows it's a startling idea and in the Sloan data is the evidence to support it groups of stars that came from cannibalized galaxies stand out in the Sloan data a statistically different from other stars because they move at a different velocity each big spike on one of these distribution graphs means professor
Rocco C has found a group of stars all traveling in a different way to the rest they are the tell-tale patterns she is looking for the evidence is accumulating that in fact this really is how galaxies grow or an important way in which how galaxies grow and so this is an important part of understanding how galaxies form not only ours but every galaxy the more data there is the more discoveries can be made and the technology is getting better all the time the next big survey telescope starts its work in 2015 it will leave Sloan
in the dust Sloan has taken eight years to cover one quarter of the night sky the new telescope will scan the entire sky in even greater resolution every three days the vast amounts of data we have today allows researchers in all sorts of fields to test their theories on a previously unimaginable scale but more than this it may even change the fundamental way science is done with the power of today's computers applied to all this data the machines might even be able to guide the researchers whereas a potentially profoundly important and potentially one of the
most significant points in science and certainly when the most exciting where the potential to transform not just how scientists do science but even what science is possible and what will power that transformation of both how science is done and even what science as possible is going to be computation many of the dynamics of the natural world like the interplay between the rainforest and the atmosphere are so complex that we don't as yet really understand that but now computers are generating literally tens of thousands of different simulations of how these biological systems might work it's like
creating thousands of hypothetical parallel worlds each and every one of these simulations is analyzed with statistics to see if any are a good match for what is observed in nature the computers can now automatically generate tests and discard hypotheses with scarcely human insight this new application statistics will become absolutely vital for future of science is creating a new paradigm if you like in science in the way which we can do science which is increasingly before my couch Rises data centric or data-driven rather than being hypothesis driven or experimentally driven so it's exciting times in terms
of the science in terms of the computation and in terms of the statistics now if all that sounds a bit abstract and theoretical to you how about one final frontier could statistics even make sense of your feelings in California where else one computer scientist is harvesting the Internet to try to define the patterns of our innermost thoughts and emotions well this is the madness no movement the maddest mint represents a skyscraper view of the world each of these brightly colored dots is an individual feeling expressed by someone out there in a blog or a tweet
and when you click on a dot it explodes to reveal the underlying feeling of that person this is what people say they're feeling today better safe crappy well pretty special sorry hello so every minute we feel fine calls the world's blogs takes all the sentences that start with the words I feel or I am feeling and puts them in a database we collect all the feelings and we count the most common they're better bad good right guilty sick the same like [ __ ] sorry well and so on and we can take a look at
anyone feeling and analyze it right now a lot of people are feeling happy we can take a look at all the people who are happy and break down by age gender or location says bloggers have public profiles we have that information and so we can ask questions like are women happier than men or is England happier than the United States we find that as people get older they get happier and moreover we find that for younger people they associate happiness more with excitement and as people get older they associate happiness more with peacefulness and we
also find that women feel loved more often than men but also more guilty while men feel good more often than women but also more alone as people lead more and more of their lives online they leave behind digital traces and with these digital traces we can begin to statistically analyze what it means to be human so where does all of this leave us we generate unimaginable quantities of data about everything you can think of and we analyze it to reveal the patterns and now not only expert but all of us can understand the stories in
the numbers instead of being led astray by prejudice with statistics at our fingertips our eyes can be open for a fact-based view of the world so more than ever before we can become authors of our own destiny