so validation and cross-validation we actually talked about in quite a bit of detail in the section along with the bootstrap so i won't cover it in much detail now just to remind you so the basic idea is now or the basic problem right we have a sequence of models like for example from subset regression forward step bys or backward stepwise each one with a model size k and we want to choose the best model size we just talked about some methods based on adjusting the rss cp aic and bic validation cross validation rather than make
an adjustment they're more direct so just remind you what the idea of validation is we divide the data up into two parts a training set and a validation part so let's say let's just draw that so here's my training part at random maybe i'm going to choose say a half or three quarters to my training set and the balance to be the validation set and then the basic ideas are going to fit the models of various sizes of various k for example if it's fourth stepwise i'm going to choose the i'm going to find that
the best model of each so the best the forward stepwise model of each size k on my training set and then evaluate its error on the validation part and the validation error as a function of k will be my what will be what i use to to estimate prediction error and to choose the model size so this is validation and cross validation is much like that except it's sort of a k k act play right so it's full cross validation i'll divide the data up into five parts two three four five and then at each
stage of the play four of the parts our training sets are the training set so let's say these first four parts of the training set and this last guy is the validation in this phase so i will fit my models of of all size k to these four parts of the data the training set and evaluate the error on the validation part and i'll do that in turn for the five different possibilities where at each stage one of the pieces is the validation and the other four pieces of the training and then we'll summarize the
results together to get an idea of the error as a function of k that's called a cross validation error estimate and then we'll find the minimum of that curve so again i said that quickly because we've gone over that in detail in the previous section of the course so here i have i have said this again in words on the second bullet item so either using validation or cross validation we'll get an idea of the error for each model size k and then select the k that gives us the lowest test error over the the
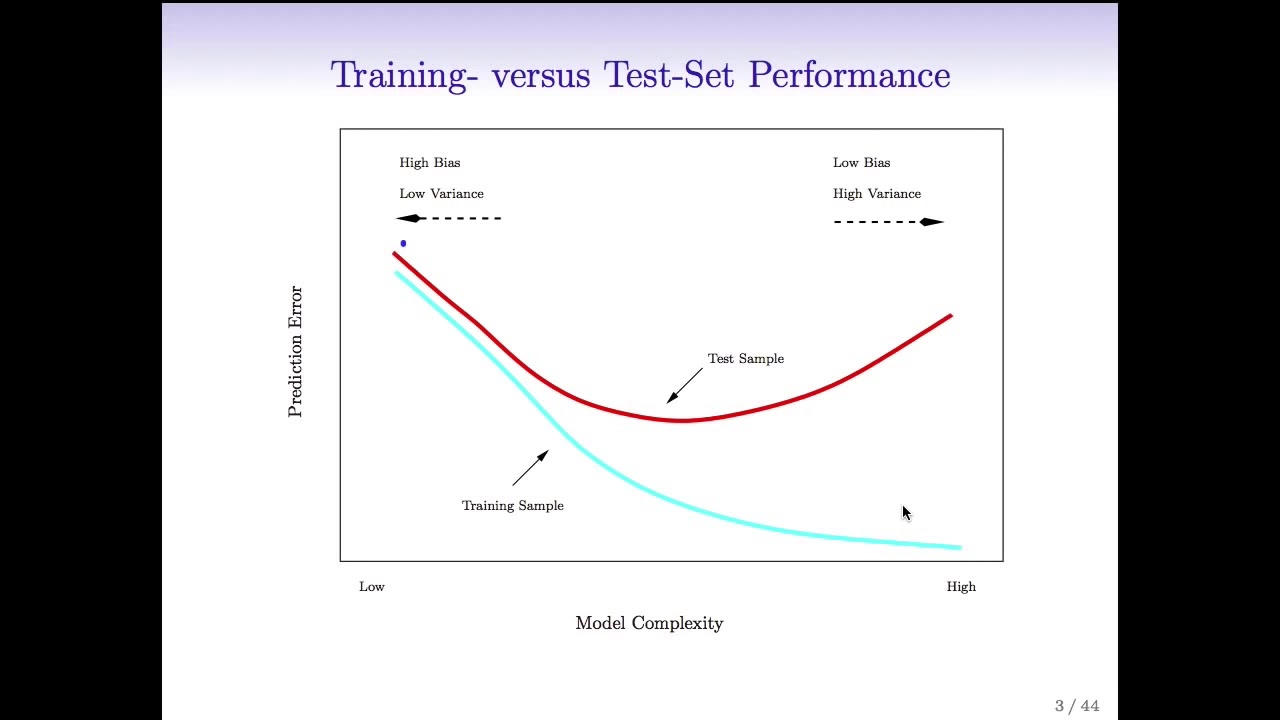
validation part of the process and this is actually a very attractive approach and we've said this already but it's good to say it again compared to the other method we talked about the advantage there's a number of advantages the one big advantage it doesn't require an estimate of sigma squared you might think that's a small advantage but it's actually quite quite important because if p is bigger than n as it is quite often in data that we see these days to get an idea of the an estimate of sigma squared is very difficult we can't
fit a full model because the full model will totally saturate and give an error of zero so we need we have to pick some kind of a smaller model but we can it's quite arbitrary the model we pick and it's hard to know we'd like to fit a model that has all the good variables and leaves out the noise variables but we don't know of course what's the signal what's the noise if we did know that we wouldn't even have to do it we wouldn't have to think of these models so it's getting any idea
of sigma squared it seems like it may be a trivial matter but it's actually very challenging for models uh with for situations with with large numbers of features so and that's actually challenging to the point where like it's an open area in statistical research so like i you know i'm an associate editor for a journal and we we get submissions from like statisticians at top tier universities who are coming up with ways to estimate sigma squared so you know maybe in ten years uh this will no longer be a challenge but right now it's really
hard to do and that's actually one of the reasons it's so much fun to be a statistician because we get new kinds of data much for example a high dimensional data with large numbers of variables and presents challenges to the to things which are simple in with small numbers of variables now become very challenging but very important so the technology and the the the kinds of data that we see bring bring new challenges to our field every day so cross-validation helps to solve that problem by avoiding an estimate of sigma squared we don't need to
plug in sigma squared anywhere the other point is you don't need to know d remember these previous formulas for example the adjusted r squared had a d in it and cp and aic and bic have all had the number of parameters well again that might seem sort of a silly thing of course you know the number of parameters in your model well that's true when your model is is a linear model and you pick you're choosing predictors as coefficients but for methods like ridge regression and lasso which are shrinkage methods we'll talk about next it's
not at all clear what d is and it's actually it's another whole area of research figuring out what is meant by d the number of parameters in a model which is not fit by least squares so again cross validation finesses that problem by not requiring a you you to plug in a value for d so d and sigma squared are both challenges and cross validation relieves the worry of having to come up with good estimates of those so i've said all these things so let's see what it looks like in the credit data example so
again the number of predictors here we apply to the square root of bic just to make it comparable to the other two estimates the validation set error and the cross validation error so here we did actually validation set was three quarters one quarter so three quarters of the data was randomly chosen to be the training set one quarter is the validation set and we see the error tracked as a function of the number of predictors we've marked the minimum and here it's about six predictors cross-validation i think this was do i say here five a
ten-fold cross-validation we like 5 or 10 full cross validation in general they're good good values it's producing about the same model size 6 as the minimum again the curve is very flat it's hard to see here it's rising very slightly to the right but there's not much to choose between say four and ten four and eleven predictors right they're giving you basically the same error bic as as often the case remember we said compared to aic it it imposes a stronger penalty on the on the model size it tends to produce models which are a
little bit smaller and they did so here about here it's about four but again the curve is so flat there's not much we can really say about these models between three and eleven predictors and actually i mentioned the bottom here the one standard error rule we talked about this a bit in the cross validation section let me just remind you what that is the one standard error rule says well we're not going to pick the actual minimum of the curve but we'll acknowledge the fact that the curves have variation because they're actually they're they're random
variables just like the data are the functions of the data so the one standard error rule let's draw it just in pictures here so let's suppose we have a one of these curves in the minimum here's the actual the actual minimum the standard error of the curve which we didn't indicate in these examples but we should have we can get well the cross validation just an average over the k folds so the standard error of that mean of k things like kx 10 the standard error of those 10 numbers gives us the standard error of
this curve so we could draw the standard error plus or minus one standard errors from the minimum so the one standard error rule says remember this is the number of predictors along the horizontal axis it says don't choose the minimum but take the simplest model that comes with one standard error of the minimum so that would be we'd come across to here and we choose this model okay so the idea being well if these models are within one standard error of each other we really can't tell them apart on the basis of the data because
they're the error is almost the same so all those equal we'd rather have a simpler model so that's why we've moved to a model to the left here which has fewer predictors and its error is no more than one standard error away from the the error of the of the best model so the one standard error rule which is is pretty popular now it's not used at the model with the absolute minimum but use a simpler model that comes within one standard deviation of the of the minimum okay so the rationale for this again i've
said it is that if the models are within one standard error of each other let's choose the simplest one because it's easier to interpret