Hey traders! Today, I am going to show you one of the easiest scalping strategies ever. If you follow my channel, you might have noticed that, I prefer swing trading, instead of day trading.
But I still try to share scalping strategies with you. I try to explain every strategy as I am explaining it to a beginner. But it might get confusing sometimes, if you are a complete beginner.
But don’t worry, the strategy that I am going to show you today, is really easy, and yet it is still profitable. I hope that after the video, you will be able to test it out yourself. Before we begin, please don’t forget to like and subscribe for more trading strategy videos, it keeps me motivated to upload more content.
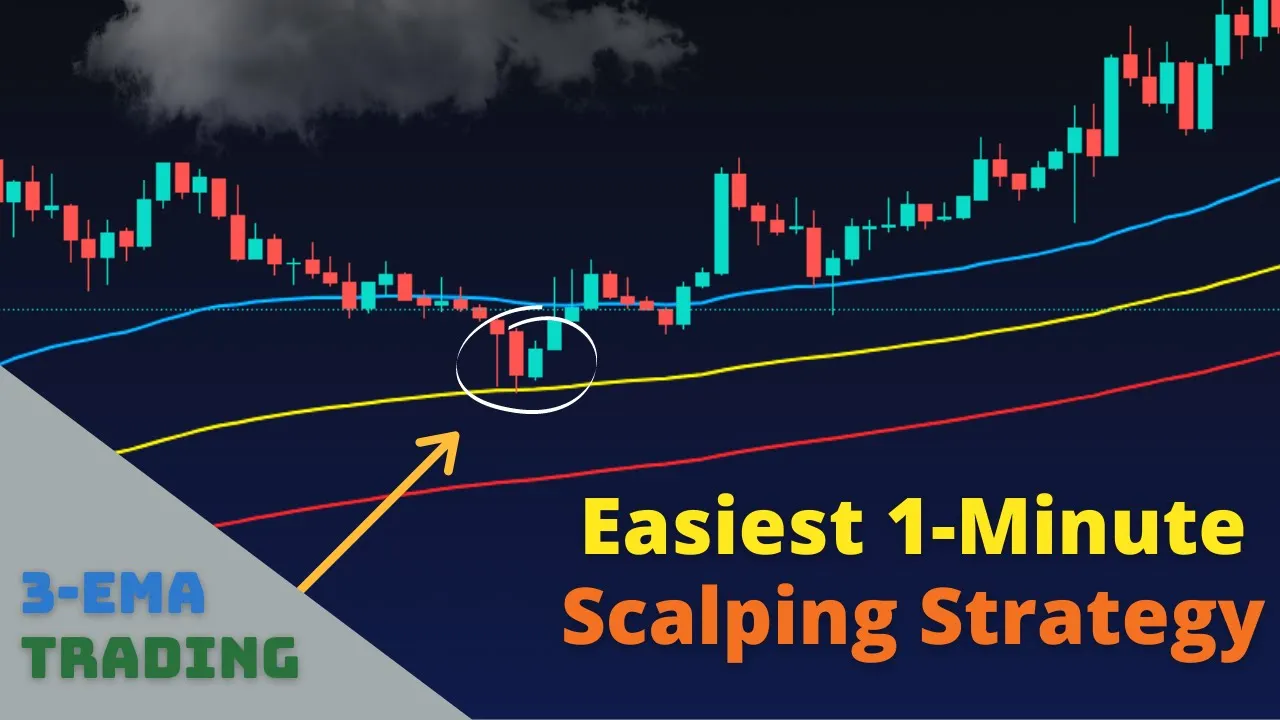
This strategy is fit for scalpers, because we will use a 1-minute timeframe. If you are not comfortable trading with the 1-minute timeframe, then this strategy is not suitable for you. Let’s start with our strategy, as usual I will open tradingview.
com. The first thing I will do, is to change the timeframe into a 1-minute chart. You can change the timeframe here.
Right now, I am looking at the 1-minute chart of euro to USD. But you can change the pair if you want. You don't have to write down the changes I have made, I will give you a cheat sheet in approximately 1 minute.
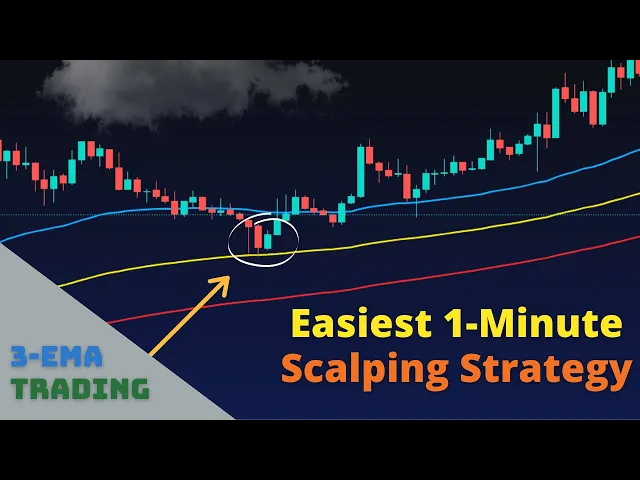
In this strategy, we will use 3 E. M. A.
lines. And E. M.
A. stands for the exponential moving average. E.
M. A. is one of the most used indicators out there, because it shows us the direction of the short-term trend.
Also moving averages can act as support and resistance. Actually, this video is not about the moving averages, but you should know those features, in order to understand the psychology behind this strategy. And if you want to learn more about the moving averages, you can check my previous videos.
Now, I am going to add 3 exponential moving averages to our chart. To add indicators, you have to click on the indicators icon here. And you have to search for moving average exponential.
You can add them to your favorites by clicking the star icon next to it. And after you add it, it will appear on the drop-down menu here. I will go on and add two more.
Right now, you are not able to see all of the averages on the screen, because, since all of them have the same length, they look like a single line. We have to adjust their settings before starting. We will use 50, 100, and 150-period moving averages.
To adjust the settings, you need to click on the settings icon next to indicators. And we will change the length of the indicators. I will also change the color of the lines, for a smoother look.
Perfect! Now our chart is ready for technical analysis. Now, I am going to share every change, we have made on our chart, you can pause the video and take a screenshot if you want.
Now we can move on with our strategy. As I told you, E. M.
A. shows us the trend, the 50-period E. M.
A. shows us the short-term trend, while the 100 and the 150-period E. M.
A. 's show us the long-term trend. If all of the moving averages have a positive slope, it means that we have a bullish trend.
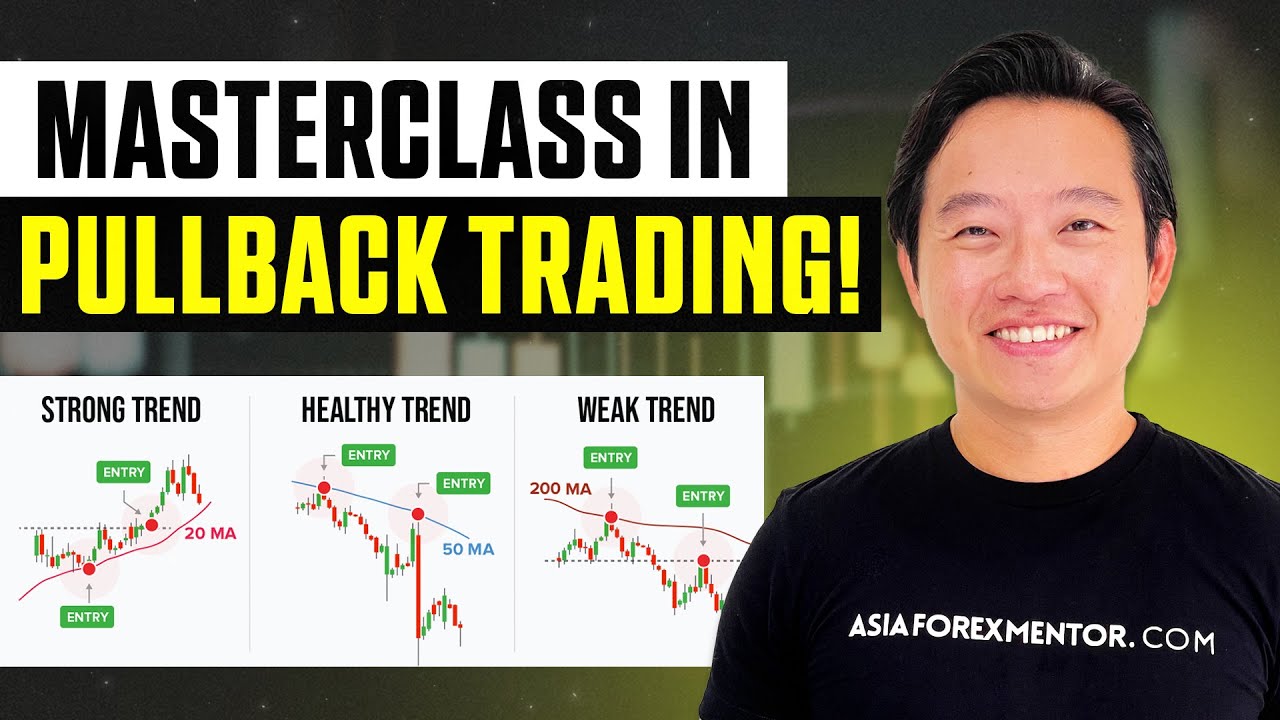
And in a strong bullish trend, slopes of all of the moving averages are higher than 30 degrees. Similarly, in a bearish trend, all of the moving averages are moving downwards. In order to become a profitable trader, we should trade in the same direction as the trend.
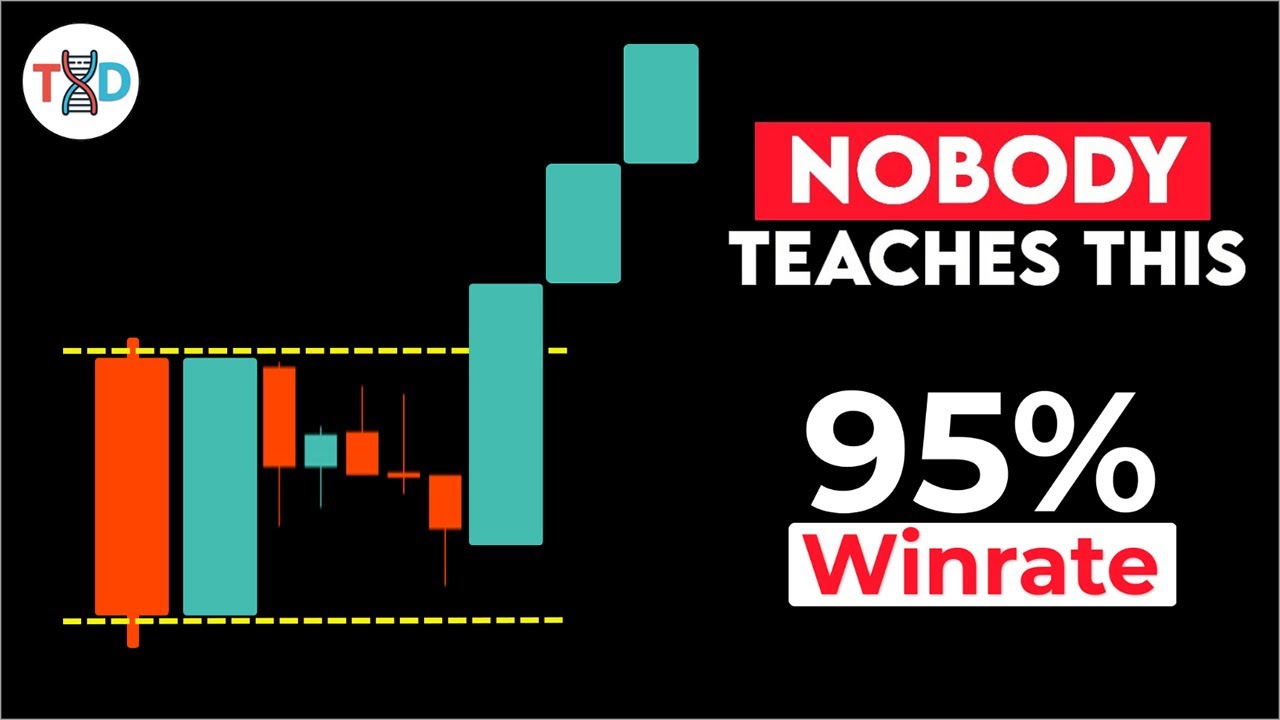
So we will only open long positions if there is a positive trend. And we will only look to go short, if the trend is negative. This strategy is a pull-back strategy.
So we will try to benefit from pull-backs in the trend. That means, we need a strong trend. Lines shouldn't be touching each other.
And we should avoid ranging markets like this. All of the moving averages should be in a row, with a big slope. So, we want the lines apart from each other.
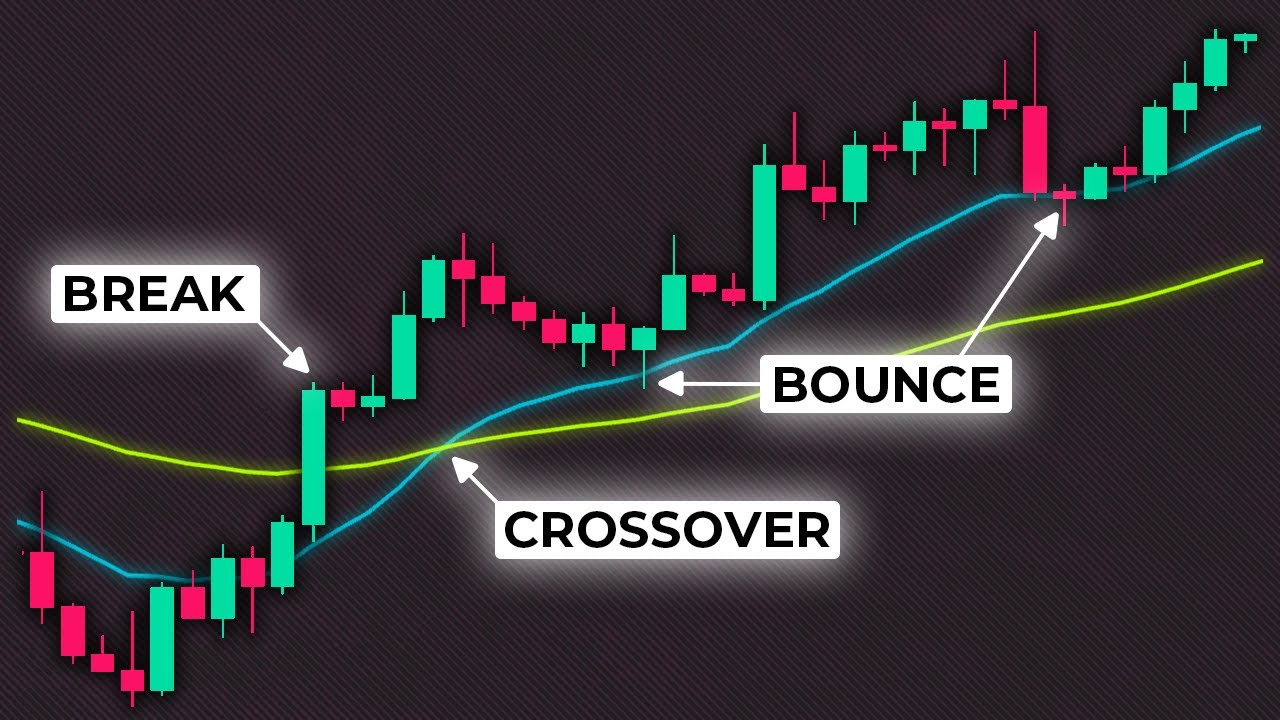
Let's look at some examples. There are two potential entries on the chart right now. In this strategy, we will use the weakness in the short-term trend in our favor.
You can see that, there is a strong upwards trend here, and the price moves below the 50-period moving average. It tests the 100-period E. M.
A. , it can't break it and moves above the 50-period average again. This happens two times in a row.
This states a strong mid-term trend. And that is when we will open a position. To open a position, we will wait for the price to move below the 50-period E.
M. A. , and we will go long at the first candle that opens above the 50 moving average.
I will put my stop-loss just a little bit below the low of the candles. And I will aim for a 1. 5 risk-reward ratio.
It means I will try to win 1. 5 times more than I risk. If I risk 10 dollars, I will risk it while trying to make 15.
As you see, this trade was a winner. And there is another potential entry right next to it. The price moves below the 50 E.
M. A. and tests the 100 E.
M. A. again.
As soon as the price moves above the 50 E. M. A.
, I will open a position. We will open our positions at the first candle that opens above the 50 moving average. Similar to the first one, our stop-loss will be just below the low of these candles.
And this trade was a winner too. Let's check more examples. Here you can see that, there is a strong bullish trend.
The price constantly makes higher highs, and higher lows. And it tests below the 50 E. M.
A. many times. Actually, there are multiple possible entries in this chart, but the best one is this.
Because the price clearly breaks below the 50 E. M. A.
, it tests the 100 moving average, and it fails to break it. So, I will open a position as soon as a candle opens above the 50 average. You can use 1.
5 risk-reward ratio again. But actually, there are many exit strategies for this setup, setting a fixed stop-loss, and a take-profit target is the first exit strategy you can use. But, I am not a big fan of this exit strategy.
Because there is no room for error while scalping. Everything can change in seconds. So, instead of setting fixed profit targets, I do something else.
I open a position with a stop-loss, just below the candles, and when the price moves in my favor, let's say in this candle, I immediately move my stop-loss to breakeven point. And I keep moving my stop-loss at each time the price makes a new high. While using this strategy, I ride the trend until a specific resistance or a Fibonacci level, and even if the price never hits my take-profit target, I will still make a profit, because my stop-loss point will be higher than my entry.
Both exit strategy has its own advantage, with the second strategy you can ride the trend risk-free. And, you will not lose anything if the price drops. However, you will be stopped a lot.
It will be painful to watch your trades getting stopped out before the price moves in your favor. But I prefer to be stopped out without risking anything, rather than to be stopped out with a loss. And thanks to this exit strategy, you will minimize your losses, while maximizing your profits.
But still, both of the strategies are profitable, you can stick with the one that you feel comfortable with. It really depends on what type of trader you are. Let's move with a short setup.
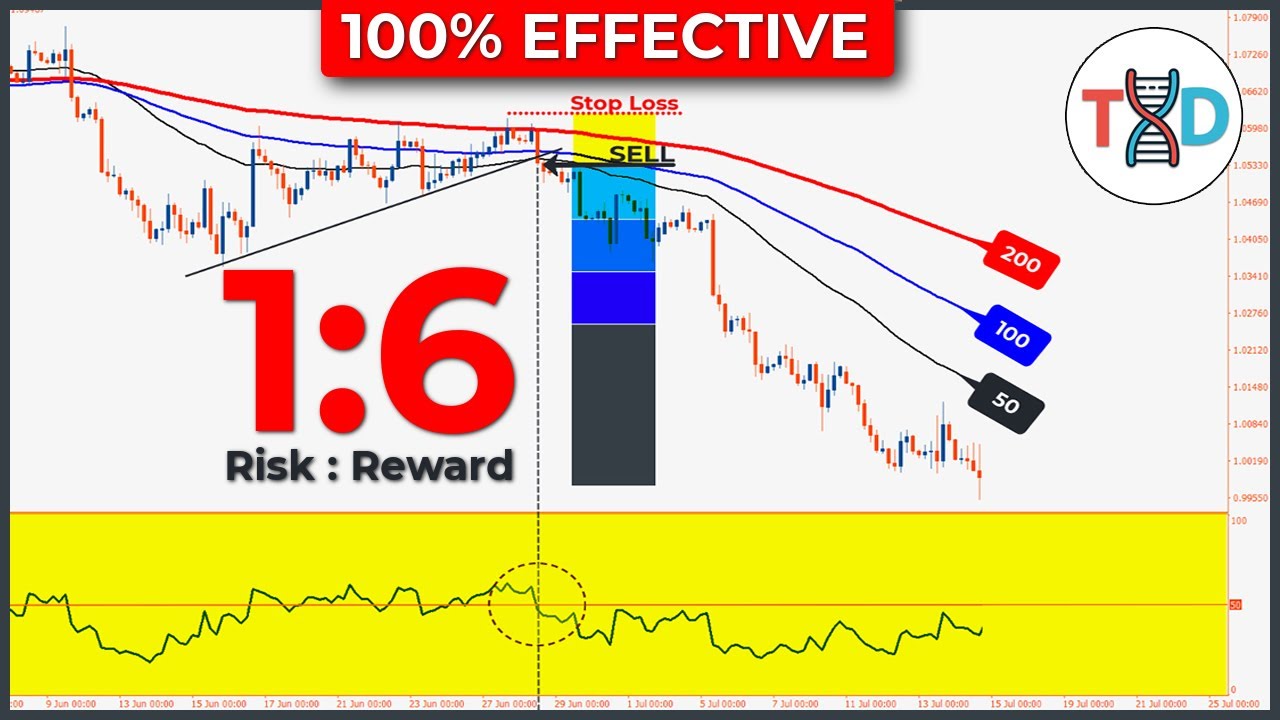
In this setup, there is a clear bearish trend. And lines are not close to each other. So, we will wait for a candle to break above the 50 E.
M. A. and test the 100 moving average.
Here, you can see a perfect entry. You can go short at the first candle that opens below the 50 E. M.
A. , and similar to our last entry, you can move your stop-loss when the price moves in your favor. Let me remind you that the price can even break above the 100 E.
M. A. , and test the 150 E.
M. A. , you are still allowed to open a position.
But it shouldn't break above the 150 E. M. A.
, even if a shadow moves above the 150 E. M. A.
, you should skip the trade. Because 150 moving average shows us the long-term trend, and it is risky to open a trade if the trend is not strong anymore. The same rule applies to long setups also.
Price can test the 150 E. M. A.
, but you should forget about opening a position as soon as the price moves below the average. Even if there is a great chance that the 150 moving average will act as a support, it is not worth the risk. So, skip any entry signal that touches the 150 E.
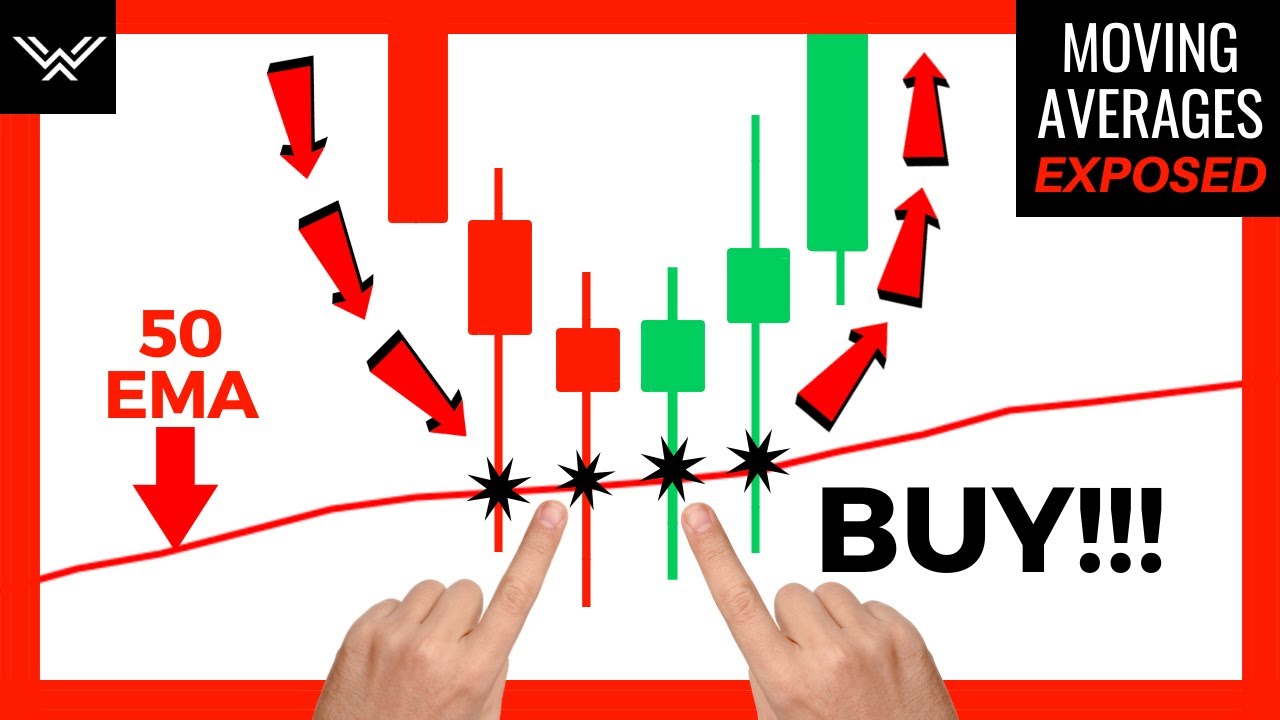
M. A. Let me show you the psychology behind this strategy, and why this strategy works.
50 E. M. A.
is one of the most used indicators out there. And we are trying to take advantage of the impatient traders, who open a position as soon as the price crosses below the 50 E. M.
A. line. Let me explain it with an example, if you have watched my previous videos about moving averages, you should remember that, moving averages can act as support or resistance.
And it is a well-known thing that, after a support or resistance level is broken, the price can make a huge movement in the opposite direction. So, the beginner traders who know this information, look for the price to move below the 50 E. M.
A. , and they open a short position as soon as a candle opens below the moving average. And you can guess where their stop-losses are.
That's right. Just above the 50 E. M.
A. , so, when the price bounces back on the 50 moving average, their stop-loss orders will be filled, and the price will increase with their closing positions. And this is when we want to go long exactly, We will open a position as soon as a candle opens above the 50 E.
M. A. .
and we will try to benefit from their closing orders. You should always remember that, trading is a zero-sum game. If someone is making money, it comes from another trader's pocket.
And in this strategy, we are trying to take advantage of the novice traders, who act in a rush, and open a position without confirmation. To separate yourself from these beginner traders, you must backtest every strategy before trading. Please do not trust any strategy without testing it yourself first.
And please do not risk more than you are willing to lose. While scalping you should never risk more than 2% of your capital. I hope that you understood the strategy.
But if you have any questions, please feel free to ask them in the comments section, I will try to answer all of them. If you find this video helpful, please consider liking it, to show us support. And if you are interested in more trading strategy videos, you can subscribe to our channel, and hit the bell icon, so you don't miss out on our new uploads.
Have a profitable day everyone.