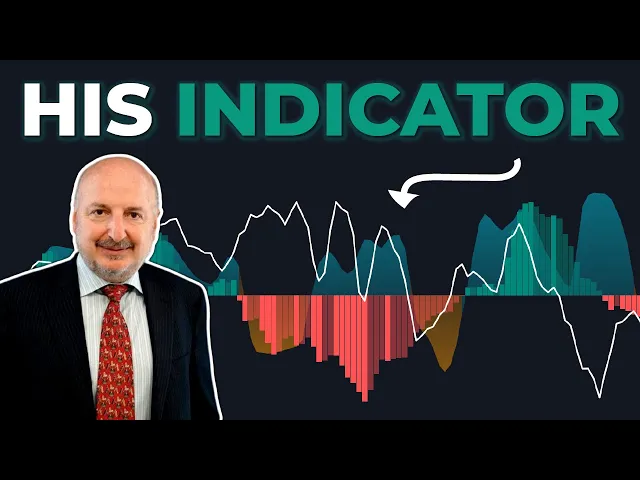
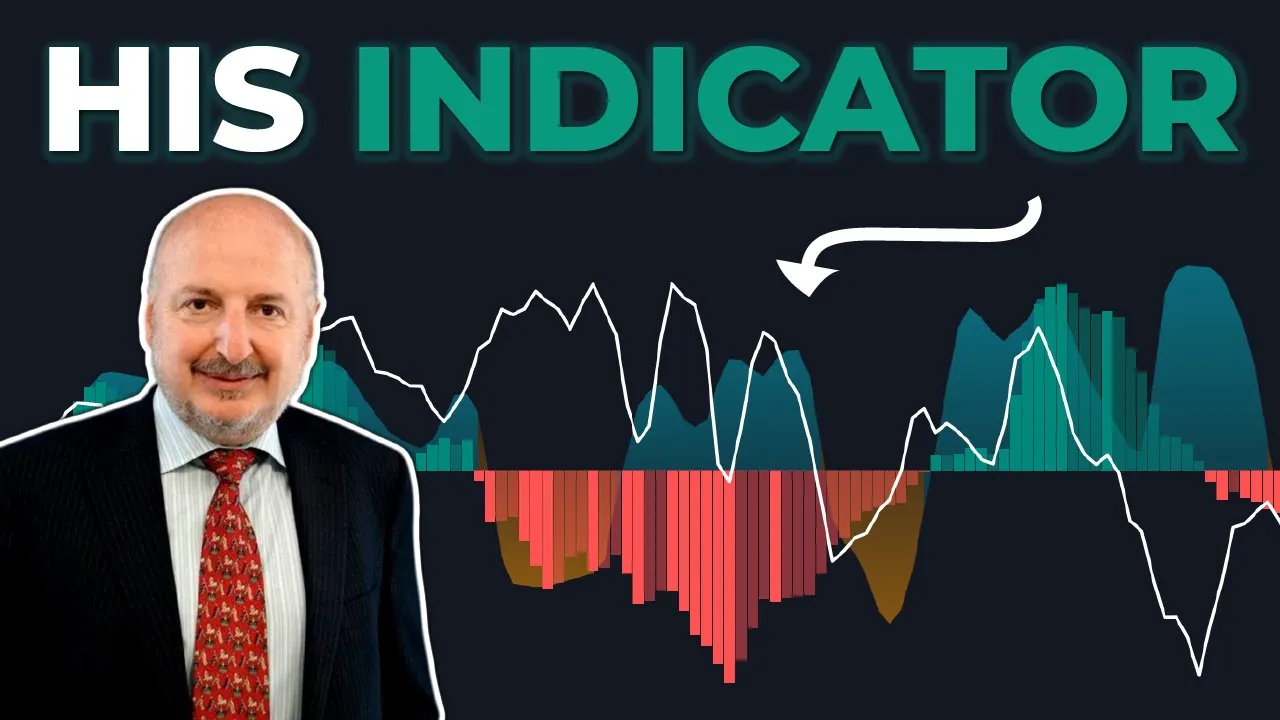
this is Dr Alexander Elder a professional Trader and author who has achieved immense success in his trading career which began in 1970s over the years he has written several influential books and contributed significantly to the trading community in 1989 Elder developed an indicator known as the Elder Ray index to enhance his trading strategies he named it Elder Ray to signify its ability to see through the market much like an x-ray machine the Elder Ray index combines a 13-day exponential moving average the EMA with two critical components the Bull power and the bare power the bull
power measures the ability of buyers to push prices above the EMA while the bare power evaluates the ability of sellers to drive prices below it essentially the Elder Ray index helps Traders assess whether the majority of the market participants are buying or selling now fast forward to 2020 and we now have the open interest inflow and outflow indicator by Lux algo This Modern tool is designed to address today's more complex market dynamics it provides a more nuanced approach to analyzing Market activity and sentiment helping Traders make more informed decisions about whether to take long or
short positions and in this video we're going to explore exactly what this indicator is now to get started with this indicator we first of all want to go to trading View the trading platform that I'm going to be using if you need to sign up there's going to be a link in the video description for you to do that and you might want to hurry up and grab the Black Friday offer before it expires because you know today is Friday now once on trading view you want to load the 15minute time frame of btcusd for
me I'm going to go with this one from bitstamp next you're going to click on indicators and type in open interest inflows and outflows and it's going to be this one by Lux out go the open interest inflows and outflows indicator is a tool designed to provide Traders with deep insights into market dynamics Now by analyzing open interest changes to gugge Trader activity and combining this data with price sentiment this indicator reveals the balance between buyers and sellers in the market it offers insights into market dynamics Trend Direction and momentum of the market as you
can see it's a super simple indicator which is made up the following components this histogram is the open interest flow sentiment this gray line is the price sentiment and this is the open interest sentiment correlation also looking at this indicator you can see it has a zero level which acts as the central access point for the indicators analysis now at this point in time I know you may be thinking but what exactly does each component of this indicator actually do well let's explore them step by step the histogram also known known as the open interest
flow sentiment this measures the difference between new positions being opened known as inflows and the existing positions being closed known as outflows whenever the histogram is above the zero level that indicates that more traders in the market are opening new positions which indicates an increase in Market interest and potential bullish momentum whenever this happens you want to be taking only long positions and if you had any short positions well you want to be closing them conversely if the bars are under the zero level that would indicate that more traders in the market are closing their
positions this would indicate a decrease in Market interest and potential bearish momentum whenever this happens you of course want to be looking to exit your long positions or to only take short positions next we have the gry line also known as the price sentiment this assesses the balance between buying pressure and selling pressure in the market whenever it's above the zero level it indicates that buyers are stronger than sellers indicating an upward pressure on the prices but whenever this line gets under the zero level that would indicate that sellers are stronger than buyers indicating a
downward pressure on prices next we have this area which is known as the open interest sentiment correlation it shows the correlation between the open interest flow sentiment this histogram and any other selected data source and the settings of this indicator we can see that we can choose to correlate the histogram with the price sentiment or the price itself or the volume or the unbalance volume by default it's set to price sentiment essentially it measures how closely the open interest changes are related to movements in the selected data so whenever it's above the zero level it
reinforces the current trend and adds extra confidence to the signals generated by the open interest histogram and vice versa for when it's under the zero level this indicator also has this table that shows the money inflow as a percentage and the money outflow as a percentage this is the money flow estimate it provides an approximation of all the money flowing into or out of a financial instrument based on changes in open interest and price movements the money inflow percentage represents the percentage of money flowing into the market for this latest candle the money outflow percentage
represents the money flowing out of the market for this specific candle now remember these numbers are just for one candle not for the entire day so if you're using the 15minute time frame for example as you can see as I forward the chart the numbers are going to change based on different candles now this indicator settings are pretty self-explanatory I'm going to be using the default settings for the strategy I'm going to be showcasing in this video the only change I'm going to make is disabling the open interest sentiment correlation and change the price sentiment
color to white and increase its opacity to 100% after that click okay now an important thing to note before we go over the conditions for taking a long position is that this indicator is based on Dr Alexander Elder's ACC claimed Elder Ray concept considering that the high price of any candle signifies the maximum power of buyers and the low price represents the maximum power of sellers Elder uses a 13 period EMA to depict the average consensus of price value the bll power assesses whether buyers can drive prices above the average consensus while the Beyer power
assesses whether sellers can push prices below the average consensus this concept is utilized in calculating the open interest flow sentiment this histogram as well as the price sentiment this white line essentially with these two features we will be able to identify potential shifts in Market sentiment and momentum now for our first strategy we're going to add an indicator known as the PT Market Beacon this is our very own custom indicator and I'm going to show you how we can combine these two for a simple yet super powerful strategy But first you want to double click
on the PT Market Beacon and then on the style tab you want to disable the second buy label the cell label b s plot candle boxes labels line fills and lines after that click okay this is a buy sell indicator that uses Advanced price action methodologies to produce these super accurate long and short signals now to take a long position with this strategy the first condition is you want to have a long signal printed by the PT Market Beacon indicator this indicates our entry candle next corresponding to this signal candle we need to look down
here basically the most recent histogram bar from the open interest inflows and outflows indicator should be colored green this indicates that more Traders are opening new positions increasing Market interest and potentially increasing bullish momentum we also need this white line known as the price sentiment to be above zero this indicates that buyers are stronger than sellers at this very instant indicating an upward pressure on prices and increasing the probability of the price going up lastly you want to check on this table and the money inflow value should be at least 80% right here we can
see it's well above the 80% limit which means this is a valid entry we enter a long position here put the the stop loss under the most recent swing low but if the swing low is too far down you can just align it with the top of the long signal label for my back testing I found that aligning it with the top of the long signal label increases the chances of stop- loss not being hit and it's the same thing for short positions now for the takeprofit we want to set it at 1.5 times the
risk letting the trade run and as you can see the trade with profitable now to take a short position it's going to be the opposite of everything we just did for the long position let me show you condition number one we need to have a short signal printed from the PT Market Beacon now corresponding to this signal you want to look down here and the most recent histogram bar should be colored red this indicates that more Traders are closing out of their long positions suggesting potential bearish momentum also this white line should be under the
zero level to indicate that sellers are stronger than buyers which may put a downward pressure on the price finally you want to confirm that the money outflow value is at least 80% here we can see it's well above the 80% limit which means this is a valid entry set your stop- loss leveled with the bottom part of the short signal label the take profit can be set at 1.5 times the risk letting the trade run and it was profitable ladies and gentlemen the pine trades Market Beacon indicator is a private indicator to get access to
it you want to click on this link which is going to take you directly to this page where you're going to get a massive black Friday deal click on get access here we have the lifetime membership but let's start with the subscriptions the usual price was this but because of the 50% discount that you get because of Black Friday you only have to pay $33 a month and you're going to get access to all these features the chart prime plus has two extra indicators plus 12 new features and you also get access to all these
benefits now instead of paying this per month you only get to pay $58 basically half the original price now here we have the yearly pricing and you can explore it yourself and then we have the lifetime plan now if you already have the pro subscription you can upgrade to the lifetime plus where you get extra indicators and extra features for $799 so go ahead and check it out but for some reason if you can't purchase our indicators but still want to know how you can use the open interest inflows and outflows indicator in a strategy
well you can try adding a different indicator something like the andian oscillator this one by Alex Grover we're going to be using the default settings this second strategy even though per my testing was not as profitable as using the PT Market Beacon indicator it's still decent enough the conditions for a long position are almost identical you first of all want to have a Buy Signal printed from the andian oscillator a Buy Signal happens when this blue line crosses above the orange line so a blue line going above the Orange Line like this is a Buy
Signal and then a sell signal happens when this red line crosses above the orange line but this will be for a short position now once you have a Buy Signal like this the next conditions will remain the same you want the most recent histogram bar to be green you want this white line to be above the zero level and you also want the money inflow value to be at least 80% once you have those conditions met you take a long trade and of course if you want to take a short position you just reverse the
conditions ladies and gentlemen the open interest INF flows and outflows indicator is a powerful tool that delves beneath surface level price movements to reveal the underlying strength of Market participants by analyzing both open interest and price movements Traders can gain valuable insights into market trends they can validate potential breakouts and even anticipate Trend reversals this video is not Financial advice and I am not a financial adviser so do your own due diligence before investing with anything that's been it for this video I really hope you found some value if you did remember to leave a
like or even consider subscribing to stay tuned thanks for watching see you next time