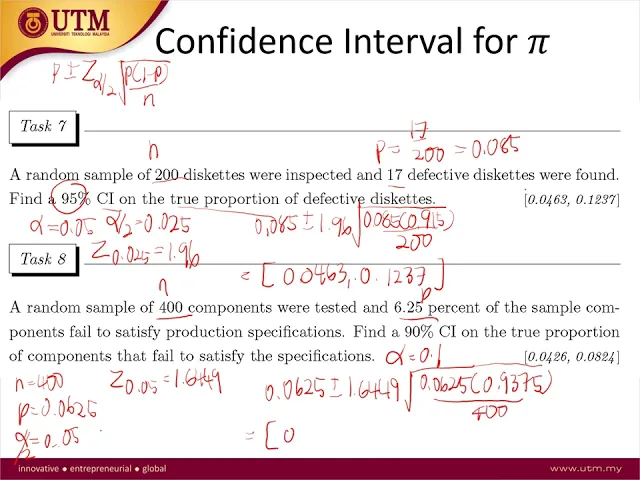
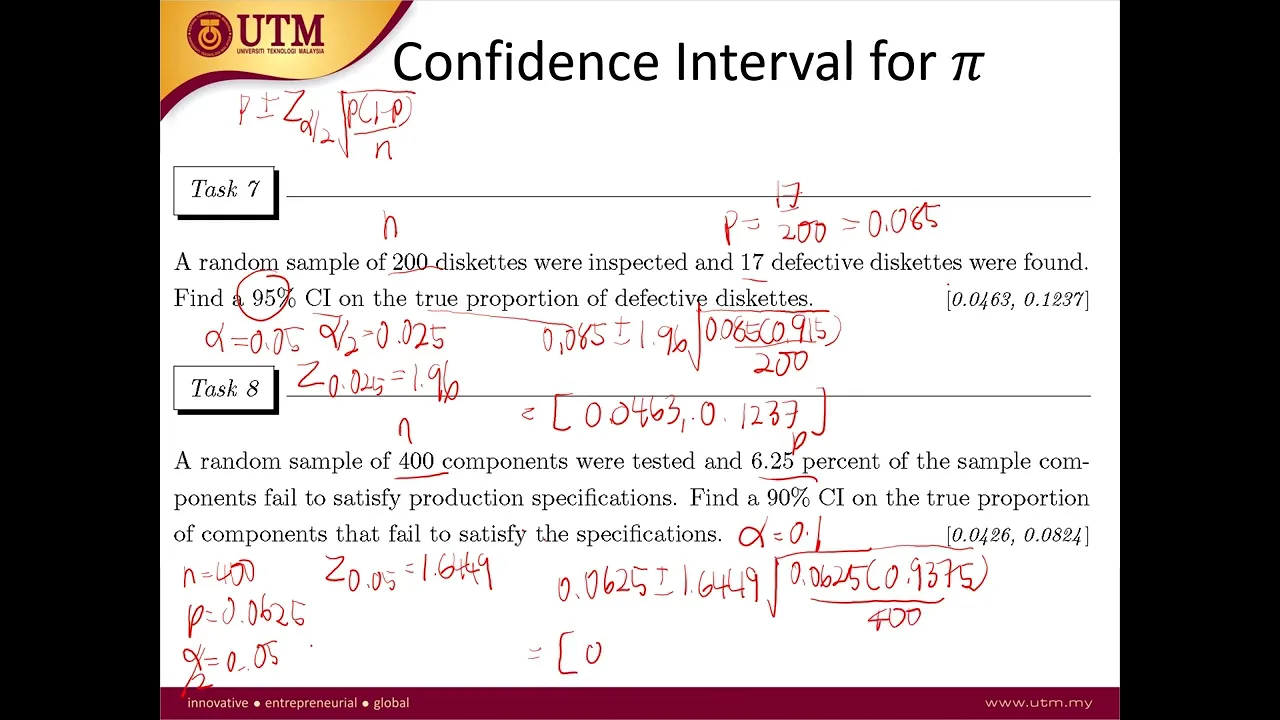
and good day everyone so um in previous videos okay you have learned how to construct the confidence interval for single mean and difference of two means all right so as you know for me we have cases single mean we have three case three cases and difference of two means you have five cases okay so in this video um we'll talk about the confidence interval for proportion okay here you see proportion we don't have any cases so we have a single proportion and difference of two proportions without any cases okay all right so we go to the single proportion first so if you look at your statistical table page 3 on the formula so the scope table page 3 the first Formula okay so the first Formula is z equals to P minus pi over square root of Pi 1 minus pi over n okay follows number Y is 0 and 1 okay so for this formula uh this is uh for single proportion formula okay so from this formula you need to rearrange as what you did for constructing the confidence interval for mean okay you have to rearrange the formula until you get um the confidence interval formula all right um uh okay so you need to rearrange the formula uh for constructing the confidence interval okay so [Music] um based on this formula we use Z distribution okay we use normal distribution okay so uh in proportion we don't have any cases and we use just Z distribution all right and you already know right how to construct the confidence interval you bring the denominator to this side will be uh z alpha over 2 uh times with this one actually times this one the denominator and then you bring this p in front will be P plus minus z alpha over 2 and then the square root okay so basically this is the the formula for single proportion and if you want to write in a simple way it will be P plus minus z alpha over 2 okay for the denominator you have Pi 1 minus pi over n right by okay by for a we don't know the value of pi we only know the value of P so you need to replace the pi to P okay so p plus minus z alpha over 2 and then here will be P1 minus B Over N okay so basically this is the formula okay now let's look at the seven okay that's seven a random sample of 200 discounts were inspected and 17 defective this cats were found find a 95 confidence interval on a true proportion of defective diskettes okay so for this question we want to find the confidence interval under two proportion okay we have n equals to uh 217 this cat will found defective okay so p in this case p is 17 over 200 okay which give you 0. 085 okay you need to find 95 confidence interval okay so if you still remember the formula is p plus minus z alpha over 2 square root of P 1 minus p over n okay this is the formula for single proportion okay so Unit B you need z alpha over 2 unit and N is 200 so now uh our Alpha is 0. 05 okay when Alpha is 0.
05 Alpha over 2 equals to 0. 025 so Z ero point zero two five from your table is 1. 96 okay so 1.
96 so from all this uh information then you can construct your confidence interval so here is 0. 085 plus minus 1. 96 square root of 0.
085 times 0. 915 over uh 200. okay so you will get 0.
0463 and 0. 1237 as your confidence interval so the lower limit is 0. 04 the upper limit is 0.
1237 okay so we can say that we are 95 confidence that the true proportion is in between 0. 0463 and 0. 1237 okay this is four times seven all right so now for task eight a random sample of 400 components were tested and 6.
25 of the sample component failed to satisfy production specification so this is your end this is your P okay find 90 so Alpha is 0. 1 a confidence interval on the true proportion of component that failed to satisfy the specification okay so the event is on the field to specify the specification so our p is our n is 400 p is 0. 0625 alpha alpha over 2 Alpha over to 0.
05 okay and zero point zero five is equals to 1. 6449 from your table four from table four okay so uh you can construct your confidence interval so it is 0. 0625 plus minus second Alpha over 2 is 1.
6449 square root of P 0. 0625 times 0. 9 375 over 400.
okay so you calculate you will get 0. 0426 and for the upcoming 0. 0824 okay so um from this task we are 90 confidence that the two the true proportion of component that failed to satisfy the specification is in between 0.
0426 and 0. 0824 all right okay this is for single mean okay sorry single proportion now let's go to the difference of two proportions okay all right so basically this is the formula and uh for this formula you can get from the second formula from page three statistical table from your statistical table page three the second formula okay okay so the same you rearrange you will get the formula like this uh okay plus minus La so if you don't want to write in a longer longer formula like this you can just uh write as P 1 minus P2 plus minus z alpha over 2 square root of P1 1 minus P1 and 1 plus B2 1 minus P2 and 2. I like this okay it's up to Eula either way okay now let's look at the question okay that's nine uh survey conducted by independent engineering education Research Unit found that among teenagers aged 17 to 19 20 of school girls and 25 of school boys wanted to study in engineering discipline okay so basically this is P1 this is your P2 suppose that these percentages are based on random sample of 501 school girls and one and 500 school boys so this is N2 determine a 90 this is your Alpha 0.
1 uh for determine a 90 confidence interval for the difference between proportion okay proportion of all school girls and all school boys who like to study in engineering disciplines okay so the formula is P1 minus P2 plus minus the alpha over 2 so P1 1 minus B1 and 1 plus B2 1 minus P2 and 2. okay so it just 0. 0.
2 minus 0. 25 plus minus the alpha with two alpha over 2 so Alpha over 2 is 0. 05 1.
6449 and then you have 0. 2 0. 8 over 501 plus 0.
25 . 75 angle 500 okay so it is you calculate you calculate using your calculator you will get minus 0. 0933 and minus 0.