In this free video course, you will learn everything you need to know about liquidity for trading stocks, crypto, forex, or any other financial market. By the end of this course, you will not only be able to trade liquidity concepts like a pro, but you will also learn about multiple advanced liquidity and order flow techniques that most traders don't know about. All right. So, hello guys and welcome Everyone to this full course on liquidity and how to trade liquidity concepts. Liquidity is one of these terms that get thrown around in the trading community a lot and
it's a term that is misunderstood by so many traders, especially beginners. And from my experience, even many trading educators on places like YouTube or elsewhere are [snorts] also misunderstanding liquidity or explaining it in way too complicated terms. So, my Goal with this course right here is to break down liquidity in as clear and simple terms as possible so you can become a trader and start making more money. But now then, let's real quickly take a look at what you can expect to learn in this trading course. And here, the very first thing you need to
know about to master liquidity is the three order types. And you also need to understand how they create every move on the chart. So this is the very important Foundation that you know the course will build upon. We will also of course talk about what liquidity actually is. When you know what liquidity is and the main order types, we are ready to move on here and take a look at something known as buy side and sellside liquidity or in other words BSL and SSL. And we will also take a look at why the price or
to be more precise why smart money often hunts liquidity. After we know about buy side and sell side liquidity and some Other stuffs uh stuff, it's finally time to take a look at some specific price patterns. And I'm talking about liquidity sweeps, liquidity grabs, and liquidity runs. These are three specific liquidity patterns that you can start uh that you will know how to trade after this course. Uh the next step here is to move on and take a look at something called bar value gaps and we will actually also touch upon orderflow tools and orderflow
is basically when we look Inside the candlesticks we read you know what happened and what created the candlesticks. We will also take a look at a concept called a liquidity heat map. Uh but these concepts are a little bit advanced. So what I do highly highly recommend in this course is that you watch the chapter uh chapters in order because I have built this course in a uh you know very sort of stepbystep manner as you can see on this image right here. So each chapter will build upon uh the Previous chapter. So, I highly
recommend to watch the chapters in order, but if you want to jump around, maybe rewatch a part uh and so on and so on, I will make sure to include YouTube timestamps/chapters so you can jump around in the video. Uh, but now guys, I highly recommend that you put this video in full screen. Uh, you know, remove the distractions, maybe put your phone in another room or do what you need to do. Maybe grab a Coffee. I also recommend to grab a notebook because this you know you really want to be focused throughout this whole
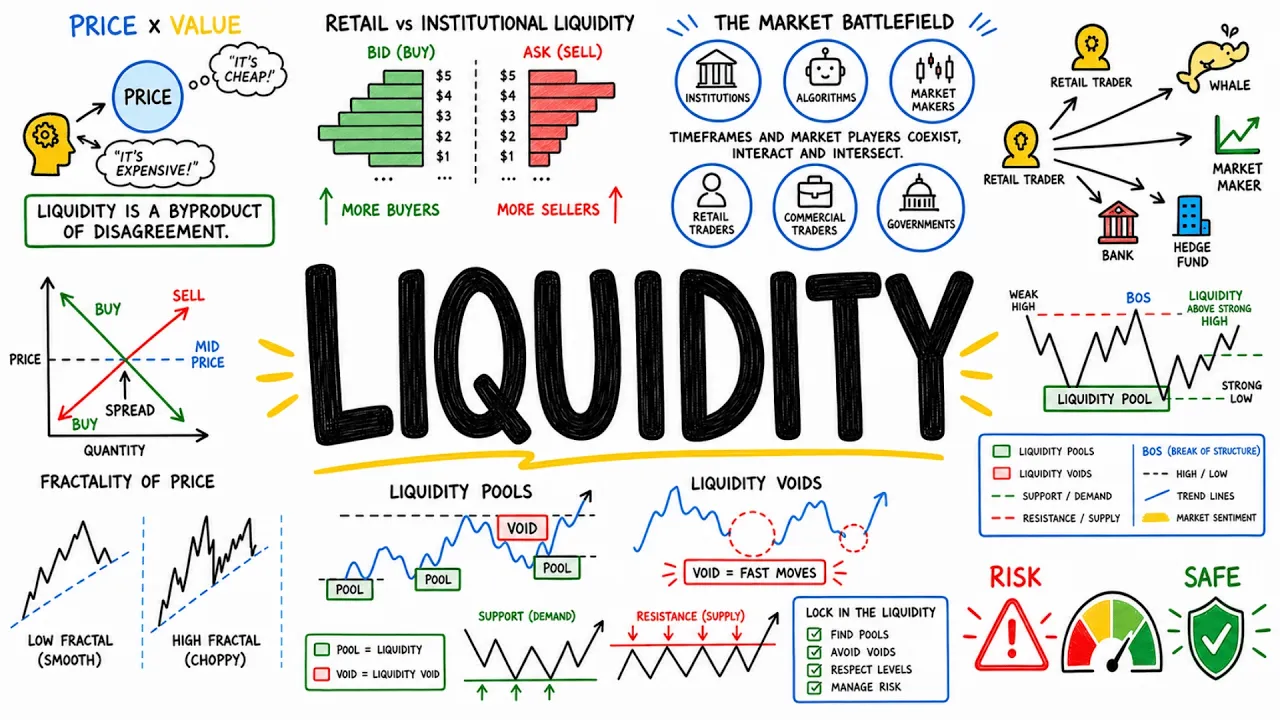
course. So remove all distractions and then we are ready to move here to chapter one. All right. So now before we can start trading using liquidity and liquidity concepts we of course need to answer the question what is liquidity? And here liquidity is one of these terms that can be hard to understand in the beginning but I will Try my very best to uh explain these terms in super simple terms. So in very simple terms liquidity is simply [snorts] how easy it is to buy or sell something quickly without moving the price. So one sort
of way to think about this is you know if you look at this image right here I try to really demonstrate the difference here between uh a sort of high liquidity uh you know in real life market and a low liquidity in real life Market. So if we have a for example a farmers market like like we have here to the right you can see that we have many buyers and sellers that are buying and selling all the time and because we have you know trading happening all the time that means that the prices will
stay around the same because of competition. So no one can come in here and sell I don't know tomatoes for $100 a piece. that doesn't really work because there will be other sellers that sell it for Much less and so on and so on and one big buyer can't really come in and buy everything in the market. So the price will stay much more stable and it will be easy to buy and sell stuff. But if we instead look at the image here to the right, this is what I try to to show an example
of a low liquidity market. So if we have for example an antique shop where we maybe only have you know one buyer and one seller at a time this means that the price will you know first Of all move much more slowly. we will have fewer transactions, right? But what it also means and this is very important is that if one buyer comes in and let's say this buyer really wants this vase right here, he can actually affect the market himself. Maybe, you know, the seller realizes that that he really wants the vase and he
can then, you know, increase the price of the vase and only sell it uh, you know, for [snorts] higher prices. I hope this gets a little Bit intuitive understanding of what liquid high versus low liquidity. When you think about high liquidity, think about lots of buyers and sellers and that the price moves more smooth like right here. And when you have low liquidity, think about less buyers and sellers and more, you know, uh they can affect the price more easily. So here the more buyers and sellers there are at every price the more liquidity and
the smoother the price moves. So think about It like this high liquidity equals price moves more smoothly. Low liquidity means price jumps in big chunks. And here and this is very important and you will learn about this throughout the course. most traders are the liquidity that smart money uses. So, so smart money traders are basically the the big boys, the traders with lots of money like hedge funds, banks and so on and so on. And we will talk about later on in this course how these traders can actually Manipulate the price to take advantage of
you and your liquidity. But for now, you don't need to worry about that too much because I want to jump into trading view and show you an example of low versus high liquidity. All right, guys. So, now we are in trading view. And I actually have two charts up right here. On the left, you can see that we have uh the Bitcoin chart open and we are right now on a fivem minute time frame. So, every Candlestick represents five minutes of trading. And on the left here I have a much smaller cryptocurrency known as a
Jasmi. And we are also here on the fiveinut time frame. But the reason I chose these two charts right here is simple. This chart to the left is an example of a high liquidity chart. While the chart here to the right is an example of oops a low liquidity chart. And how can we see this? Well, the first sign that I hope you can see, let me Make this chart a little bit bigger, is that the price to the left here on the uh uh high liquidity chart is much more smooth. You can see here
every candlestick looks like a normal candle. You can see here to the left all the candles looks normal. We have you know uh some candles with big bodies. We have some wicks right here for example like shooting star. But if you look at the low liquidity example, I hope you can see that the candlesticks looks like you Know very ugly to to put it blunt. You know the candles are looking ugly. And what you will also see if we zoom in here is that you will see many candles that look for example something like this.
You can see right here we have two candles that are just lines. This right here is a classic example of very low liquidity because this means that during this time pretty much no trades were executed. Maybe a few trades but not enough trades to actually move the Price. So very low amount of trading. And what you also can see is that we have these gaps. When we have gaps on the fiveinut chart, that is a clear warning sign that we're talking about low liquidity. So this is a tip I can already give you guys that
when you see a chart like this when you have many ugly candles uh you will have many candles without wicks for example right here you will have many candles that are used lines for example right here this Is an indication of very low liquidity and these markets are in general both much harder to trade but they are also much easier for people with lots of money to manipulate. So my tip here for most beginners is to really try to avoid low liquidity markets right here and focus on high liquidity markets when we have you know
nice and smooth price action. All right. So now then now let's take a look at the three types of orders every single trader needs to know about. You know, if you want to make money trader, you of course need to master the ways in which you can trade. So, let's take a quick look here at the main order types. And the first order type is a pretty simple one. This one is called a market order. And this simply means that you trade immediately at the current price or in other words, the best available price. So
here to the left here I try to you know in a visual way demonstrate all the main order types. So The market order simply means to trade now at the current price. And you can see in this image right here the current price here is in the middle in the middle. So a market order uh if this let's say this is a stock that is currently trading at $100. If we uh if we make a buy market order, that means buy right now for one for one uh for $100. And if we make a sell
market order, that means that we want to sell right now for $100. It's super super Simple. Uh the next order type here is the limit order. This is a very common order and that means that you uh trade at a better price than the current price. So what do we mean by better price? Well, when you are a buyer, let's think about it. When you are a buyer, you of course want to buy for as low as possible. You know, that is just a general principle. If you go to the supermarket, you rather want to
buy cheap groceries than than Expensive groceries. So, a buy limit order is always set below the price and the opposite is true for the sell limit order. So, as you can see right here, uh if the price once again is at 100 and you place a buy limit order, you always place it below the current price. So, maybe you place it at 96 or 97 or maybe 95, but no matter what, you will always place it below the current price. However, a sell limit order is always placed above the current price because When you sell
something, you always want to sell it for, you know, as much as possible. The more the better. So a sell limit in this case if the price is at 100 might be placed at you know 102 103 or maybe 104. The next order type right here is known as the stop order. And uh this is one I think this is the order that is hardest to understand but it's still you know if you just pay attention here I really hope I can explain it because it's basically just the opposite Of a limit order. So what
do I mean by this? A stop order is a trade that is at a worse price than the current price. So this is when we buy above or sell below. And these orders are actually uh invisible until they are triggered. So for example the the the most common stop order is a sell stop order or in other words you can think about it as a stop loss. So this is when we sell below the current price. So let's say that the current price is 100 and let's say that We already have we already own a
stock of 100 but maybe we have done you know our analysis and we know that you know if the price goes down to 95 we no longer want to hold this stock. So here we actually place an order that if the price goes down here to to 95 we will automatically sell. This is what a stop order is. It triggers uh you know when it comes to this price and then it becomes a market order. And here the opposite is true for the buy stop. So uh This is when we you know buy something when
it is at a you know higher price or in other words a worse price. And you might think about, you know, why would I want to buy at a higher price? Well, maybe you did some, you know, technical analysis and you uh the price maybe is right now at 100, but maybe your analysis says that if the price goes above uh maybe we have a resistance right here at 105, maybe you want to buy the breakout of 105. So that can mean That you don't want to buy at 100, but you want to wait and
if the price goes above 105, you actually want to buy. I hope this makes sense. Sometimes it makes sense to buy at a higher level, even though that is a worse price. So a key takeaway here that you can write down in your notebook, I hope you guys have your notebook up and and running, is that your stop-loss in a long trade is a sell stop. And uh I can also say that your takerit is a sell limit. Right? And in short trades, a short trade is basically when you make money from the price going
down. These two are flipped. Right. Okay. So now let's jump back into trading view because I want to show you guys a quick example of the different order types and how we can actually practice trading in trading view. Uh but before I do that, I just want to mention that if you for some reason don't have Trading View yet, you know, Trading View is the platform I use For all my technical analysis. I have been using it for so so long, way over 5 years. Um if you want to get started with Trading View and
try out Trading View Premium for free, I do have a special link, the link will be both in the description and the pin comment. And if you use that link and then later on decide that you want to continue using Trading View Premium or any Trading View plan, you will get a $15 bonus. So, if you don't have Trading View yet, make Sure to check out the description. But for now, to show you guys the orders, I actually want to go up here to the upper right corner corner and I want to press trade because
here you can see inside Trading View, you can actually connect to many different brokers uh and trade inside Trading View. But for now, I just want to show you guys how the orders work. So, I want to use paper trading. Paper trading is basically when you when you practice trading using uh sort of Fake money or paper money here inside Trading View. It's a great feature of Trading View where you can just practice your trading skills basically for free. So, what I did was I clicked connect right here. I can uh minimize this panel. And
now you can see that we have first of all a buy and sell button that appears up here in the left uh upper left corner. And we also have a trade button down here. So you can press either of these. I'm going to press the Trade button right here. And now you can see that we have a sort of uh order window appearing right here. So here you can see that we have the orders we talked about. We have the market order which means that we buy right now at the current price. we have the
limit order which means that we set the price either uh below or above the current price. So for example, if we have a buy limit order remember then we want to set the limit order below the current price. So You can see here on the price for Bitcoin the price is right now at as you can see 80,000. So if we set a buy limit order we need to set it below 80,000. So we can for example set it at you know 70 75,000. So if we click buy right here then we have a uh
right now a buy limit order at this price. Then what we can also set is as you can see right here we have something known as takerit. So this is this would be our target Level if and when this buy limit uh gets hit and then we have a stop loss which is the level where we will automatically sell. So in this case it means that if the price goes down to our buy limit we will buy and after that when we have bought it means that if then the price goes up to this point
we will sell or if the price goes down to this point we will also sell. This will determine if we make a profit or a loss. And here remember to confirm the order we need to Click confirm right here and that will lock in our order. To see your current orders, you can go down here to where it says paper trading right here. And you can right now then you go to orders and you can see that we have this uh we have this limit order that we set at 7075,000. And if this one gets
hit, we have this uh stop-loss and takerit set as well. Uh but remember, let me put this one down right here. Remember [clears throat] That we can also set for example a uh a stop order. And remember, if we have a buy stop order, this order needs to be above the current price. It means that if the price goes up to, for example, let's say we don't want to buy until, let's make it a little bit more realistic. Let's say we don't want to buy it until the price goes above the high right here. I
hope you can see. Then we can set a stop uh uh a buy stop order here at maybe around uh 83,000 Right there. Then we press buy right here to lock in the buy stop. And if we want to, we can also create a takerit and a stop-loss of this order as well. But yeah, I hope this demonstration was helpful and that you now understand uh limit orders, stop orders, and market orders. If you don't really understand it yet, don't worry. Feel free to rewatch this part or if you have any questions, of course, let
me know down in the comments. All right. So, now it's Time to take a look at the order book and the rules of price movement. If you really want to understand how the price actually moves, this is something you can't do without as a trader. So, really, really pay attention to this slide right here. But first of all, the order book has three columns or most order books have three columns where you have the price in the middle and then you have the bid uh the bid side which is the buyers or in other words
it's Limit orders by limit orders and then we have the ask side which is sell limit orders on the right. All right. So now let's take a look at how to read the order book. So, first of all, we have the bid side or the buy side, which is this whole green side right here. And then we have the uh sell side or the ask side, this whole red side right here. And the first columns here are the buy and sell column. And this is basically the prices. So to read this you can see That
the first buyers want to buy here for 2,842 and the volume is how much people want to buy for this exact price. So to read this is that uh people want to buy 1,452 at the price of 2,842. So uh that is how what people want to buy. And on the sell side, we can see that people want to sell for 2,850 with a total amount of 647. And then this goes on and on and on. So uh a little bit a little bit lower People want to buy for uh 2840. How much do people
want to buy? Well, a total of 2,635. Sales side is the same and so on and so on. people want to sell for 2,852 and the total amount here is 1,179. And this right here goes on and on and on. And here if you look down to this part of the image, you can actually see a visual representation of this. So the bid depth here, this is the market depth. So the green side is basically How many limit orders uh you know the price needs to go through to get to a certain point. So in
this case if the price were to fall from 2,840 down to uh let's say 2828 the market need to push through all of these buy limit orders, right? All of the the green side are buy limit orders. And if the market wants to go up or in other words, maybe let's say push up to 2,864, the market needs to eat up all of these Sell limit orders. So the bid depth is buy limit, the ask depth is sell limit. And here one very important term you need to know about is the bid ask spread. And
this is simply the gap between the highest buy and the lowest sell. And there are certain traders known as market makers that that try to make this gap uh as small as possible and they actually make money from that. It's a little bit outside the scope of this video, but super interesting. But In this case, if we take a look at the spread right here, if you look at the buy side and sell side, uh can you guys tell me the spread? Well, remember the spread here is the gap between the buy side and sell
side. So, in this case, uh the gap between 2842 and 2850 is simply eight, right? It's eight. Why? Well, the math is very simple. 2850 minus 2,842 is just 8. So in this case we have a spread of let's say $8. And here I Already mentioned this the market depth here is basically how much volume that sits on each price level. And uh a term you also need to understand is that a deep book means high liquidity. So when we have you know lots of orders right here we call it a deep book. But if
we have a a thin book that means that we don't have you know we maybe instead of a mountain like we have right here. Imagine if this graph instead maybe looked something like here. That means That we have a thin book which means that it's easier for for people to push the price up and down which leads to a more volatile volatile moves. Right? If it's easy to push the price up and down, the market will be more volatile. Volatility you can think about is basically uh you know how much uh how big the swings
up and down are in the market. So this right here is an example of a volatile market while a market that moves more something like this would be An example of a you know less volatile market. But here and this is very important the core rule is that the price moves when market orders overwhelm limit orders because and this is super important to understand because think about it how does the price actually move? Well, the limit orders will not move the price because the limit orders just uh will just sit here in the order book.
But to actually move the price, we need to either start eat here from the Uh from the buy limit orders or we need to start to eat here from the sell limit orders. And to do that, we need to use you know market orders. So we basically take liquidity from the order book. And a consequence of this is that price basically stalls when limit orders overwhelm market orders. But right guys, so super quick just to show you guys a live order book and also a sort of live view of a depth of market. Uh I
just want to jump into Bybit real quick here. And by the way guys, if you trade crypto or thinking about trading crypto and want a sort of jump start, I actually do have a special link to buy bit. Uh the link will be both in the pin comment and the description. And you can use that link to get, you know, bonuses the more you trade. Uh you can get up to $30,000 in free bonuses, but most traders will not get that. Uh but I do think around 80% will get $100 free. So if you want
some free uh bonuses while you're Trading crypto, feel free to check that that link out. But here, as I said, I just wanted to show you real quick an example of an order book. So, for example, right here you have the order book, right? You can see the buy side. So, the green side right here are all the buy limit orders that are currently in the market. And you can see that this changes all the time because we're right now looking at a live market of Bitcoin. So, the orders are changing all the time And
people are putting market orders uh you know both on the buy side and the sell side. So they are sort of eat eating from each other and this is you know how markets work. You can for example in this in this case you can maybe see some interesting things. For example you know when we have sort of more flat uh periods like right here during these periods it's less sell limit orders. So it's easier for a buyer to move the price. But then we also have The sort of walls like right here. That means that
we have lots of sell limit orders. uh but it's hard to show because the market is moving all the time. Uh but I hope this was a good you know simple uh live demonstration of how how uh the order book and depth of market can look like. All right. So now it's time to take a look at buy side and sell side liquidity or in other words BSL and SSL. And don't worry if this sounds a little bit complicated it's actually Very simple. So what is buyside liquid liquidity? Well, buyside liquidity is simply the cluster
of buy stop orders that are usually above swing highs. So these are basically stop- losses from shorts and breakout entries from longs because remember here what a buy stop order is. A buy stop order is when the price goes above uh a certain a certain level, it triggers buy orders. So, as I said, this can either be, you know, from people that want to buy uh when Something maybe breaks a key level like a swing high right here. Uh or it can be short traders because because people that are going short that are betting that
the market will go down, they actually set their sort of stop-loss to the upside. And when the shorts stop losses get triggered, it leads to buying pressure. But here the opposite of buyside liquidity is sellside liquidity or for short SSL. And this is basically the cluster of sell stop orders below a Swing low. So this is uh you know often normal stop- losses from longs but also uh it can also be breakout entries from shorts. But the most simple way to think about it is that many traders, let's say we have a low right here.
Many traders that just bet that the market will go up will often place their stop-loss orders below a key uh low level, right? Uh like right here. So if the price then falls below this level, these stop-loss orders get triggered and it leads to more Selling pressure. And that is what I tried to demonstrate with with this image right here. So imagine this is a market. Maybe it looked like something like this before. We have a nice trading range. Uh so here we have, you know, a swing low. Here we have a uh you know
a swing high. What will often happen with this swing high and swing lows is that just above the swing high, we will have a cluster of buy stop orders. And remember these orders uh if the price Goes to this price, it will lead to more buying pressure. And the same thing with the opposite is true with the sell stop orders. Below key low levels like right here we will often have many you know stop losses and when a stop loss gets triggered it leads to selling pressure. So you can think about uh buy side liquidity
as sort of hidden buying pressure if the price goes to that level and you can think about sellside liquidity as hidden selling pressure if The price goes to that level. But here and this is very important smart money remember smart money is you know big traders like big banks and hedge funds they will actually often target these levels. So they will on purpose try to drive the price to these levels because if they get triggered it creates a wave of forced market orders. So if we try if we trigger buy stops it leads to forced
uh buying pressure right and if we trigger sell stops it leads to forced Selling pressure and this provides uh the liquidity that the smart money need. So many times what smart money will do and we will talk about that later. Let's say that we have a key level right here. So the smart money knows that we have many buy stop orders above this level. What they can then do is that they can uh on purpose push the price into these buy stop orders which lead to more buying pressure and the smart why does the smart
money want to see buying Pressure? Well, many times what they do is that they do this when they want to sell because they want extra buying force that they can sell into because they have so much to sell. Remember smart money have so much money. So they need this buying pressure to a to be able to sell. And this right here is actually a kind of setup I will talk about later on in this course that we as traders can take advantage of to trade and you know hopefully as a result make More money. And
here a key takeaway from these slides is that stops whether it's buy stops or sell stops are you know relatively predictable. We can't know exactly, you know, all the buy stops and sell stops uh most of the time, but we can look at the chart and try to figure out where is it most likely that we have many buying stops and where is it most likely that we have many sell stops. All right, so now let's jump back here into trading view. We are still here on a Bitcoin chart and we are on the daily
time frame. So every candlestick on this chart represents one day. Uh but now let's try to see if we can find you know some buy side liquidity and sellside liquidity on this chart. And remember here buyside liquidity is often found above key you know swing highs and swing lows. So the best example on this chart I can see this is such a good example is that if you look right here we actually had not only one high two high but three Highs. And this was the all-time high for Bitcoin. So this is a level that
so many traders are trading. So many traders are paying attention to these levels. So many times there will be a lot of orders around these levels. So we can pretty safely assume that you know above this level right here we had you know many uh buy stop orders. So remember if the price reaches that level it can lead to buying pressure. So maybe right here, you know, in this case, Maybe right here when the price came up to this point right here, maybe this led to buying pressure and maybe that is what smart money took
advantage of because remember what I talked about many times the smart money want to trigger the buy stop orders and then reverse the price to the downside. So it looks like this was maybe what happened right here and I will actually return to this later on in this course. What you now need to understand is just that Above this these very important levels like right here we often have many buy stop orders and also right here we probably have many buy stop orders and so on and so on. U but the opposite is of course
of course also true. If you for example look right here it's very possible that we had many sell stop orders below this key low and maybe that is what led to the wick right there. Who knows, right? But a more clear example of sellside side liquidity. This is a General tips for you guys that if you want to find real buyside and sellside liquidity, it's often good to focus on the most significant levels, the levels that are sort of clearly visible on the chart. So, for example, if we look at this price movement right here,
this was the brutal crash. uh the date was it was back here in February when Bitcoin dropped like you know 14% in a day you can see that we had you know so much volume as well right you know brutal Brutal day for absolutely brutal day for Bitcoin but when we have these uh moments in time uh that are super clear and that many traders are pay attention to these are the levels where we where it's most likely that we have lots and lots of uh liquidity so I would not be surprised if we have
lots of sellside sign liquidity below this low right here. So if the price eventually goes down to this level, it's very possible that we have so many, you know, Stop-loss orders getting triggered and this usually leads to very interesting price action. But what I can also just mention is that one factor to have in mind is that the longer time it goes from the price getting triggered. So if we wait for a very long time before this uh level gets triggered, it can actually affect of course you know the sell side liquidity below this level.
All right. So now it's time to take a look at the liquidity sweep, the liquidity grab and The liquidity run. And these are actually three specific liquidity patterns you can start trading relatively quickly. Uh but before you can do that, we of course need to learn about the patterns. What are the different patterns? Well, let's begin here with the liquidity sweep. And the liquidity sweep is when price relatively slowly breaks a swing high or swing low. And it basically traps breakout traders and then reverses sharply. So you can Think about it as a more slow
and deceptive trap. And to understand why the price moves like this, we of course need to think about, you know, what happens above key levels. So if this right here was the key level from before, you already know that when the price break these levels, first of all, many buy orders will come in from people trying to buy the breakout. Many traders see the price pushing above the key level and buys. That's that leads to Buying pressure. But remember here that we also have short traders that have their buy stop orders above this key level.
So when the price pushes into these buys stop orders, it leads to even more buying pressure. So that is the first part of the liquidity sweep. You know, lots of buying pressure and that is what pushes the price all the way up to this point right here. But what then happens with the liquidity sweep is that smart money sees all of this buying Pressure or they actually you know on purpose push the price into this level to to get you know the buying liquidity so that they can sell and this usually leads to a sharp
reversal here to the downside. In simple terms, the smart money starts the selling pressure here. But once the price uh really start to fall, we will actually see the traders that try to buy the breakout right here, remember they have their stop-loss orders here to the downside. So once the Price really start to fall to the downside, many normal stop-loss orders will get triggered and this leads to even more selling pressure. So that is, you know, roughly how the liquidity sweep plays out. The next pattern, the liquidity grab, is a relatively similar pattern. It's actually
very similar to liquidity sweep, but the main difference here is that the liquidity grab is much faster. It's usually a fast and strong wick that pokes through a level and then Immediately reacts. So you can think about uh a liquidity sweep as a slow liquidity grab or a liquidity grab as a fast liquidity sweep. That is the main difference. U and the liquidity grab is often, you know, a more obvious manipulation. As I said, the liquidity sweep can be a little bit more tricky and in many times the liquidity sweep can actually be harder to
trade. But if you look at the example of the liquidity grab right here, this is a brutal Example, but you see we have a key level right here. Then the price pushes above the above this levels. Many new buyers are coming in. Many buy stop orders are getting triggered which push the prices all the way up here. But then someone or you know multiple people take advantage of this move and start selling which then leads to this selling spiral to the downside. But here last but definitely not least we have the liquidity run and this
is when the price takes the level But keeps going. So a liquidity run is more similar to a real breakout. So this is when we are not seeing the trap. So here we have an example of the liquidity run. We have the same level right here. But here you can see that the price breaks the level and then continues to the upside. So once again you can see that we want to see the the candle that breaks the level. We want to preferably see this candle being larger compared to the previous candles. Uh in other
words, We want to see a momentum candle. I have a rule that momentum candles I want to be, you know, I want the real body of the momentum candles to be at least twice the size of the previous candle. So there's a good sign. And another sign that we have a liquidity run is that if we have the candle close, if the candle closes far above the liquidity level, that is one sign that we might have a breakout instead. Uh another sign is that you know for Example here on the liquidity sweep you can see
that we had a candle close bar above but we have a pretty high wick while in this example right here we have you know a pretty small wick. So there's another thing to pay attention to if we uh want to find a liquidity run. We want the wick to be preferably small. So here in very simple terms, the sweep here and the grab give you a reversal trade opportunity while the liquidity run tells you the trend is real and it also Give you a breakout trading opportunity. But right so now let's once again jump into
trading view here. I want to show you guys examples of liquidity grabs, liquidity sweeps, and also liquidity runs. So, first of all, I once again want to go back here to the all-time high example of Bitcoin because this is, you know, such a clear example. So, here, first of all, you can see that Bitcoin created a new all-time high right here. We printed a new all-time High on July 14th, 2025. And when we create a new all-time high, that is, of course, a very important level that many traders are paying attention to. So, we can
draw out the level right here. And because this is such an important level, we will of course have many buy stop orders above this level. So above this level, we have tons and tons of buy stop orders. And what we also have is of course that when or if the price pushes above this level, many traders will Think that this is the price is breaking out. You know, the price is going to the moon. So this will lead to even more buying pressure. So when we uh so when the price as you can see we
pushed down but then the price came back to this level and hopefully you can see it's a little bit clustered but we pushed up a bit here. So we got lots of selling pressure coming into that level but apparently so many traders took advantage of this Buying pressure and the price immediately reverse to the downside. So this right here is you know pretty much a liquidity grab. I would say it's a liquidity grab because the price, you know, wicked. You you can see above the level, we only have a wick and then we immediately reverse
to the downside. If we then look a little bit more to the left, you can actually see that this pattern played out once again here. We we had a new all-time high. So many Traders that you know shorted the market right here. They probably have their buy stop orders above this level right. So we have a buy stop order right here. You know you can think about each of this line as thousands of buy stop orders. Then the price was you know consolidating for a while. We went down once again up and down a bit.
But then Bitcoin made another attempt to try to break out. And you can see in this case we actually tried during two candles. During two candles the price tried to push above. You can see right here we wicked above and closed below. Right here we wicked above and closed below once again. So the price really tried to push above and we apparently got lots of buying pressure. We managed to create new highs but you know before the candle closes the sellers took control once again. So this is once again an example of where smart money
took advantage of the buying pressure and pushed the price Down. And then in this case we had this strong red candle that was really the nail in the coffin. Uh this is what what is known as a confirmation candle confirmed uh the selling pressure and uh the liquidity grab. And because this was a multiple candle pattern, one could actually argue that this was more like a liquidity sweep, right? This this was more like a liquidity sweep, while this pattern uh right here was more like a liquidity grab. But as I mentioned Earlier, the sort of
uh difference between a sweep and a grab is, you know, not super clear. You might be confused about this. Maybe you have tried to learn about the grab and sweep before, but in general, it's not a big difference. I would say that the grab is more quick, the sweep is a little bit more long. Uh but the the principles of both patterns are pretty much the same. But now let's also take a look at a liquidity run. And here I have a super Clear example. I really like this one because it's so clear. So if
you take a look at this chart right here, now we're looking back a bit more on Bitcoin. But you can see that this was a long sort of consolidation area and we had you know resistance coming in not only one time, two time, three time you can see multiple multiple times this was a super clear resistance. So what we can do here is that we can use our uh you know rectangle tool because support and Resistance levels are you know in real markets they are often not lines in real markets they are acting more as
zones. So, when I draw my support and resistance levels, I often use this tool right here in Trading View. And as I said, I can remind you guys once again that if you for some reason don't have Trading View yet, I do have a special link. You will get Trading View Premium for free. You will get a $15 bonus. The link is both in the description and the Pin comment. Make sure to check that one out. If you for some reason don't have Trading View yet, but I think if I I hope you have Trading
View at this point, but we can drag out this level right here. And remember because we have so uh because this is such a clear level you know everyone can see this level super clearly. It often means two things. First of all people that have been going short usually have their stop-loss orders their buy stop orders Above this level. So we have many buy stop orders above this level which remember if the price reaches this this level it leads to increased buying pressure. And what we also have is that we have normal traders that see
this breakout and when it breaks out they think the price will continue and that leads to even more buying pressure. And remember here I had a few signs that is you know good signs that we actually have a liquidity run. The first sign we Want to see here is that we want to see the candle strongly closing above the resistance. You can see this is the first time ever the price closed above this resistance. And what you also can see that is a very important nuance is that if you look down to the volume indicator,
you can actually see that we have lots and lots of volume coming in on this candle. Seeing lots of volume on a breakout candle is yet another, you know, key sign that we're talking about A real breakout, a strong breakout. So this right here, we had multiple signs that this was actually more probably a liquidity run than a liquidity sweep. But you of course still need to be uh you know careful because if maybe after this candle you can see if we saw you know selling pressure and a candle closing below the resistance once again
that is of course a clear sign that you know maybe this is just yet another you know slower liquidity sweep. All right So now it's time to take a look at external versus internal liquidity and inducement. And I know guys now the terms are starting to sound a little bit more complicated. So I will try my best to simplify this even more. I will try to make it as simple as possible. So first of all, external liquidity. What is this? Well, you can think about this as liquidity that bas basically rests outside the current range.
So for example, we have buy side liquidity Above the major highs and sellside liquidity, you know, below the major lows. And to make this even more uh simple, you can think about external liquidity as simply the most obvious levels, the most clear levels you can see on the chart. So for example, if you look at this image right here, you can see that I marked the external liquidity level with purple. So here we have the most obvious high on this image and down here uh let me actually draw this one Out a bit more clearly.
You can see down here we have the most obvious low. So let me delete my drawing so you can see more clearly. And what does this mean? Well, because this is such an obvious high, it means that we probably have lots of buyside liquidity, right? Lots of buyside liquidity above this high. And below this low, we probably have lots of sellside liquidity, right? But the important part to notice about this is that we also have internal liquidity. And internal liquidity is basically is basically the liquidity that sits uh you can think about it as the
liquidity that sits inside the range. So these are the minor swing points, the pullbacks, the highs and lows, the fair value gaps and so on and so on. And don't worry, I will talk about fair value gaps later on in this course. But you can see here for example below each of these small points right here we often have you know traders for example on the smaller time Time frames will also have uh you know put their stop losses for example below this point right here. So we might have some sell liquidity right here. We
might have some sell liquidity right here. Of course the same thing uh but the opposite is true on the upside. So we might might have some buy side liquidity right here. But the important part to notice is that these small swings are usually not as significant. So in general, what I like you to think is Just to if you really want to find the most important liquidity spots on the chart, you want to focus on the most obvious swing highs and swing lows. The the the points that really sticks out on the chart. For example,
the points I showed you guys earlier in the video when uh earlier in the course when we took a look at the Bitcoin example. But now I want to take a look at a specific example of internal liquidity and this is what is known as liquidity Inducement. What is liquidity inducement? Well, liquidity inducement is when we see a deliberate move against the trend that sweeps the as I said internal liquidity to trick traders in the wrong direction and then continue. So this is a sort of way to trick traders in one direction and then push
the price back up. So let me try to demonstrate this. So let's say that we have an uptrend like right here. We have a clear uptrend. But then we might have Let's say that the price goes something like this. Remember here that we do have we probably have some internal liquidity right here. Some internal uh sell side liquidity. So if the price pushes below this level, we probably get some stop-loss orders triggers and some extra selling pressure and smart money can actually use that as a sort of force. So the price goes down here which
is some extra selling pressure below these stop- losses and then the smart money can use This liquidity to then once again swing to a higher high. And as you can see, this trend is still printing uh you know external external higher lows. And what do I mean by this? Well, you can see we have one low right here. We have one low right here. And you can see that this low is still a little bit higher or at least I tried to draw it that way. A little bit higher than the previous low. So this
is still an uptrend. This right here is just an an internal swing point. And uh because of that, this is an example of internal liquidity. And a pro tip here is that internal liquidity, so the sort of minor liquidity tends to get taken first before the external. Remember here the internal liquidity is easier to take out than uh the more major and external liquidity. Okay, so now it's time to take a look at something called high resistance and low resistance liquidity. And this right here can in the beginning once again it Can be a little
bit complicated but don't feel uh don't feel overwhelmed of what you're seeing on the screen right here because once again I will try to really break this down in super simple terms and the first thing I can mention is that when we talk about resistance here we are not talking about talking about uh support and resistance we are rather talking about the strength of the liquidity. So first of all, what is low resistance liquidity? Well, low Resistance liquidity forms after a failure swing. So this is when the price tries to make a new high or
low and fails. So right here we have examples of low resistance buy side and low resistance sellside liquidity. So you can see in the buy example right here, the price makes a swing high, then it pulls back, but then it, you know, when it tries to make a new swing high. So what the price wants to do is make a new swing high right here. But you can see In this case, it actually fails and make a lower swing high. This is what what is known as a failure swing. And so this is a low
resistance buyside liquidity. So the liquidity will sit above this point right here. But because it is a low resistance buy liquidity it will be often at least most of the time it will be less liquidity and the same thing but the opposite is true for the sell side liquidity. So here so here remember the price goes down print a swing low it it Uh you know pulls pulls back. Now what the price want to do in order for us to you know have a downtrend is that it wants to print a lower low. Right? But
in this case it fails to print a lower low. So this is what it and it prints a higher swing low. It fails the swing. So this is an example of a failure swing. And below this swing point is where we have sellside liquidity. And as I said both of these low uh low resistance uh both buy side and sellside liquidity Tend to be weaker compared to the other type uh that we will talk about now. So now let's take a look at the high resistance liquidity. What is this? Well, high resistance liquidity forms after
a clean break or in other words, it's it's basically like a clean reversal when we have a you know a higher high followed followed by a lower low or vice versa. And I know that this can sound a little bit complicated but let me try to show it visually. I think This is easier. So this is in the case of the buy side. You can see that the price prints a swing high. Then it pulls back. Then it prints yet another higher high. Right? So in this case we print a higher high but then we
immediately reverse and print a low a lower low. So we print both a higher high and a lower low. And this is very important. You can see both a higher high. It's higher than this. But we also print a lower low. So higher high and lower low. And the Opposite is true for the high resistance sell side. So in this case the price goes down print a swing low it pulls pulls back then we print a lower low but then it immediately reverses to a you know higher high. So in this case we print both
one low and then a lower low and then one high and then a higher high. And this sort of pattern right here usually creates stronger buyside or sellside liquidity. So let me try my best to demonstrate a sort of more General picture. So let's say we have an uptrend. It goes like this, you know, trading up. In this case, this liquidity right here is low resistance sellside liquid liquidity, right? Because we have because the price failed to take out this low right here. Right? And right here we also have low resistance sellside liquidity. But if
you for example look at this example right here, here we have one of these cases when we have you know the price prints a higher High but then it immediately takes out the low resistance sellside liquidity here. So we have a low and then a lower low. And remember this is the high resistance buy side liquidity right? So this is high resistance buyside liquidity and the key idea here is that once high resistance liquidity is taken the price tends to travel toward the low resistance liquidity. This is what uh people call the path of less
proven uh defense. This is a more sort of modern Term term. But it is also important that these are not new concepts. For example, Livermore uh Livermore called this sw failure swings pattern out you know more than 100 years ago. So this is one of these examples where smart money concept traders and you know ICT traders are usually relabeling old concepts. But to get the idea uh here you know at our example remember we took out high resistance buy side liquidity and the uh the idea is that the price moves towards Towards the uh you
know less liquidity because that is easier that is easier liquidity to take right. So in this particular case, we have the low resistance sellside liquidity much easier to take out here than the high resistance buyside liquidity up here. And now I see a little bit too late that my uh that my camera was a bit in the way, but I hope you see the you know general concept of this image right here. Guys, don't worry if this doesn't Click immediately. It didn't click for me immediately either. So you know take your time and learn at
your own pace. Okay, so now the time has come to take a look at three important liquidity concepts. And I'm talking about equal highs, equal lows, and trend line liquidity. And first of all, let's begin here by taking a look at equal highs and equal lows. And this concept is very simple. This concept is that multiple swing points that are stack on the same Price often creates a deeper liquidity pool. Or in other words, we see more stops or cluster of stops that's that leads to more fuel when we actually reach these levels. So for
example, if you take a look at this image right here, you can see a very clear demonstration of an example when we have, you know, multiple multiple highs here coming in at the same level. And if you think about it very simply, remember above highs, that is, you know, by far The most common place to set your stop uh to set your stop loss. So think about it after the first high when we see the the price reverse. Many traders that went short probably set their buy stops above this level. So we already have multiple,
you know, stop- losses above this level right here. But then when the price once again goes up and test this level now multiple traders will realize that this is a double bottom pattern. So even more traders will try to trade this Pattern and bet that the market will go down. And where is the most common place to set your stop loss for a double top pattern? Well, the most common way is to set your stop loss just above the high. So now we have Oops. Let me still use the red color. Now you can see
we have even more stop- losses above this level. And if this continues, so let's say that the price once again goes down and once again comes up and test this level. Now This is starting to look like a very clear resistance level and more and more traders will pay attention to it. More and more traders will trade it as well. So as you can see it stacks up more and more. You can see more and more sort of uh buy stops or in other words buy side liquidity is stacking up above these highs which means
that when or if the price eventually pushes above this level the reaction often gets more strong and more violent. So that is what I'm trying To demonstrate with this image right here. when we actually tap into to the liquidity, the for example liquidity grab or liquidity sweep can be much more uh much more significant. And that is why I especially if you are a beginner trader and are just starting to trade liquidity, I highly recommend to start by trading these obvious levels that that you know many traders find and that multiple traders pay attention to
because you will you will be able to Find so much more clearer movement and you will really you know even be able to sort of feel the liquidity that can lie above these clean levels. Uh so for example, let's just quickly jump back into trading view here and to get a little bit of variation, let's actually move on to the fiveinut time frame and let's see if we can find any obvious levels right here. Uh by the way, the concepts I teach, you know, throughout this whole course, it doesn't really Matter what time frame you
use. If you're using the daily time frame, if you're swinging trading or day trading, the concepts can be applied on multiple time frames. Uh however it is important to notice that here the the shorter the time frame you use the less likely is that you will uh that you will find the sort of low liquidity environments that can be a little bit harder to trade. Um but let's see see here if we can find any obvious levels. So for example right Here super clear example you can see in this case Bitcoin really tried to p
push above you know a short-term resistance not only one time two time three time you can see multiple multiple times the price sort of pressed against the resistance right here. Uh so in other words, many traders probably have their stop losses above this level. And you can see that once the price eventually pushed above, you can see lots of buy stops got triggered which pushed the Price uh up even higher. Uh but then eventually the price rever reversed. This is a classic liquidity grab perhaps caused by by smart money. And let's see here if we
look even more to the left you can actually see that we we had some highs here from we had some historical levels. You can for example see the peak right here the peaks right here. So we can even argue that this was some sort of historical resistance level. So maybe we had you know buy stops orders from All the way back here that contributed to this uh liquidity grab right here. Maybe we have some stop-loss orders from all the way back here that contributed to the liquidity grab right there. and so on and so on.
But now the next concept I really need to mention is something known as trend line liquidity. And this is because you know these key levels we have been talking about so far are only horizontal levels. We have been talking about swing highs and swing Lows. But many traders use different kinds of tools. For example, trend lines. So we can also have stops that pile up below uh rising trend lines and above falling trend lines because you know many traders actually trade based on the trends and the trend lines rather than you know horizontal levels. So
a super simple example is that if we have you know uh let me use this color right here. Let's say that we have a trend line uh we have a trend right here. So The price moves something like this. It's very possible. You can think about it as that it's possible that we have sort of stop-loss clusters that goes, you know, along with this trend line. This is a way of setting dynamic stop-loss levels. And, you know, being able to master how to set your stop- losses and how to set your target levels is a
whole topic on its own. Uh but don't worry because I do actually have a full course on risk management where I Go over everything you need to set your stop-loss target level and multiple you know advanced and be beginner friendly uh techniques that I think every trader should know. Um I do have a full course about that and I will make sure to link that video up in the video card as well as the description. But here I hope you get the concept. The concept is still the same. So now if the price for example
drops below this level remember it's likely that we have multiple stop- Losses here. When we drop below many stop-loss orders will get triggered which lead which leads to forced selling. And this is an opportunity for smart money to create a liquidity grab. So we can find this sort of horizontal uh I mean this sort of sloping liquidity grabs as well. So don't underestimate trend lines. Um but however it is important to mention that these are often a bit harder to trade. So for beginners I recommend to focus on Horizontal levels. But this is still something
that you know is very important to have in mind especially if we have a very clear and easily visible uh trend line on a chart. So a very important lesson here uh the lesson is that any tool that produces a predictable behavior creates more predictable liquidity. So this concept works for for example chart patterns, ballinger bands, moving averages and so on and so on. If we have a tool that Creates uh you know predictable stop- losses, we as traders can use that in our advantage to trade the liquidity that these tools produces, right? And I
can also mention that you know if you want to learn about chart patterns, it can be super power powerful. I do have a full course about that and I will make sure to link that course up in the video card and the description. Also here, uh, the Ballinger band. Yet another powerful tool that I do have a video about and I Will link it up in the video card and the description. If you're new here to the channel, you will notice that I have so much free material here on YouTube. So, I really hope you
will, you know, not stop here. Uh, you know, your trading education is just beginning. Uh, but sorry about that tangent. Now, let's continue. One warning sign to pay attention to is that the cleaner the trend line, the more likely it is to get swept before the continuation or the More likely that people will take advantage of the of the uh liquidity below the trend line. But yeah, this doesn't really have to be a warning sign. It could also be an opportunity. You can, for example, trade the liquidity grabs or liquidity sweeps. Okay, so now it's
time to take a look at fair value gaps or for short FVG and another concept that is called liquidity voids and we can call it for short LV right here. Uh but let's start Here with the fair value gap. This is a very common term uh very common term in trading and it's a good pattern to to know about. You really need to know about this one but it's actually very simple and once again this is one of these concept that I feel like many people are over complicated. It's actually super simple. A fire value
gap is just a three candle pattern where the high of candle one and the low of candle three don't overlap. And this leaves a Sort of price gap that wasn't fully traded through. But this is a little bit oversimplified because in some cases we can actually have lots of volume in a fair value gap. But to demonstrate this, let's super quickly take a look at this image right here. So remember what I said a a fire value gap is simply when we have the high of the first candle. So the high right here. I hope
you can see the high right there is lower than the low of the third candle. So this is Candle one. Up here is candle three. And we have the low of candle three and we have the high of candle one. And the gap here in between is simply the fair value gap. And the theory here is that many times the price will actually go down some sometime in the future to test this gap right here. And if we get a price action signal, let's say we get a bullish engulfing pattern, uh this can often lead
to a bounce towards the upside. Uh however, you will notice the More you look at fire value gaps, the more you will notice the problems about the fire value gaps. Uh they can definitely be useful, but I think that many traders are overhyping them. um some gaps that can can actually be more significant is what we sort of refer to as a normal gap. Uh but first of all I want to talk about the concept of liquidity void or for short LV. And this is yet another term that is not in my opinion it's not
very greatly defined. From my learnings, a liquidity void is more of an umbrella terms for basically any area where price move fast with little resistance. So that is the so that is the you know concept behind a fair value gap. You know in this area the price have moved you know only once and only fast u and that is you know the sort of theory behind the the fair value gap but we have many different kinds of liquidity voids. So to be very clear, liquidity voids or for short LV is a an Umbrella term. So
fair value gap is a type of liquidity void. Uh oh, this is super ugly. But here a fair value gap is a type of liquidity void. But we have other types of uh liquidity voids as well. And one classic type is what we what we call a normal price gap or just gap. So here if you look up in the upper right quarter we have an example of a liquidity void created from a gap. And a gap like we have right here is simply when we had no trading at all happening Between uh you know
the high of one candle. So we have candle one right here and we have candle two right here. And you can see that there are no trading activity in this whole zone. So you can think about this as a strong version of a fair value gap. This type of gap is much more rare compared to the file value gap and it pretty much only appears in markets when we we don't have any trading overnight. And you might wonder why do gaps appear? Well, things Can happen during, you know, uh non-trading hours. For example, let's say
that during the weekend, as I'm recording this video, there's lots of, you know, uh the the U the US and Iran is pretty much in war and we have lots of news coming out over the weekend. So, let's say we have, you know, negative news that, you know, maybe oil prices are spiking and so on over the weekend. This can lead to the stock market prices, you know, gapping down. So, we Might have a gap down or if we have positive news, we might have a gap up. But these kind of gaps doesn't really happen
in markets that are trading 24/7 like for example Bitcoin. So in these kinds of markets fair value gaps makes more sense. And here as I said the theory here is that price often returns to this area. So as you can see the market often retrades the gap before continuing. And fair value gaps are a clean sort of reaction zone. You can Think about it a little bit as a support and resistance zone where we actually look out to take trades but they are more significant when they align with other things like as I said market
structure and we also want um you know some price action signal before we commit to the trade. One more note here I also want to mention about the standard gap is that as I already mentioned it's a stronger form of gap where the price physically jumps. Um but As I said it's common in stocks at market open especially after a weekend but it's very rare in 247 markets. And now guys I just want to jump back here to trading view because I want to show you guys the principle here that gaps as you can see
Bitcoin is a market that trades 24/7. So no matter where you look here you won't really find these sort of really gaps where we have no trading at all. To find a gap like that, we need to go to a stock. So let's for Example go to uh Nvidia. And as you can see on the Nvidia chart, you will find multiple of these places when we have gaps. Let's see if I can notice a really clear one. So as you can see right here, for example, right here, you can see that here we have a
massive gap, right? We have a massive gap between the low of this day and the high of the next day. So this is a clear example of a gap and you can see in this example the price actually went up. This is what is known As filling the gap. When the price goes down goes up to the to the high point of the gap. It sort of fills in the gap. So the gap is filled in and then it actually uh dropped to the downside. So this right here is an example of a of a
normal gap. But let's go back to Bitcoin here and see if we can find any uh sort of clear fair value gap. Well, for example, right here, if you look at this pattern right here, if this right here is candle one, this right here is candle Two, and the green candle here is candle three, you can hopefully see that, you know, we have a gap here between the uh in this case, a bearish fire value gap is the opposite of the bullish. So, we want a gap between the low lowest point of candle one and
the highest point of candle 3. So, this right here is the fire value gap. And if we drag it out, let's draw a zone right here. The theory goes that the price want to come back to this gap and test it. And you can see That in this case, it was actually true. Uh you can see the price eventually came down to it came up to this gap once again and this fair value gap and then and then pumped to the downside. But as I said, if you look closely, I chose this example just because
it's a very very clear example. But if you look closely, you will find these fair value gaps all the time. And that is why it's so important to combine it with price action and market structure. But all Right, so now it's time to take a look at something known as order flow and order flow tools. And the best way to think about orderflow in my opinion is that they show you uh as you can see these tools show you the history of liquidity. So where have things gotten traded over time? This can give us very
important clues to understand where things have got traded over time. We can get very important clues of where things will get traded in the future and as a Result hopefully make more money. So let's just quickly go over three uh orderflow tools. And I want to start by looking at the volume profile. And the volume profile basically shows how much volume that got traded at each price level. And here high volume nodes are uh liquidity pools or you should not really think about them. That that is actually not really correct. So I actually miswrote a
little bit here. It's not good to think about them as liquidity Pools. It's more accurate to think about it as you know the volume traded in the past. You can think about it about it as historical liquidity. Uh so remember here these tools are showing the history of liquidity. So for example if we look at this chart right here you can see an example of the volume profile. Uh a volume profile we usually have on the side of the chart like right here. And when we have sort of peaks like we have right here. This
means that lots of Volume was traded at that level in the past. And this is the high volume uh volume nodes. So you can think about them as historical liquidity pools. I think that is a you know good way to think about them even though it's not 100% correct but it's a solid way to relate them to liquidity. Um and you know for example right here is another example of a high volume node. And also these areas where we have much less historical uh trading is known as low Volume nodes. And these are areas on
the chart where you know not a lot of volume got traded. And the principle here is that many times the price have an easier time to move in these low volume areas compared to the high volume areas because even though this is historical uh historical volume the history often reveals something about the future. So volume profile is very solid. And here let's jump back to trading view real quick. I just want to show you guys how You can find the volume profile. So you want to go to the indicators tab right here and then you
simply search for if you just search for volume profile. Uh you can see that we have all of these under technicals are indicators that are built by trading view. You also have multiple indicators that are built by the trading view community. So they are different specialized indicators. That's one thing I really like about trading view that we have so many traders Creating indicators for each other and so on and so on. But for this example, let's let's use a built-in one. And I I'm going to choose the fixed range volume profile. Uh when we use
the fixed range volume profile, we can actually choose uh you know a price range. So we can for example, if we click one time right here and then drag it down to right here. So here you can see that we actually get an indication of how much volume that got traded on different Price levels. So for example, you can see that many times we will have the highest volume uh traded areas here. uh this is the point of control or P they will often be in areas where the price have have been trading a lot
because because of this the price have been able to build up you know volume over time. The next order flow tool I want to take a look at is the footprint chart and the footprint chart basically shows you uh the buying and selling uh uh aggression That happened inside the candlesticks. So, I like to see uh volume footprint charts basically as having an X-ray to be able to look at what happens inside the candles themselves. So, here in Trading View to enable the volume footprint, you want to go up here to where it says candles.
So, here you can change the candle type and you want to go down here to where it says volume footprint. Um, and now when we zoom in, you can see that we can actually see What happened inside the candlestick. you know exactly how much volume was was traded during the specific candles and this can look super complicated and I also want to mention that I do think that the volume footprint chart is a premium feature on trading view but as I said don't worry because I do have a special trading view link that you can
use to try Trading View Premium for free for 30 days and get a $15 bonus. So if you want to try out the volume footprint Chart, make sure to use that link down below. And what I also want to say is that I do have a full course where I teach you how to use all these order flow indicators step by step. And I will make sure to link that video course up in the video card as well as the description. Okay, so last but not least, I can also talk about the VVAP which stands
for the volume weighted average price. And this is basically what it sounds like. It is the day Center of mass. you know where was the most liquidity taken during the day and we have different types of VWAP. One very common one is the anchored V VWAP that lets you anchor it to any major event for you know dynamic support and resistance and so on and so on. There are multiple different way ways to use the VWAP and it's a little bit outside the scope of this video but I felt like I wanted to at least
mention it but once again and this is important to repeat These tools show the history of liquidity and the next slide in the next slide I will actually show you the persistence of liquidity. All right. So, now it's time to take a look at the liquidity heat map. And this right here might look so so, you know, confusing in the beginning. You know, what are you even looking at? This looks like a mess of a chart. Uh, but don't worry. As always, I will try my very best to break this down in super super simple
terms. First of all, what is a liquidity heat map? Well, this is basically showing where the buy limit and sell limit orders are resting on the chart. So, I hope you can see right here. Uh, if you look at the image, you can see here to uh, by the way, I think this chart is a gold chart right here. Uh, but if you look to the left, you can see all of this red right here are sell limit orders. So, these are the price levels and where pe people are currently having Their sell orders. Then
the green side here are the current buy limit orders. So this is at which levels the people want to buy. And what this map basically show you is they don't only show you here the green and the red how many orders but they also show the history of orders. So they show you how these limit orders have looked like over time. Right? So this is very important. So in other words, the liquidity heat map shows where limit orders stayed long Enough to matter. So they tell you, you know, where are the important limit orders that
stayed for a long time on the chart and where are the places where you know maybe a limit order appeared just just quickly and then got move moved away. That is a common uh you know uh manipulation technique and so on and so on. So, it's very important that this filters out manipulation and things like spoofing and fake orders that get cancelled and leave only the levels with Real intent. But now, how do we read this chart? Well, in general terms, uh they can look a little bit different, but the more sort of bright the
zones are, the more significant the and the more limit orders we have on the charts. And the darker zones are are basically areas of no real interest. So I hope you can see up here you have the scale and in this chart basically the more yellow it is the more limit orders we have and the More dark it is the less limit orders we have. So you can for example see right here is a super super interesting example. If you take a look at this part right here, you can see that we had lots and
lots of limit orders and the price actually even went down and tested this level multiple times, you know, failed to break through. But then you can see that the price finally actually ate up the limit orders. You can see the the price broke the limit orders and after That you can see that no limit orders are left. And this is not because you know people took away their limit orders. In this case, it looks like the price actually ate through the limit orders. And this is us usually, you know, a strong sell signals. So, the
price ate up the limit orders and fell. And then you can see what super interesting happened here. You can see that for a brief time, we had a lot of sell limit orders right here. You can See the yellow area right here. But then the price managed to eat up this part uh uh part again and that led to a strong move to the upside. So it's this chart type is super super interesting to study. Um and I will not have too much time. We will go a little bit deeper but I will not have
too much time to talk about it you know in this course. So definitely guys let me know down in the comments if you want maybe a full course on diving much deeper into these kind of Charts and liquidity. Uh make sure to let me know. But here a simple rule is that when the price hits a bright zone and stalls, we usually say that absorption is winning. So for example, when the price stalled here multiple times and bounced, we say that absorption is winning. And you can think about absorption as the sort of defense. In
this case, the buyers managed to sort of defend this level, right? It managed to defend it with sort of buying Pressure. Uh but when the price zooms through a bright zone and breaks it like we saw for example right here that means that aggression is is winning. The people that are eating from the order book and taking liquidity manage to overcome that defense. Okay. So now I want to take a look at some specific heat map patterns that you need to know about. And I'm talking about things like walls, clouds, withdrawals, flips, and so on
and so on. And let's begin here With the liquidity wall. A liquidity wall is a single price level with persistent resting liquidity. So these are basically the strong and bright lines on the chart. So for example, this right here is a liquidity wall. You can see this yellow one all the way here is a liquidity wall. Down here we have a liquidity wall and so on and so on. Very simple concept. This is where we have been having lots of limit orders in the past. And if you want to measure these Limit orders, you can
even look here to the right here and see the total uh resting liquidity. Next up, we have the stacked walls or in other words, the liquidity clouds. And this is basically when we have multiple levels of uh resting liquidity or in other words, we usually have multiple liquidity walls. And the thicker the cloud, the stronger the the sort of absorption zone or defense zone. So for example, one example of a cloud looking structure is Right here. You can see this one is not as bright as the uh as the liquidity walls. But you can still
see see that we have, you know, one, two, three, four, almost five levels stacked uh upon each other. And of course, this one would have been even stronger if we had, you know, if this cloud was yellow. But this is still a cloud in my opinion. Right here, you can see that we have some sort of massive cloud, right? Much of buyers. And you can probably find some other Small clouds on this chart. The next concept I want to talk about here is liquidity withdrawal. And this is a very important concept to understand. This is
when the wall disappears. And this means that the path of at least resistance opens and the price can often run through that level fast. So let's see if we can find any liquidity withdrawal. So remember this right here. Remember when the price broke through and ate up this liquidity wall right here. This is not Really a liquidity withdrawal because this is a scenario when the price actually ate up the liquidity. The liquidity withdrawal is when we see the liquidity just you know disappearing. So for example, a liquidity ball is actually up here. If you look
at this part right here, you can see that we have, you know, lots of persistent liquidity. We have lots of sell limit orders resting right here. But then you can see that suddenly at this point Right here, the sell orders just disappeared and we have a sort of gap right here between this point and this point. This is a liquidity withdrawal. And what you can notice is that after this withdrawal right here, if we look down, you can actually see that this was when the price uh dropped down. Maybe this was just a coincidence. Who
knows? Coincidence? I think not. Uh maybe it was just a coincidence or maybe the people that had the sell limit orders up There maybe started to, you know, sell at market levels. That is one possible solution. I'm not saying that it's either or the other, but definitely something to pay attention to. And knowing about liquidity withdrawal is definitely important. The next thing I want to talk about is liquidity flip. And this is when a liquidity wall gets broken, but that the price still reacts to that level later. So this is basically if you know about
support and Resistance, you know that when we break uh support, it often flips to become resistance in the future. This is pretty much the same thing but with uh liquidity walls. So for example in this case you know we broke the previous uh liquidity wall right here. So the theory is that this one might flip to sort of act as resistance here in the future. And in this case it you know yes we got a small reaction right here but it wasn't that significant. Uh so in this Case it didn't play play out very good
but this is a concept that you know can that you can spot many times in the market and it's good to know about. In this case it didn't play out super well uh but definitely a concept as I said to know about. But right so this course is actually coming to an end soon. I do have more things I want to talk about when it comes to liquidity. This concept goes even deeper. Uh but yeah this course is getting so long I really need To to wrap up here. But yeah, guys, if you made it
all the way till the end, you know, thank you for being with me today. If you want to, you know, you can just comment down below. Uh leave a comment and say full course to just show that you made it all the way to the end. And also guys, if you want to uh help out the channel, the simple free way you can do is just you already know it, you know, like the video, subscribe to the channel if you want maybe part two of This course and uh other trading courses as well. I have
so much I have so much content here on the channel that you can uh learn completely for free. Um I can also just mention that if you want to get access to this full presentation and lots of other things I for example have some trading trading view indicators I have built myself. I have some trading tools uh and if you want to get access to them and at the same time support the channel you can consider becoming a Channel member by clicking join down below there. We also have a video where I go over a
little bit about what's included in the different tiers. Uh but yeah, I think that is pretty much it. And some recommended future learning here is to check out my smart money concepts course. It just recently passed I think 1 million view uh views. Uh so that is just amazing. Smart money concepts is as you know u you know liquidity I would say is a part of smart Money concepts but we have many other concepts as well. And most importantly guys, you need to check out my risk management course. I just recently put out a course
more than one hour on risk management. If you only watch one more course, I recommend to watch that one. But yeah, guys, as I said, if you want to take your trading to the next level and start making money, I highly highly recommend to check out my risk management course next. Uh it will be on The screen right here. So simply click and tap on it and make sure to save it and then watch it when you are