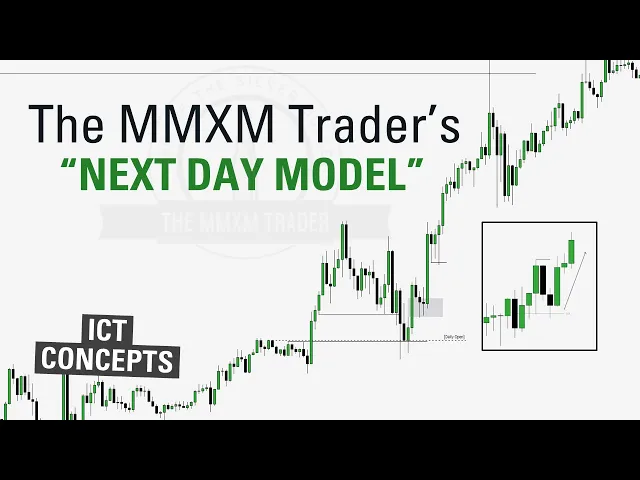
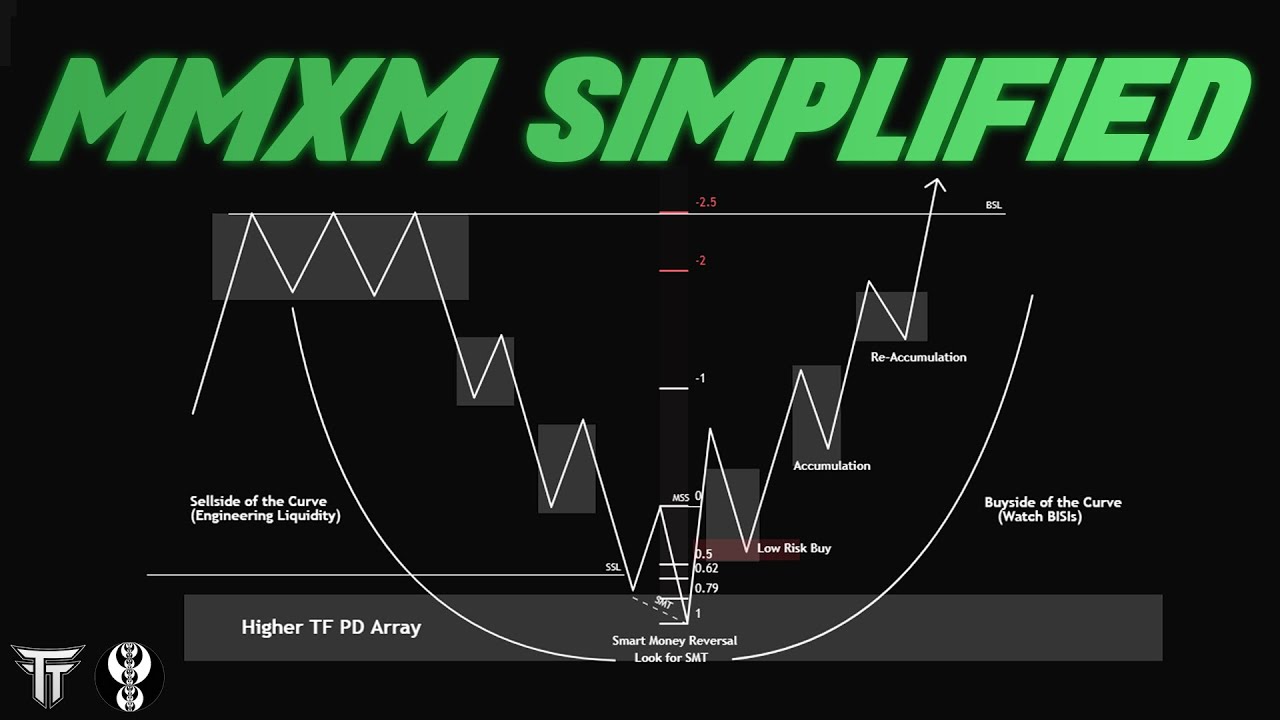
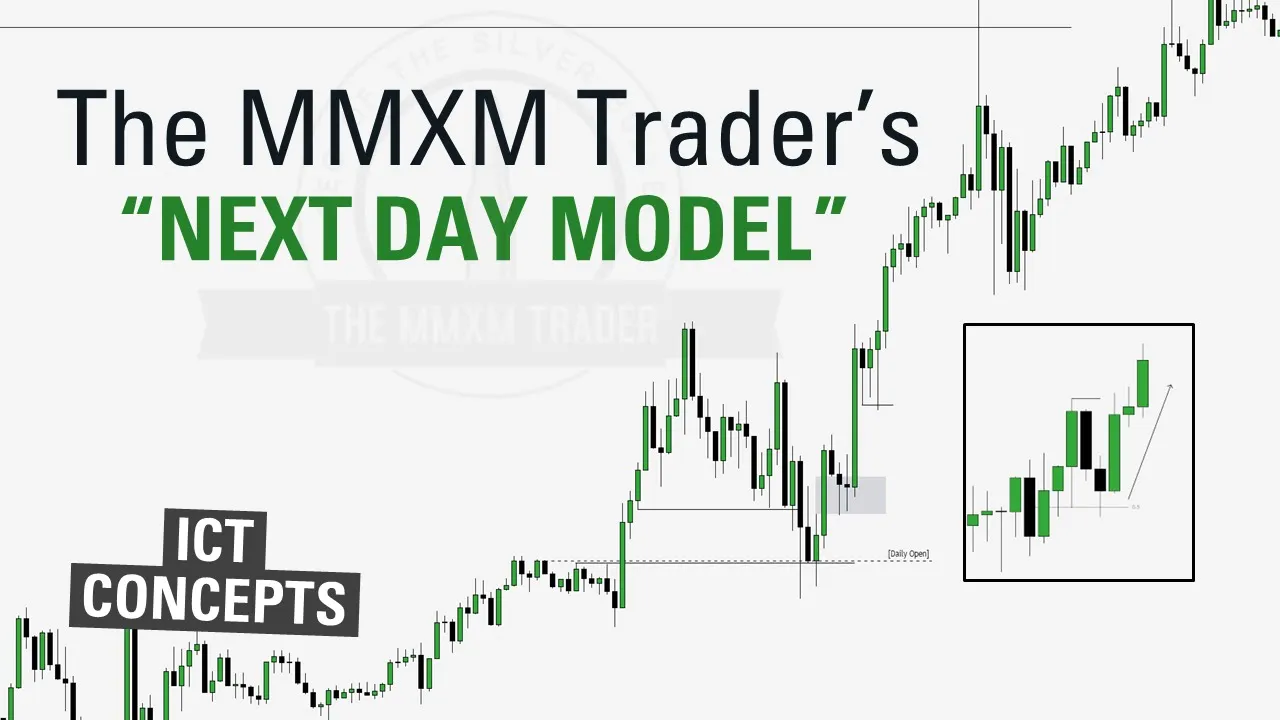
foreign [Music] how's it going everyone I've received a lot of requests for a model and more top-down analysis so for this video we are going to go over the nmxm Traders Twitter model we will first look at what the model is and then jump into a few examples using top-down analysis and then Maxim drops a lot of information on his Twitter posts lots of great examples and if you scroll through his feed you'll stumble upon this post right here so let's take a look at it so this is the model we are going to be
going over in today's YouTube video this model includes skipping Mondays focusing on the New York session only executing on the 15-minute chart using the economic calendar as your roadmap and trading the day after your anticipated higher time frame level is hit so let's go into this example here so looking at the daily chart we have this daily fair value Gap is our draw on liquidity as noted here and then we have a daily fair value Gap Above This is Monday right here so skipping this we look at Tuesday it reaches up towards our higher time
frame level now after we get a nice reaction off of this daily level I'm looking for Wednesday to continue lower taking the sell side liquidity and reaching for the draw on liquidity going into the hourly chart you can see Tuesday this is where we hit the daily fair value gap before getting an aggressive move lower we have an hourly breaker as we reach into Wednesday price retraces back up into this hourly breaker hourly fair value Gap here and moves away looking at the 15 minute chart we have midnight open and that was the move into
the hourly fair value Gap and hourly breaker and the move away as we head into the New York session we have a 15 minute fair value Gap here price reaches up into the consequent encroachment of this before delivering to the weekly open and eventually to the draw on liquidity below so this is an example of the model and I want to reiterate skipping Monday looking for when price reaches into that higher time frame level looking the next day for the New York session 15 minutes set up to deliver price in this next example we have
a daily order block here and here is Monday Tuesday Wednesday Thursday comes up tests the daily level with this closure it's respecting it so going into Friday expecting to find short setups during the New York session going to the hourly chart the important thing to note is the smt at the highs here and this hourly fair value Gap as well as the sell stops resting below which would be the draw on liquidity with the news getting this Wick up however the bodies are respecting this fair value Gap displacement down bearish order block and then that
is the entry there going towards the cell stops below next we are going to look at NASDAQ on the daily chart so if you notice right here we just put in equal highs so that would be a target for the future we have bullish structure and so I'm expecting this week to be bullish however this is Friday we're going to skip Monday now on a bullish week I'd want to see an open low high close and if you don't know what I'm talking about click this link right here with that idea in mind what do
we have right here we have some nice lows stacked right there as well as a candle with no Wick which I like to Target we look at Monday what did it do let's zoom in here a little Monday took previous days high or Fridays High closed back into the range the next day move towards my draw on liquidity down here so let's drop down to the hourly and 15 minute chart and see if there's something offered during New York am session so now that we are on the hourly chart we can see we have our
Friday's high right here that was taken out on Monday before aggressive displacement lower and here is our draw and liquidity mentioned on the daily chart let's see what happens we ran these stops right here could not close above and get aggressive displacement lower so letting this continue we get a move up into this fair value Gap and then back down so let's go to the 15 minute chart before New York am session and see what appears so here's our hourly fair value Gap and if you notice with this candle close we have a 15 minute
fair value Gap right here so ideally I'd like to see during open price reach up into here and then make a move towards our drawn liquidity down here and there you go you can see our drawn liquidity was hit and that is the move for the New York am session going back out to the daily chart to see how this played out you can see Monday took previous day high we got a move towards this low but what did we do once we hit our drawn liquidity down here we came back in and closed back
into the range so now what can we expect for Wednesday Thursday or until we reach this high we can expect expansion up and even a little more expansion than expected for this next example we are looking at Euro USD and you can see we have sell side liquidity right here in the form of equal lows looking in here we can Mark out previous week's High because that is our Wednesday so Monday Tuesday Wednesday Thursday Friday as previous week that's the high looking into Monday letting that form similar to our latest NQ example we took buyside
liquidity and closed back into the range so with this we can expect next day to reach for lows and you can see we have some lows right in here as well as down here but mainly focused on New York am session so dropping down to the one hour chart so here we are on the hourly chart on Tuesday going to Mark out the midnight open and let this play out and see if we get a setup for New York am session and here we are getting close to New York am sessions so I'm going to
drop down to the 15 minute chart you can see we had a fair value Gap right here and a fair value Gap right here supporting bearish order flow and we have another fair value Gap right here so ideally get a reach into here before going lower however that does not occur so with it exiting and getting this large move later New York session mostly consolidates so we will go to the next day Tuesday we do get a move down but no setup for New York session so I'm going to look for Wednesday to have a
continuation lower going back to the one hour chart so now on the hourly chart let's look to see what happens currently we have a large displacement candle down and now we have a fair value Gap so we will go ahead and Mark that out you can see how we retch above midnight open but we're currently respecting this fair value Gap right here all right so as we near the New York am session let's hop down to the 15 minute chart so if you look right here when we went above midnight open we displaced down and
we have a fair value Gap right here price respects so from here I would like to see a move towards this low that is our current sell side liquidity before reaching for our old daily lows that we have marked up letting this play out we get a move below that low come back up into the fair value Gap and continue lower so we'll go back out to the hourly chart you can see where we want to see these lows right here and ideally those equal lows on that daily chart down here going back to the
daily chart we get a continuation and do end up taking those lows for our next example we are still on Euro USD and I'm looking at this order block right here letting Monday play at home as this is Friday you can see we stay inside bar and do not reach our higher time frame PD array Tuesday we do end up reaching into that PD array and getting a reaction off of it so the next day I'd want to look for a continuation lower ideally for these lows but we have yet to hit previous week's low
as well so here we are on the hourly chart and we have our daily open marked out we have sell side liquidity resting below and then we have our daily sell side liquidity down there so letting this play out let's see what we get and we get a pretty immediate drop off here however as we near the New York session we come back into this range so now we have engineered more sell side liquidity let's drop down to the 15 minute chart so right here we can see we have a 15 minute pair value Gap
right here an old high in it so that is a possible entry there however if we missed this one we can still look for other entries here let's see if we get a fair value Gap we don't however we do have this old busy here it should be used as a resistance so I'd like to see price resist off of here before reaching for this sell side and sell side below and there we go we reached our sell side retest previous lows engineer more liquidity leave highs then go you can see how after we hit
this order block we take our initial sell side liquidity and displace all the way through these old bows for our final example we are going to take a look at GBP USD so if you notice make a smart money reversal right here Order flow is bullish and we have some eyes resting over here so marking out those highs as so let's zoom into the daily over here so with this being Friday and if I'm expecting a bullish week I'd want to see an open low put in before expansion higher up into these highs and as
well as Friday's high before we put in a high in close so letting Monday open up Tuesday drop down but what do we do we respect the mean threshold of this order block here so if we're going to get expansion in a classic Tuesday low a week I'd want to see Wednesday expand towards Friday's high and into these old highs so with that at the end mind let's go down to the one hour chart here is our midnight open and as we make our way towards New York am session what do we have well we
have an order block or down close candle right at midnight and then a fair value Gap right here so as we play this towards New York open thank you here on the 15 minute chart you can see we also have a 15 minute fair value Gap right here which I will Mark out in a box so we can differentiate the two and let's see what happens here if we get a reaction and so a pretty aggressive reaction so far retesting midnight and if you notice how no bodies closed below midnight here now what do we
get an aggressive move out that candle closes we now have a fair value Gap right here displacement out and where do we want to see this expand towards Friday's high as well as those highs let's see what kind of expansion we get and there we go we take Friday's High stay in the range and then we'll hop out to the Daily to see how this week ended up we made a move higher engineered more liquidity at the highs for them Friday to reach higher I hope you guys enjoyed this video thanks to mnxm for posting
this model on Twitter and I hope this cleared it up for some of you guys if you did enjoy it please consider liking and subscribing and I hope you enjoy the rest of your day see ya foreign