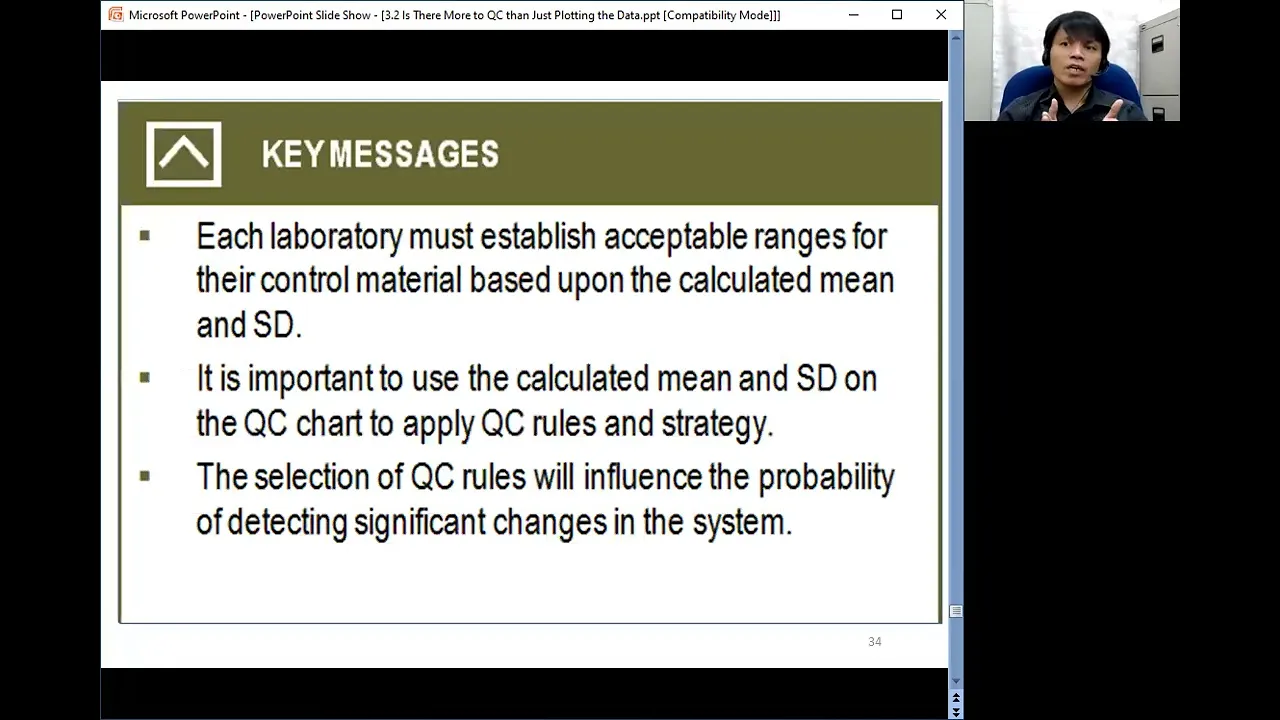
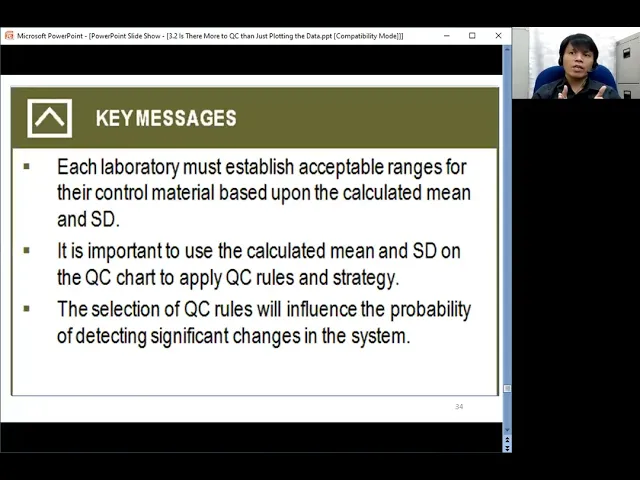
so is there more to qz than just platting data yes knowing where you are and where you want to be starts with creating the right graph the right LJ chart that utilizes which Q arranges the one that we established the one we calculated in the laboratory the right graph which utilizes or uses the right rules um the QC rules to to be applied it does makes a difference what control rule or rules are applied to accept or reject a run and a right graph that is periodically reviewed by the laboratory key messages each laboratory must
establish acceptable ranges for their control material based upon the calculated mean and standard deviation it's important to use the calculated mean and standard deviation on the QC chart to apply the QC rule and strategy the selection of QC rules will influence the probability of detecting significant changes in the system thank you everyone for listening









![Morning Joe [6AM] 10/22/24 | 🅼🆂🅽🅱️🅲 BREAKING NEWS Today October 22,2024](https://img.youtube.com/vi/YknXaZvqkcs/maxresdefault.jpg)