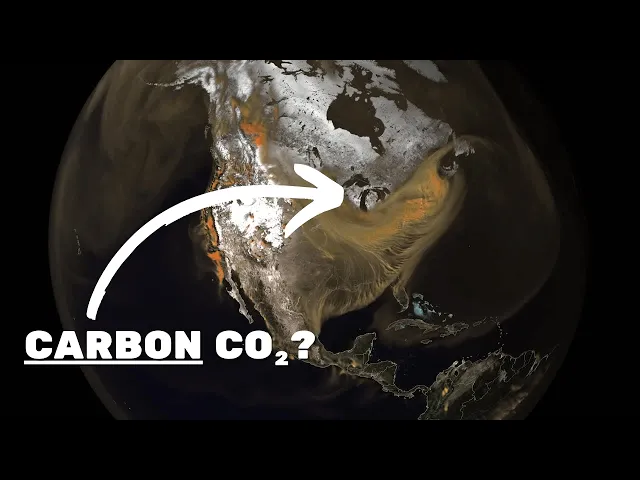
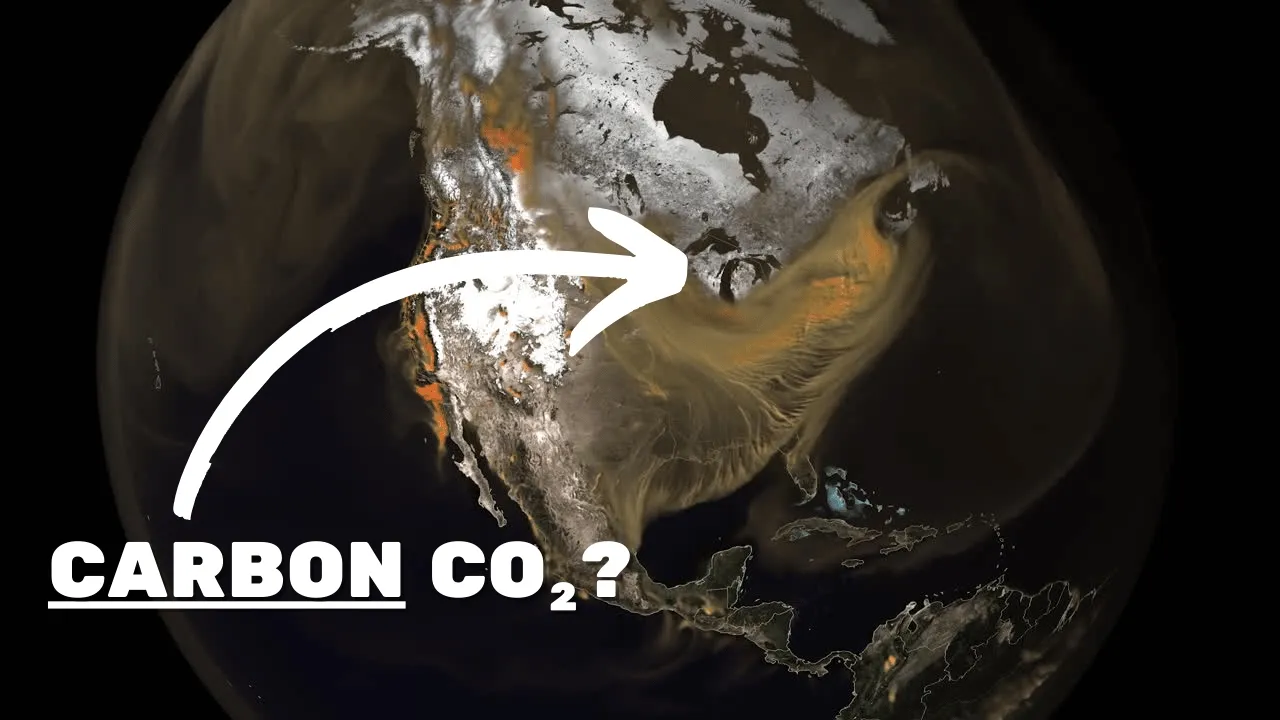
imagine being able to see in breathtaking detail the invisible carbon dioxide swirling around our planet tracing its Journey from power plants and wildfires to every corner of the globe NASA's visualization of carbon dioxide in Earth's atmosphere provides a detailed look at how emissions from sources like power plants wildfires and vehicles spread across the globe utilizing the godded Earth observing system GEOS model this visualization captures the movement of CO2 with exceptional Clarity highlighting how weather patterns and natural processes influence its distribution the model's high resolution allows scientists to track co2's journey through the atmosphere offering crucial
insights into its role in climate change but how does this intricate dance of carbon dioxide impact our planet's climate and weather patterns the the Goos model incorporates billions of data points from satellites and ground observations enabling it to simulate the complex interactions of CO2 with atmospheric circulation and weather systems the visualization reveals how emissions from specific sources such as cities and Industrial centers are carried by winds and dispersed across continents and oceans this level of detail provides a clearer understanding of the global carbon cycle and the factors that contribute to the buildup of greenhouse gases
in the atmosphere in addition to tracking emissions the Goos model also shows the natural processes that absorb and release CO2 such as photosynthesis in forests and the respiration of plants the visualization captures the day night cycles of these processes revealing how CO2 levels fluctuate throughout the day and how they are affected by seasonal changes the collaboration between massa's orbiting carbon Observatory 2 and the GED Earth observing system enabled a precise analysis of global CO2 levels throughout 2021 the data showed significant seasonal fluctuations with CO2 concentrations peaking during the northern hemisphere's fall and winter and decreasing
during the summer due to increased photosynthesis by plants the visualization also highlighted the day night cycle of CO2 absorption in major rainforests like the Amazon and Congo reflecting The Continuous rise in atmospheric CO2 and its Global impact but there's another greenhouse gas in this complex climate equation methane methane has an even more potent short-term impact on warming than CO2 methane traps heat 28 times more effectively than carbon dioxide over a century and its concentration has surged by over 150% since industrialization methane is emitted from various sources 30% from Wetlands 20% Agriculture and 30% fossil fuel
extraction among others NASA's visualization using data from the global modeling and assimilation office illustrates the intricate global patterns of methane emissions highlighting the critical need for understanding and mitigating these emissions to combat climate change methane and CO2 though different in concentration and behavior both contribute significantly to global warming understanding their intertwined roles is crucial for Effective climate change mitigation efforts NASA's visualizations are Central to unraveling the complexities of carbon dioxide and methane in our atmosphere these visual tools created using Advanced models provide an unprecedented view of how these greenhouse gases move interact and impact Global
Climate patterns by showcasing the seasonal and day night cycles of CO2 and the potent effects of methane these visualizations offer crucial insights that are vital for developing effective climate change mitigation strategies underscoring the importance of continuous scientific observation and innovation [Music]