hey everyone this is anos co-founder of lank chain today we're super excited to announce the general availability of lsmith our platform for LM application development monitoring and testing we worked hard over the past few months to add requested features and ensure that lsmith can operate at scale lsmith is designed to assist you at all stages of the LM application life cycle this includes prototyping beta testing and production we've designed lsmith to be a completely independent system this means that you can use lsmith regardless of whether or not you're using Lang chain to develop your applications
here I'll showcase the different workflows that lsmith has to offer so here I've logged into lsmith under the linkchain organization that I'm a part of and I can see projects data sets and testing annotation cues and the Hub I'll start off by clicking into projects and projects are nothing more than collections of traces that you loog to the system usually people separate their projects by application so um here I'm in the projects page I can see all my projects and uh I'll click into the project that's uh titled chat Lang chain this is a project
that receives traces from uh the chat Lang chain application that we deployed on chat. langang chain.com this is an application that's designed to answer user questions about Lang chains python documentation so one thing I'll point out right away is uh all these statistics that you can see at the project level for the given time period by default it's the past seven days so see the total run count the total tokens including the costs um right now we only have cost tracking set up for open AI models but cost tracking for other models is uh on
the road map uh for the near future we have the error rate um uh some latency and streaming statistics we have feedback statistics as well and then we see some quick filters that we can use to filter for runs within the project um in this tab section we see traces which are uh endtoend invocations of your application we can see uh isolate only the llm calls if you're only interested in looking at prompts and generations we also have this monitoring section that allows you to track uh different Statistics over time you can view things like
feedback and latency and cost cost over time which which is pretty useful you can also um uh Group by metadata so in this case uh we actually have four models available for generating responses with chat link chain we have anthropic CLA 2.1 fireworks mixw uh Google Gemini Pro and open AI GPD 3.5 turbo and you can see the statistics over time for each model side by side um so this this is pretty useful to uh you know if you're AB testing different configurations of your application and you want to see how they're doing alongside each
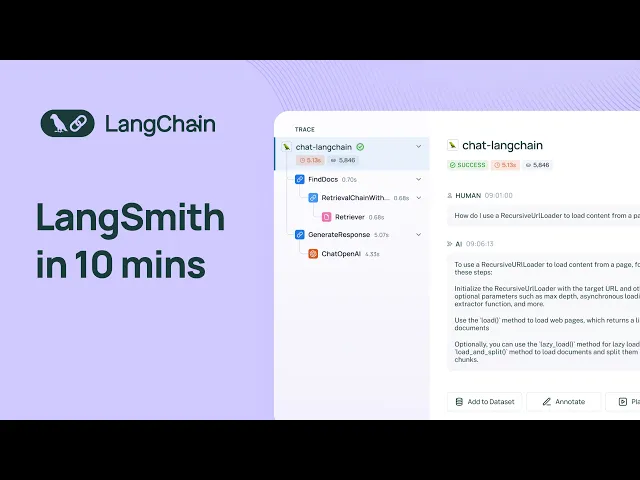
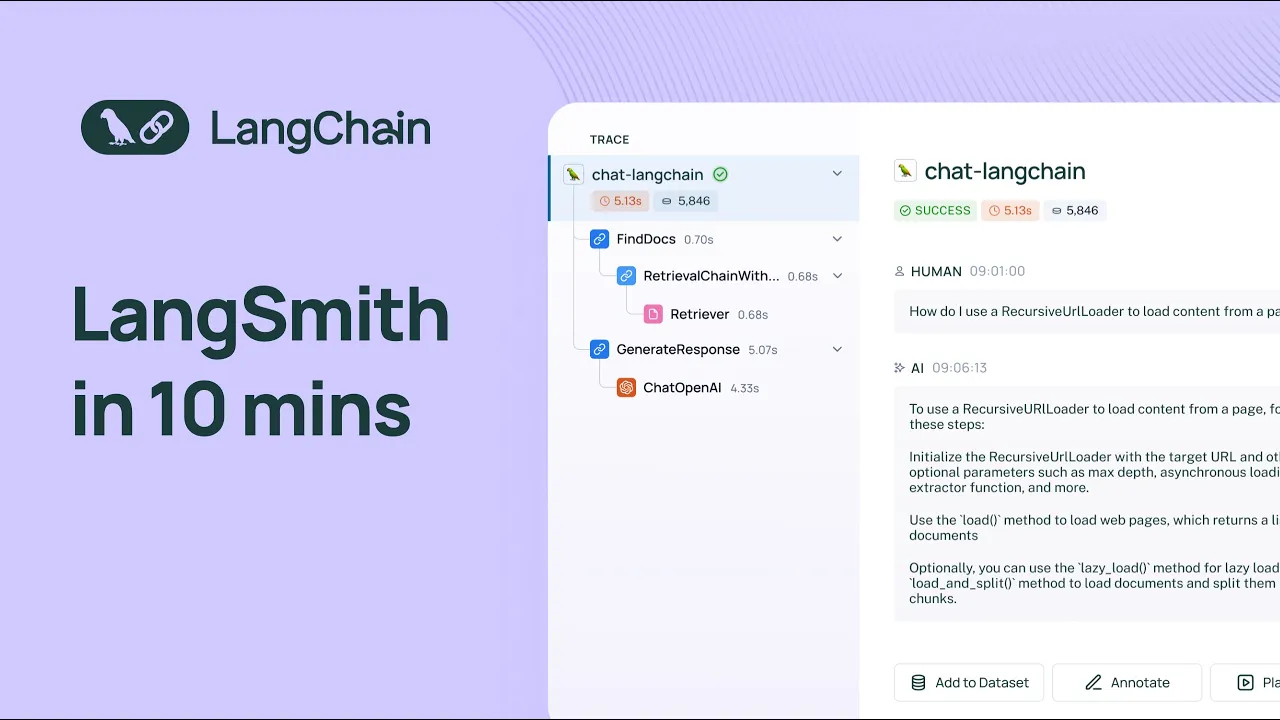
other so I'll go back to traces and I'll click in on uh one of the rows here so when I do that I can see the uh input and output of the LM pipeline that backs chat Lang chain and I can look at all of the different intermediate steps that the pipeline takes to arrive at the final answer I'll dive into the most interesting steps there's this retrieval step um that that is uh that under the hood you know it it retrieves documents from an index um and you can see all the documents here they're
rendered nicely uh I can also dive into the uh llm call that's used to generate the final response at the user sees so here we can see like the the raw system prompt uh we can see the the human prompt um as well and then we can see the AI message at the end um and then we can also see any metadata that was used to um s so that that was uh sent along with the application so if you're using linkchain a bunch of metadata is sent by default uh like the the model the
model name uh uh the runtime information things like that if you're using the SDK a lot of the same metadata sent up and the metadata is completely configurable if you're using link Smith links Smith API so why is tracing helpful well oftentimes when you're running an L application you can run into a lot of really frustrating issues like infinite looping if you have an argentic workflow um or you know maybe your LM pipeline is using a lot more tokens than you expected well here you can dive into the inputs and outputs at each step and
really understand where things are going wrong um another thing that's useful is you can open up any llm call within a trace in uh an interactive playground environment and you can change the model settings you can change the prompt and then you can uh regenerate the um you know the completion based on uh any changes that you made another thing that's helpful is being able to filter by uh a bunch of different attributes so I'll filter by feedback here and uh what you'll notice is on chat linkchain we have a thumbs up and thumbs down
button and this is uh wired up to the user score feedback tag so here I can only look at traces that have positive feedback um I can also uh you know use the same principle to look at traces that have negative feedback so this allows you to drill into the most interesting traces obviously with just a thumbs up thumbs down button um you're not going to get like very high Fidel feedback but it can be used as a good starting point to dive into your data and uh gain an intuition for um you know how
your application is doing on in in real world scenarios great so uh one thing that'll point out is in um from every uh um Trace you can click on this add to data set uh model and you can add it uh add the inputs and outputs as an example to a data set and this is you can edit this uh as you wish and then you can add it to a data set I'll dive into the data set section and um show you an example of a real data set that I have so here um
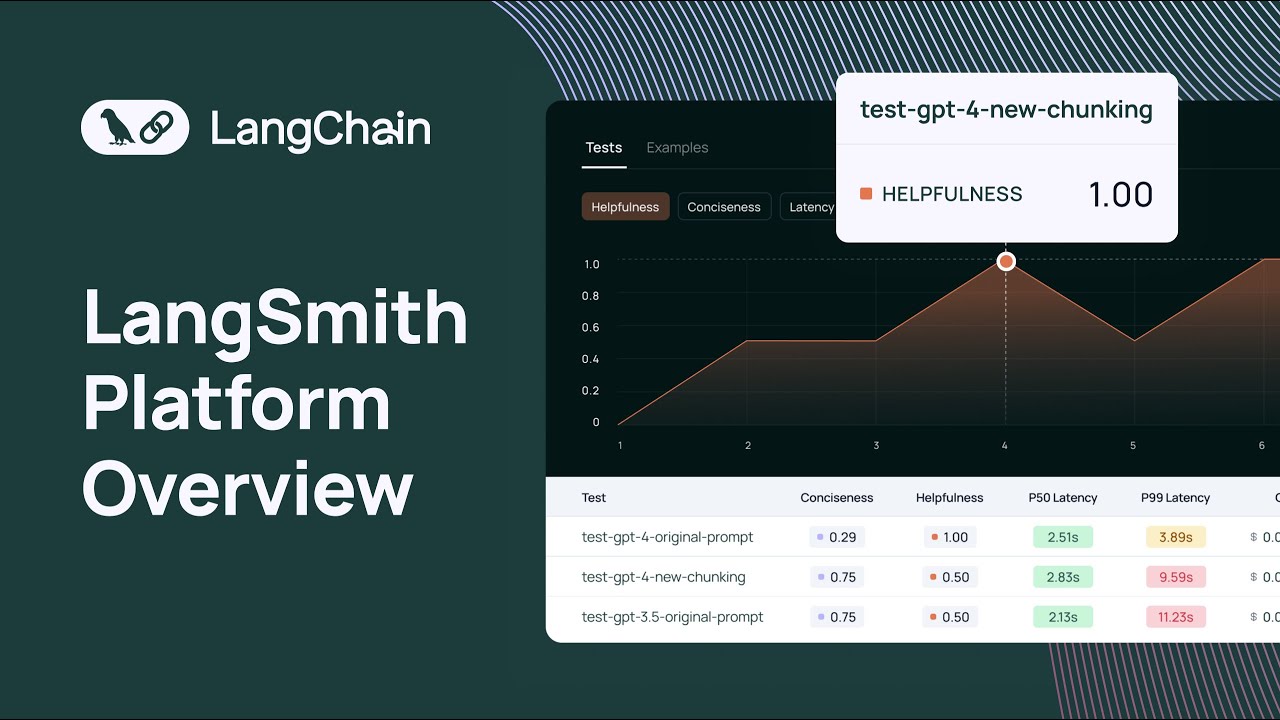
we can look at uh a data set and all the examples that are part of the data set uh each example consists of an input and reference output uh that you can use to test different versions of your application so here I've used this data set to run to to run um a number of tests uh and I see the test results here and I can look at uh each test result and uh get a highle feel for how each test result performed relative to each other with this chart um I can also change what
this chart is displaying so previously it was displaying latency I can also have it display um uh you know correctness um in order to run a test with a data set uh you can use either the python or typescript SDK and you can also configure a number of off the shelf LM based or heris based uh evaluators along with any evaluators that uh any custom evaluators that that you want to run as well and these evaluators will take into account the input the actual output of your application and then the reference output to score your
application results uh against a number of criteria another thing that you can do in the data sets and testing page is uh open up a test comparison View and then what this will show you is the input the reference output and then the results of each of your tests and they can view them alongside their scores um uh side by side and then you can also look at these charts these charts are fully fully configurable um we have latency charts feedback charts token charts and then we have this um uh I guess like distribution chart
that allows you to you know get a good idea about how your tests are performing relative to each other this is really useful when you want to do things like regression testing and um you know if you want to run some sanity checks uh uh against your LM pipeline before you deploy to production or before you deploy it to um an initial set of users the uh data sets and testing section of lsmith makes it really easy uh for you to do that great um so another thing that you can do is send any Trace
to what's called an uh an annotation queue so you can click on a trace here and then you can send to an annotation queue um and then you can actually uh you know this gives you a uh kind presents like a cyclical workflow that allows you to provide human annotation to any run that you logged to the system so here I can give it like a correctness score I can also add a number of tags that I have and you can create new feedback tags as well to uh annotate a run um on a number
of different criteria that's important to you and your organization the last thing I'll highlight is the prompt tub uh we launched this a while ago but I think it's worth mentioning again uh here we have like a collection of uh prompts some of these are public uh you can o have prompts that are specific to you and your tenant um and you can open up any of these prompts in the uh playground and you could enter the parameters that the prompt expects and then uh look at the generation that's that's uh produced um you can
also change the the provider and the model as well um and then you can also see the different uh you know versions of the prompt as well awesome so I just wanted to give you a quick overview of what link Smith has to offer and how we can help you uh develop and gain confidence in your llm applications uh we're really excited for uh everything that you know you all are going to build and we hope that link Smith can be a useful useful tool uh in your toolkit for uh productionizing your LM applications thank
you