in today's video we're going to focus on the P Cycle top indicator to better understand the positioning of bitcoin's price action in this market cycle and also talk about how it's maybe overextended a little bit and why a correction could be beneficial in the coming weeks subscribe to the channel for more videos like this in the future like this video if you enjoy content like this going forward and let's dive right into it so we know across time that Bitcoin tends to respect this orange moving average as support in Bull markets leading to new in
price Discovery and we know that the green level this moving average tends to act as a resistance initially but inevitably enables upside going forward so this orange moving average holding as support that is most visibly apparent in 2017 as we see support support support but rejection from this green moving average right over here every now and then so right now we're in a very interesting spot but before we talk about this spot we have to also talk about that bearish crossover that occurs at bull market Peaks and of course we're nowhere close to it but
we can see that this orange moving average is trending upwards we're seeing it actually really tilt towards the upside in recent days we've seen this inflection which is quite drastic and that's because of the DraStic price appreciation in bitcoin's price action of course this green moving average isn't really ascending that quickly because it takes into account less days but of course that more sensitive moving average is the one that's doing the work and we know that whenever we see Corrections the orange moving average is always going to be that most important level 66k at this
point in time but given how we're tilting towards the upside over the next few days and weeks this is going to represent higher prices so I wouldn't set that in stone but we know that whenever we see pullbacks especially in 2017 we can get to this moving average quite on quite a few occasions but on 2020 for example we didn't see that moving average get retested so I'd say if we see a pullback in the future 67k or at least this orange moving average whatever price it represents at that point in time that's going to
be the best we could get that's what history is suggesting whereas the green moving average right over here that's going to be a resistance in the short term that represents $122,000 we know that price tends to expect or experience a little bit of resistance right over here in ball Cycles but inevitably we overextend beyond it and rally to new alltime highs so we may get a rejection from 122 in the in the future but first we need to break the psychological resistance of 100K and we're in a very interesting point right now with the P
Cycle moving average because we're seeing drastic tilting curling up to the upside in this orange moving average and if we propagate these moving averages we'll come up with a better idea of where that bearish crossover in the future could be and because of the DraStic tilt towards the upside compared to the previous video you can see that we come up with a late May 2025 bull market Peak and I'm not saying we're going to see this because of course we need to see a pullback and we probably will see a pullback which will make this
P Cycle moving average tilt towards the downside once again so this is going to be natural that we see curls up and potential earlier bull markets occurring but that's naturally what happens for bitcoin's Price action we see periods of uptrending and then this P Cycle moving average Trends upwards meaning that we see an earlier bull market Peak but when we see a pullback and we probably will see a pullback in the next few weeks that pullback is going to indeed make this P Cycle moving average tilt downwards and and that's going to Kick the Can
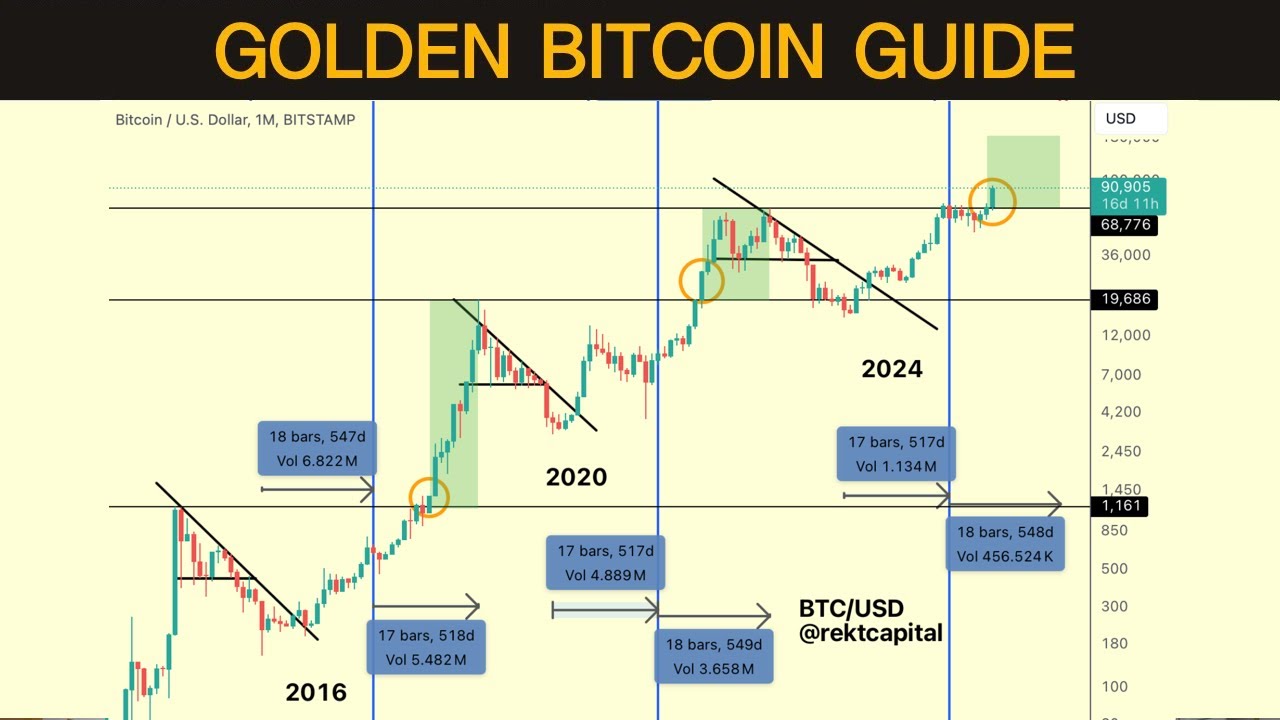
the proverbial can down the road once again so I'm not going to say that we're going to Peak in late may but a corrective period is quite necessary for this bull market Peak to occur a little later on and I'll tell you why because historically whenever we've broken Beyond old alltime highs we've rallied some 270 days 250 days in the 2020 2021 cycle we rallied 330 days so if we rally Beyond old alltime highs 250 days that gets us to July or so but if we rally 330 days or so that gets us into September
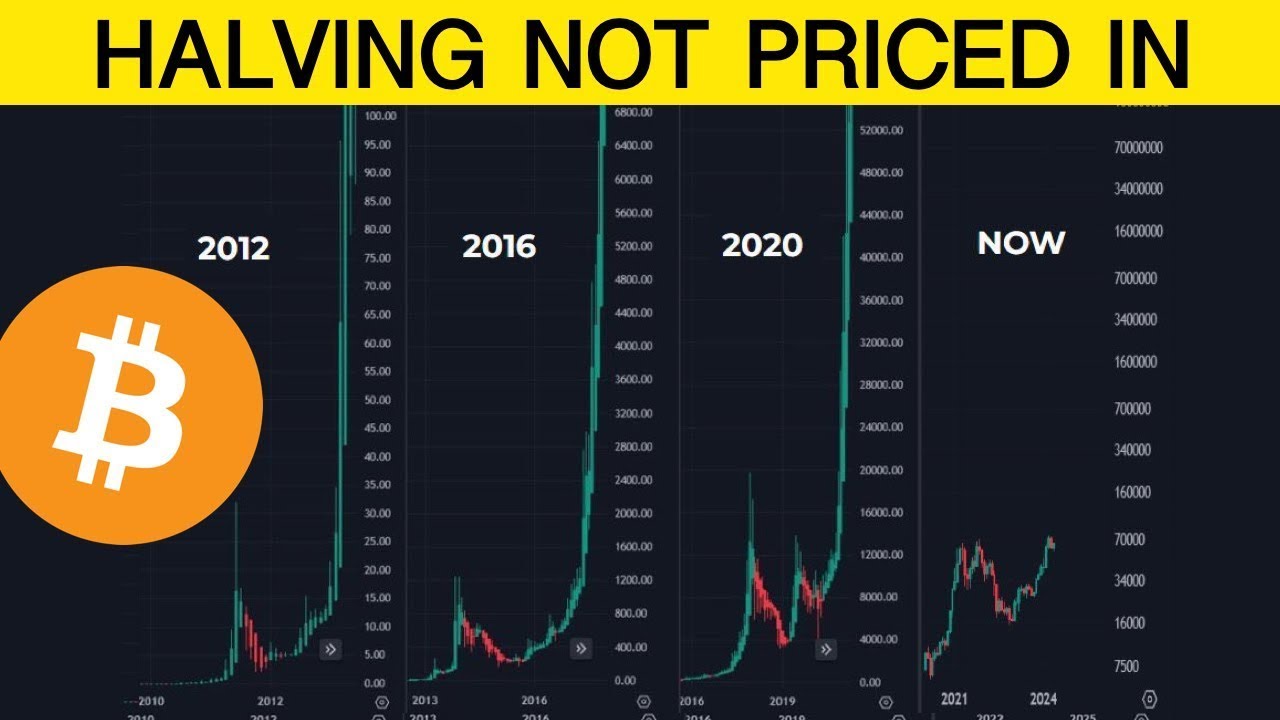
territory and this will really depend on quite a few factors but overall the most important thing to keep in mind is that after the Haring we tend to see a bull market rally of 518 days after having or 550 days after having so if that repeats then we get SE September or October as a peak so this is a traditional Haring cycle 500 days after the Haring and that's it it really is that simple that's how Bitcoin tends to Rally we see a bull market Peak 500 days after having and it really just boils down
to that simple principle but when you have this P Cycle propagation this crossover whereby we see a drastic uptrend and then drastic curling curling up that of course threatens a traditional Haring cycle but it threatens it in the short term because of course we will see pullbacks and rallies and pullbacks and and even sideways periods which will always drastically impact this future crossover but the closer we get to a crossover the less of course we'll be able to have that wiggle room so at this point in time because of the uptrend we are accelerating slightly
when it comes to a potential future bull market Peak by a few months and this perspective is suggesting that mid July would be the earliest and so if we're talking about late May early June then even that early perspective this is earlier than that early perspective and that's just showcasing how potentially overextended this current rally is right now and a future price Discovery correction is going to be on the cards but history is suggesting that it's still a few weeks away so this price cycle moving average is probably going to continue climbing up which is
only going to continue to distort this future bearish crossover in the future so this isn't necessarily something to keep in mind as a fixed date but it is a worthwhile exercise just to better understand at which point the this crossover could occur and how these moving averages change as a result of bitcoin's price fluctuations so early mid July that's the early that we could see if we repeat a 2017 parabolic upside phase but if we repeat a 2021 parabolic upside phase then we get more closer closer to a traditional harving cycle whereby 500 days after
the Haring is what we'll see in terms of a bull market Peak but the reason that this correction is so necessary in the short term is for us to essentially resynchronize with the possibility of essentially seeing 300 days plus left in this parabolic phase of the cycle that's what it's all about at this point in time so the P Cycle crossover is occurring a little bit earlier but it's also really distorted by this parabolic advance that we've seen in recent days so any sort of pullback to simply just call this indicator down is going to
be a good thing and history just suggests that we are going to see this indicator and this moving average Cur down and kick the can down the road once again in terms of this propagation so I wouldn't be worried about this as a set in stone date it's going to change so many times over and it's likely going to change to fit this General overarching perspective of a 500 day plus bull run after the harving before a bull market Peak occurs thank you so much for watching if you enjoy insights like this sign up to
direct capital newsletter for free in the link in the description down below but of course if you enjoy videos and would like to see more videos like this going forward sign up or at least subscribe to the YouTube channel here like this video if you enjoy content like this going forward I'm Rex capital and I'll speak to you in the next one speak to soon