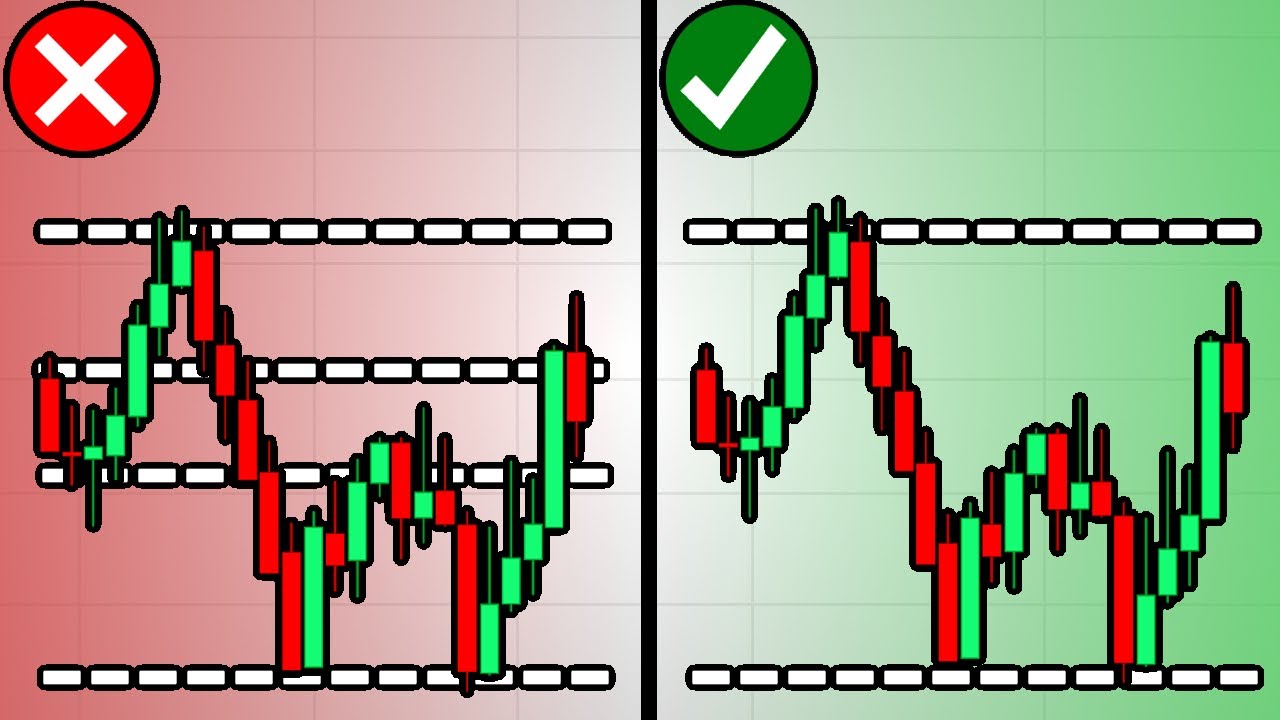
all right so let's talk about the different types of as I've referred to key contextual levels or inflection points so these are levels within Market structure within our market profiles where if we've either lost them or gained them represent that significant change has occurred or is occurring so this is also these are also rather areas where we see a substantial increase in trading activity and this is going to be indicated by likely a substantial increase in participation and presence so there are a few that we're going to go over the most common way of defining contextual levels or inflection points or areas of significance the most common one is Market structure we're all familiar with Market structure we're looking at horizontal support and resistance zones swing points within structure so if we're looking at Daily structure if we're looking at any type of structure the areas where the market has interacted with heavily the areas where the market has abruptly turned you know the areas where the market has said You shall not pass right whether that's to the upside or to the downside so we say that this is a key contextual level because this is a level where we can reasonably Define risk in a very close fashion because if we lose this level we gain this High it means that if in the case of fading this level assuming that it's going to hold as support if we lose this level within Market structure it signifies that this range has changed and at that point we definitely don't want to be behind the thesis that this is going to be moving upward because likely we'll be moving downward if we lose the underside of the structure so key areas within Market structure now we say that these are areas where we see a substantial increase in activity and that's because if we're looking at Market structure you know this is a good buying opportunity at support this is more often than not if tested again a good selling opportunity so when price approaches these levels we see a substantial increase in activity and it also happens to be that on the higher time frames these levels major swing points within Market structure are where we see all types of participants get into the mix so whereas within structure when you're more within the extremes you'll likely see this is dominated by your smaller Traders your more intraday Traders when you get towards the extremes of Market structure that's when you'll see a substantial increase in participation by Swing Traders by position traders who are not maybe as interested in what goes on within the range but are looking to find their risk around the range so the first most common one is Market structure right that is if we're just looking at this area right here we see that what preceded it was a multi-week high that was respected going back to the left we broke out of that significant it signified that there was significant change underway right this was an area of massive resistance we finally broke through the market responds expands upward and again we form this higher time frame consolidation where we have a very clear area of resistance a multi-week support and we know that if we gain this or if we lose this it represents again that significant changes underway areas within this there are clearly areas within higher time frame structure that represent sort of the smaller versions of again these key contextual levels and inflection points as well you know midpoint of a range your microstructure how you define the shape of this okay where the market has turned multiple times where we see as sometimes referred to as price interacting with areas where price has previously interacted with so in the future where it has interacted with in the past so that's the most common type that is Market structure and if we're just zooming out to give you a more clear idea you can see how this has extended multiple times in the past see support and resistance flips all the way up okay there are areas that were significant turning points uh and then once once we've gained or lost them have represented in follow through or rather have resulted in follow-through and continued movement in that direction so that's just horizontal support and resistance you know some Traders might use diagonals okay to represent that price has more or less respect to the level over time that has changed okay this is more of a dynamic uh significant level a dynamic contextual level the most common one the most the one that holds the most weight is in that case I would say the horizontal levels because over time horizontal levels are not going to change so for example in 8600 horizontal support that's not going to change Until It Breaks whereas if we look at something like let's say we're just drawing a diagonal trendline support all price has to do to break this is essentially move sideways Through Time so that's the most common type just using basics of Market structure now when we get into Market profile we talk about the concepts of high volume nodes low volume nodes high volume nodes are essentially these large structures within our profiles so large structure right here large structure right here very prominent structure a little bit less but still the idea is we spent a lot of time in this level okay so a lot of time in this level now again we're just looking at the TPO but we can see underneath the structure there was a great deal of volume that was transacted that confirmed that level but these are the fat points within Market structure so looking at a TPO chart the thick areas within the chart these are the high volume nodes where we spent a great deal of time now more often than not you're going to see that the high volume node and the value area share the same general area so we'll typically see that the high volume node is somewhere at least within the value area where most of the volume and most of the participation occurred remember that is where seventy percent of that occurred so high volume nodes are key levels okay what they represent is sort of the same thing that we were just talking about they represent underlying Market structure that is confined to a general area so if we look at this high volume node right here if we were to expand this we'd see that this was pretty much coinciding with the high of this range right so if we're looking at from 514 to 520 and we go on to our chart over here so we'll go to 514 to 520. we're looking at the top side of the structure that high volume node is right here okay which actually represents the final turning point that price was dealing with as resistance before ultimately breaking down and this single high volume node within this structure so if we go back to the TPO so we'll go to that TPO again hopefully it'll work there we go so this single high volume node right here that we could see occurred between 90 720 and around 98. 40.
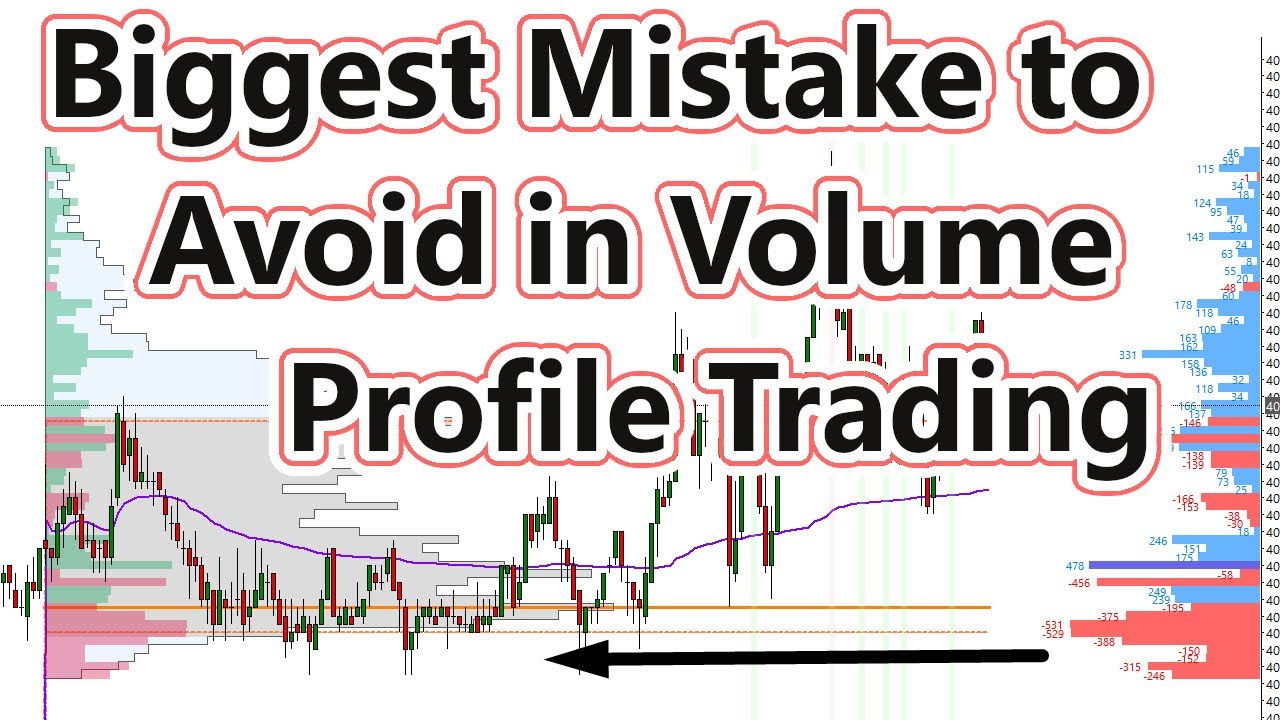
if we look back at the price chart we see that that extreme again tracing that back was coinciding with a significant swing Point within Market structure looking at the daily chart rather the four hour chart so it's not arbitrary that something like this fat portion within the structure is constructed okay what we see that there's a great deal of Confluence between this and previous levels within actual just Candlestick structure and if we're looking back at the levels of thickness within this entire range so high volume node is that it's the the large perturbations or large structures that are on these tpos and it represents that we spend a good amount of time there and what that means is that there was definitely a good amount of structure that was established in that area so high volume nodes these are areas where we can expect the market to slow down as it passes through or as it approaches to act as a support or resistance so low volume node is the opposite so low volume node is this depression right is the depression it's not you know this area that's a lower volume node next to a high volume node it's the depression within this volume structure So within this TPO chart and within the underlying volume structure so we see multiple low volume nodes we see low volume node right here we see low volume node right here right here towards the end of the Tails okay that's where volume completely drops off but we're looking at the ones that are focused rather within structure so right here right here right here and these are areas where there was not much two-way trade at all these represent imbalances there is not much activity at all there was no trade facilitation it was very one-sided these low volume nodes are areas where the market pass through very quickly so typically you'll see that they are formed during Trends so this is a trending structure right here in between the consolidations the moves the expansions between consolidation to new consolidation those expansions result in a low volume structure so a trend is an imbalance structure by its own nature it is moving from a constantly redetermined value area or it is rather constantly redetermining the value area and what we would say is this low volume node since there was no trade facilitation in there previously we would look for these levels also to act as potential support or resistance so if we are in this case if we are within a high volume node so for example let's say that we have currently closed out within this structure over here and we're using this as an example so this is our example right here we are currently within the structure before breaking down but we would look for is for this low volume node to in this case act as a resistance if we approached it again so we have a low volume node within the structure we're currently under it we're looking for this area to act as resistance okay this represents a very imbalanced area it's it's likely that as the market moved down we saw a ton of aggressive selling in this area and we'll see that when we start getting into the footprint and Order flow and we're going to look for this area to be defended on the same note a low volume node if it's not acting as supporter resistance if we gain acceptance through this level we'll likely pass through it very quickly so that might sound confusing because we just said you know we're looking for this to act as support we're looking for it to act as resistance depending on what level we're approaching it from or what direction we're approaching it from but if we gain acceptance within it we'll more than likely cover it so if you see and we'll find a better example because these are kind of tight over here if we go back to a low volume node like this if you see that we're trading into this we should see that initially it's going to act as support so here's your low volume drop-off right there you see the single prints within the structure and then as we look at how we have rotated towards that structure we see that multiple times the area that did not facilitate trade prior the area where there is a great deal of imbalance within the structure acted as support and moving forward if we continue to press this level we'll likely fill it out okay so we test it once we test it twice we come back down to the sport again for the third time and then what we ultimately do is in the future fill the structure out so you have to keep an open mind right when we're looking at these levels and not only keep an open mind but rather know how to use these right if we're seeing the first time that we're returning to this level we would expect to act as support if we're texting this level multiple times if we're constantly grinding against this level it does represent an imbalance and the market might essentially clean that up might fill that out but for the first time before interacting with the level we can expect these low volume levels to act as since they were levels where there was not much two-way trade facilitated to begin with we'd expect them to act as support and resistance okay until we start pressing into them until we start showing signs of as we talked about previously in the video on being accepted versus being rejected until we start to see signs that were being accepted in this level through volume and participation or presence also so those are low volume nodes there where there's not much going on within this TPO whatsoever it represents an imbalance it represents a lack of two-way trade it's very one-sided the next thing we're going to talk about is the point of control key contextual level because this is the fattest area right this is the thickest high volume note so when we talked about high volume nodes we're talking about these mountains along this structure if they were flipped these would look like beautiful Horizons of mountains right but the point of control is actually the largest one within that structure so point of control within this structure point of control within the single TPO if we're combining and making composite the point of control represents the most fair value area within the structure because it represents where we spent the most amount of time now remember this is a point of control for a TPO chart we're not talking about the point of control for a volume chart yet ideally we would want to see these confirm each other but the point of control is technically fair value within the structure according to Market profile Basics right the original tenants and Market profile point of control is fair value that's where the buyers and sellers were in most agreement that's where we spent the most amount of time so technically that's where we established the greatest degree of structure so over the course of these individual rotations that is where we spent the most amount of time okay so if we look at or where we interacted with the most so if we look at this structure moving forward this should be an area where we can expect a good amount of friction so as we're approaching a point of control as we are approaching it from the underside or from the top side this could be an important area of support or resistance if we are approaching it and we're currently in a tread trade we could expect that this will likely again cause a good degree of friction in the opposite direction or sometimes referred to as stickiness so for this reason this kind of contextual level does represent a good area to take profit or at least consider are managing the trade so point of control is the highest volume node within this structure and for that reason a lot of the times it can act as one of the more important barriers within structure so if we're just looking at for example we're going to combine this profile which is relatively a range if we're looking at this structure from where we currently sit right here we would say that above us a key contextual level where most of the volume was transacted in the structure above us that we would need to deal with moving forward is this point of control right around 91 91. 80 okay so this has been volume shifting down over time this was the last point of control within the structure above us so a change something that would be significant would be regaining this structure so flipping this structure what that would mean was that we pass through uh the most you know hide the high density Point within the structure above us right the area with the greatest degree of structure the greatest degree of presence and in this case actual volume as well so the next thing we're going to talk about is the naked point of control so this is a concept that we'll refer to quite frequently a naked point of control is just a point of control from a previous structure that has yet to be interacted with okay so a point of control remember this is an area where there's a great degree of volume that's transacted there's a great degree of trade as we can imagine when you have a great degree of trade facilitated in one area you likely have a lot of people that got in at that area Okay so people that are going to be defending their positions people that potentially be covering and then again if we start passing through that level an area that will likely be retested and serve as either support or resistance depending on what level we're coming from so a naked point of control is a point of control that has yet to be interacted with with a future profile so we can see that on this chart right here we actually have two naked points of control that are currently untested now these serve as inflection points moving forward but they're not as strong as obviously greater time frame Market structure something like daily and weekly but we would expect again a certain level of resistance in this case moving up to 91 92 9220 or 9210 and then this one even further up around 97 we'll say that's 97. 40.












![How I Beat the Mental Game of Trading [After 5 Years of Failure]](https://img.youtube.com/vi/4gaaGDldQwY/maxresdefault.jpg)