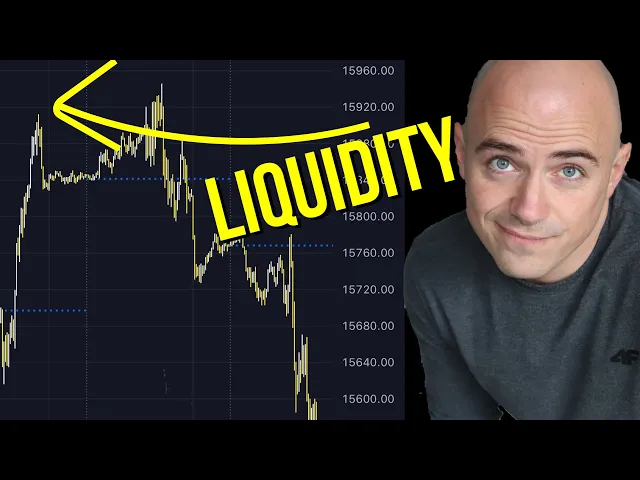
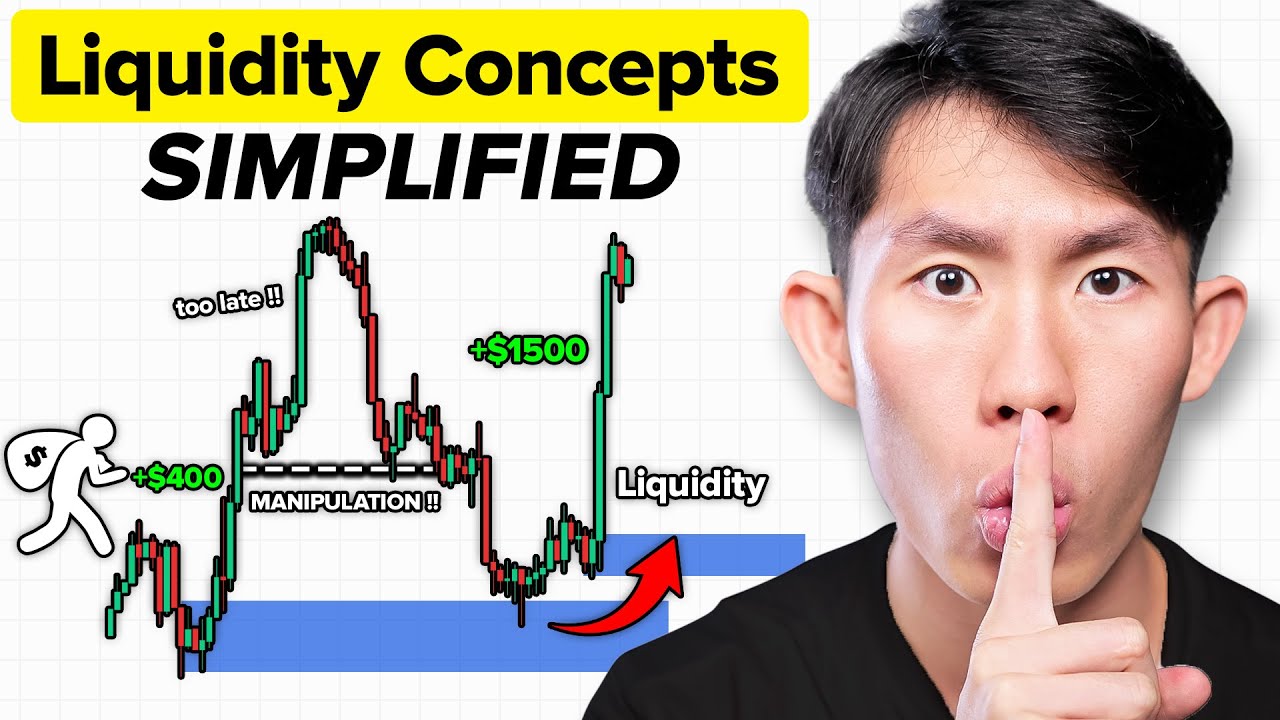
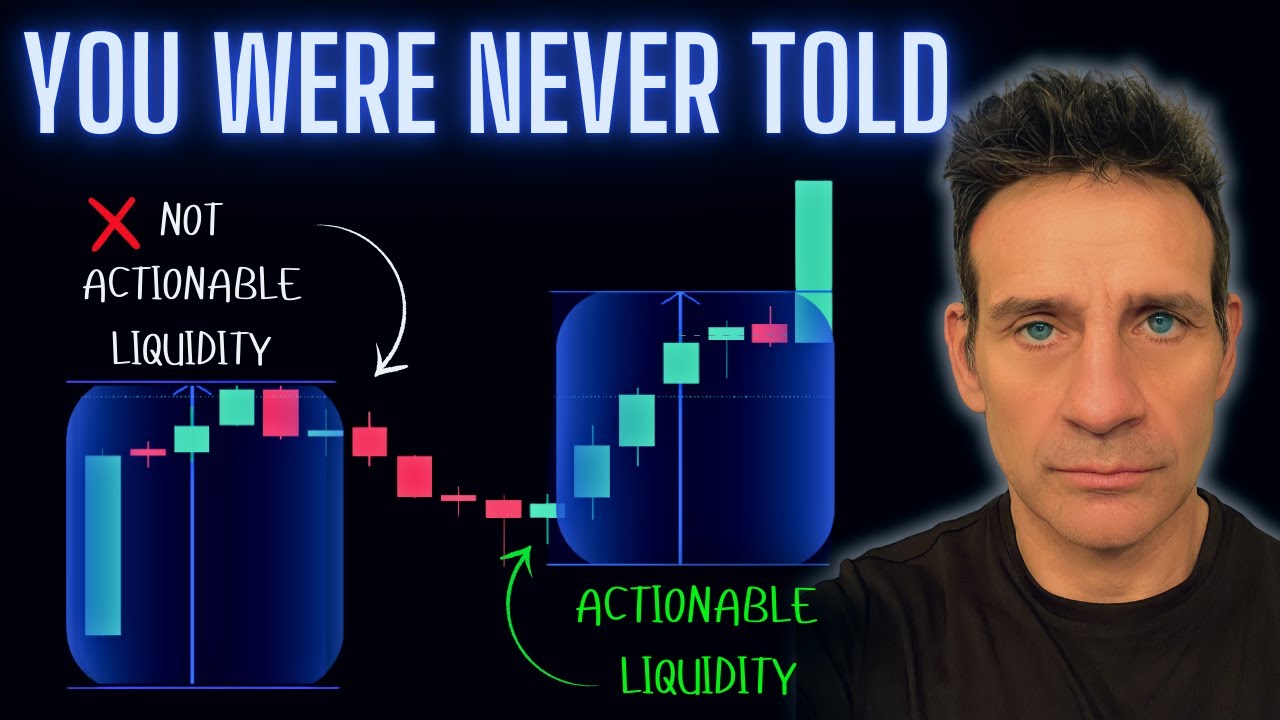
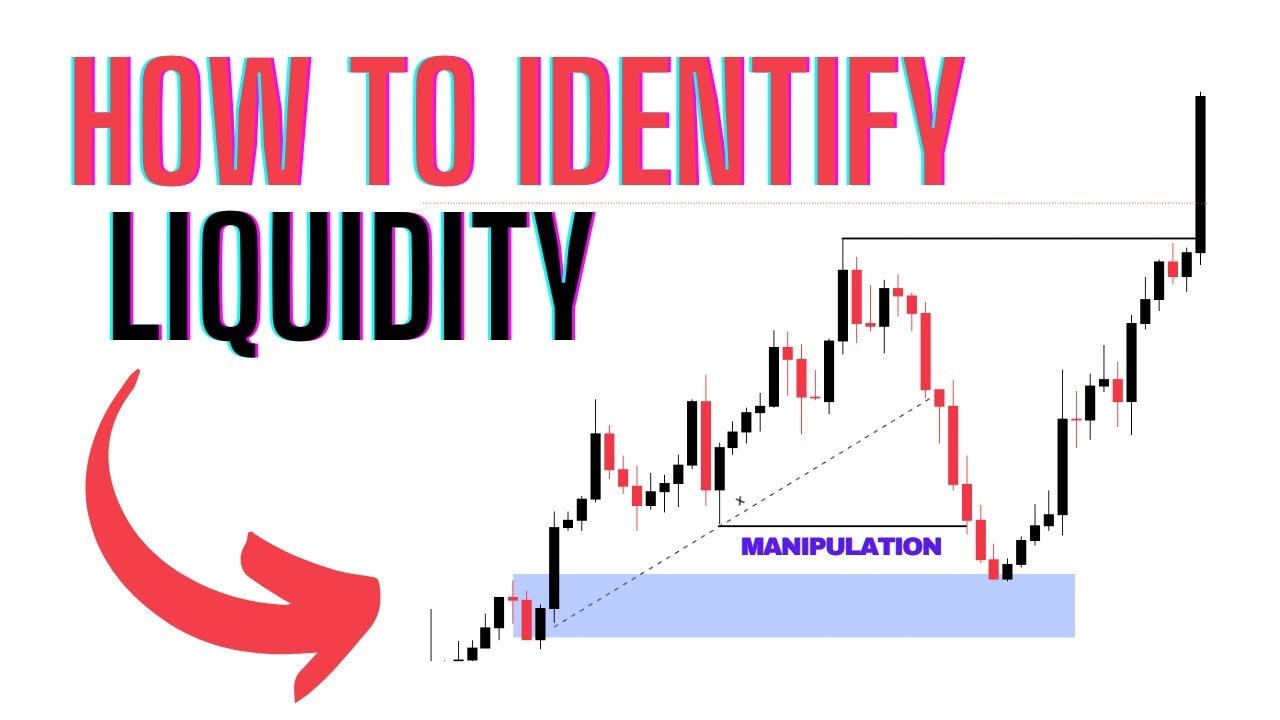
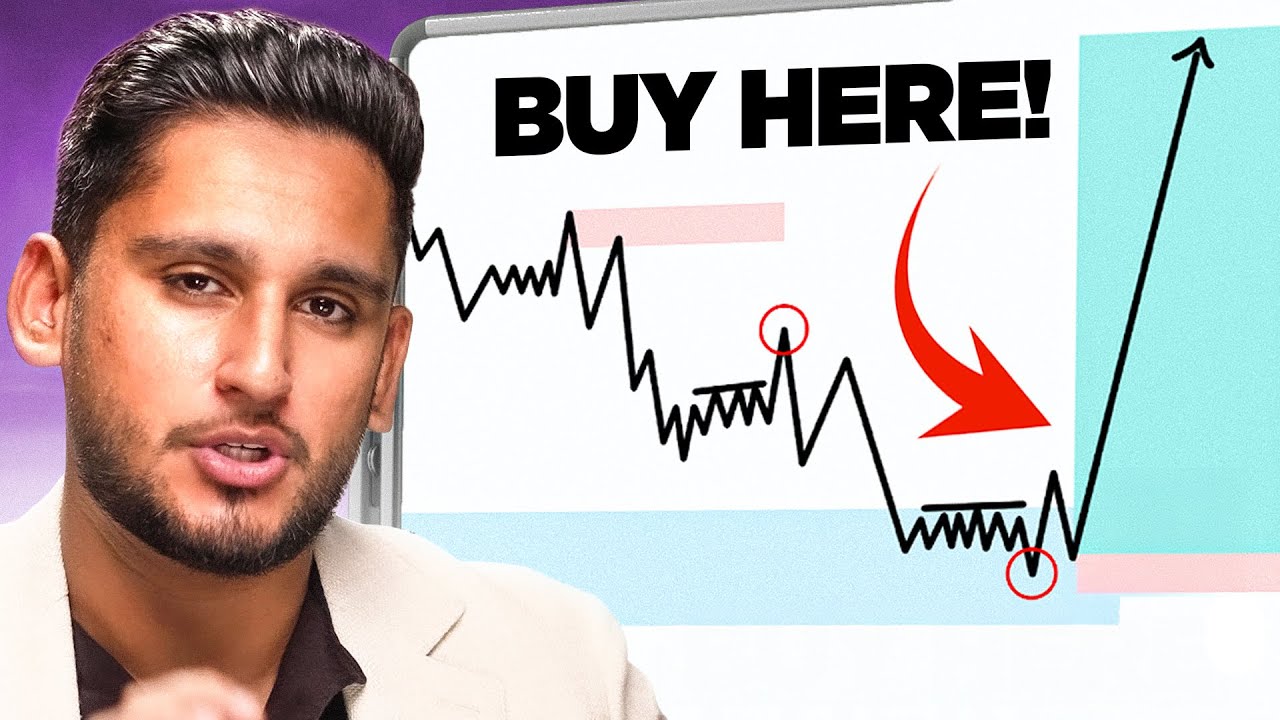
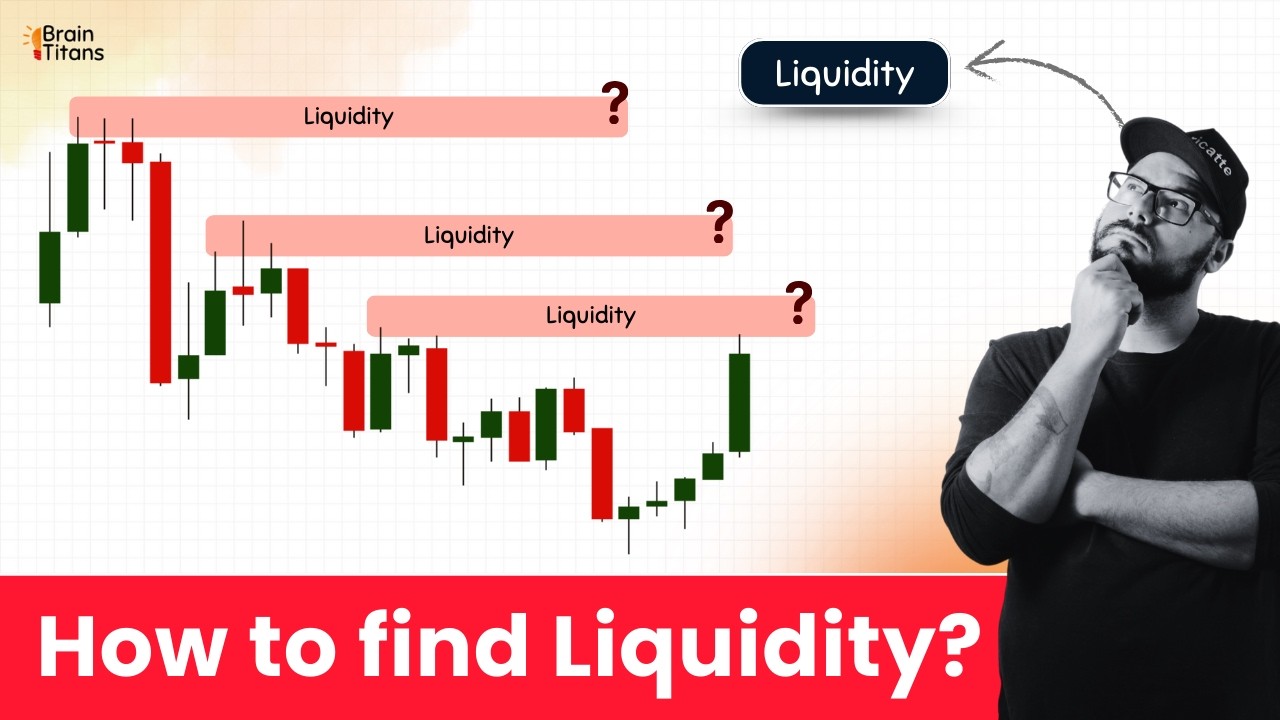
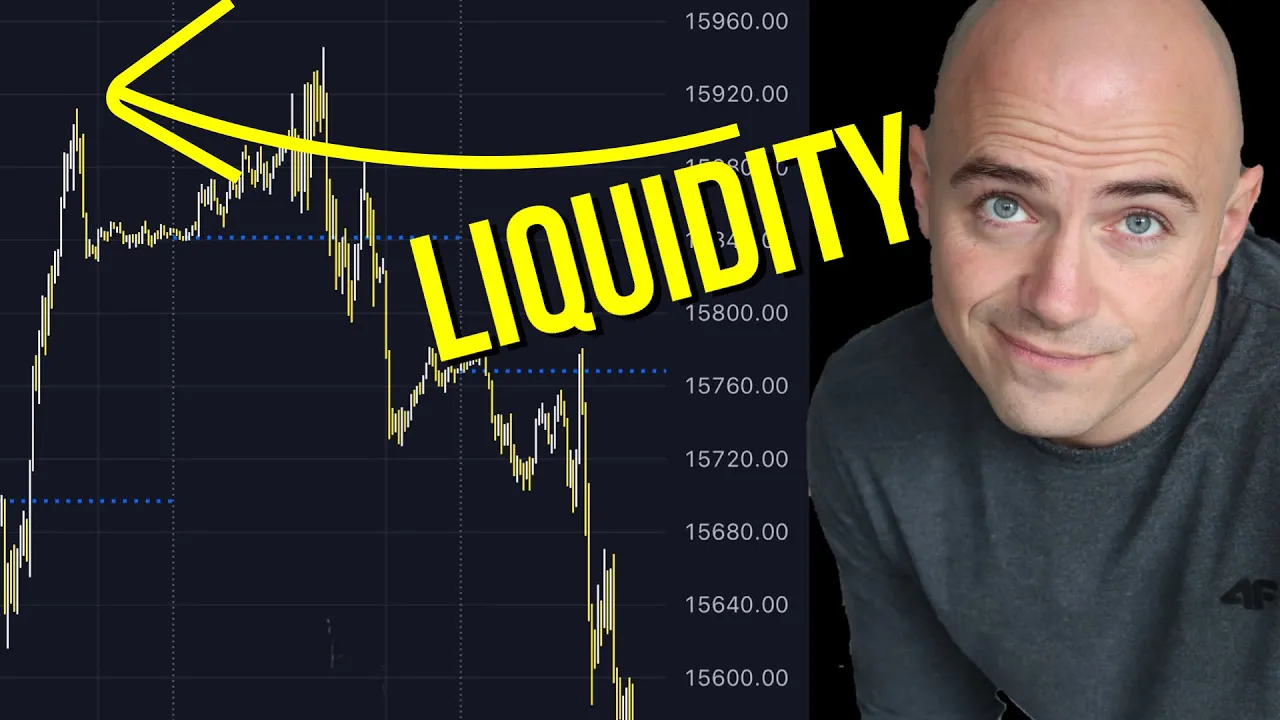
I really don't think that people understand what liquidity is think about it in traditional retail if you've got a thousand iPhones that you need to sell like physically you have a thousand iPhones how are you gonna sell that to one person or a group of people in one shot you need to go to where the buyers are you are a seller you need to go to where the buyers are in order to sell all thousand iPhones you going to that area is an area of liquidity because there's money there so you can exchange the product
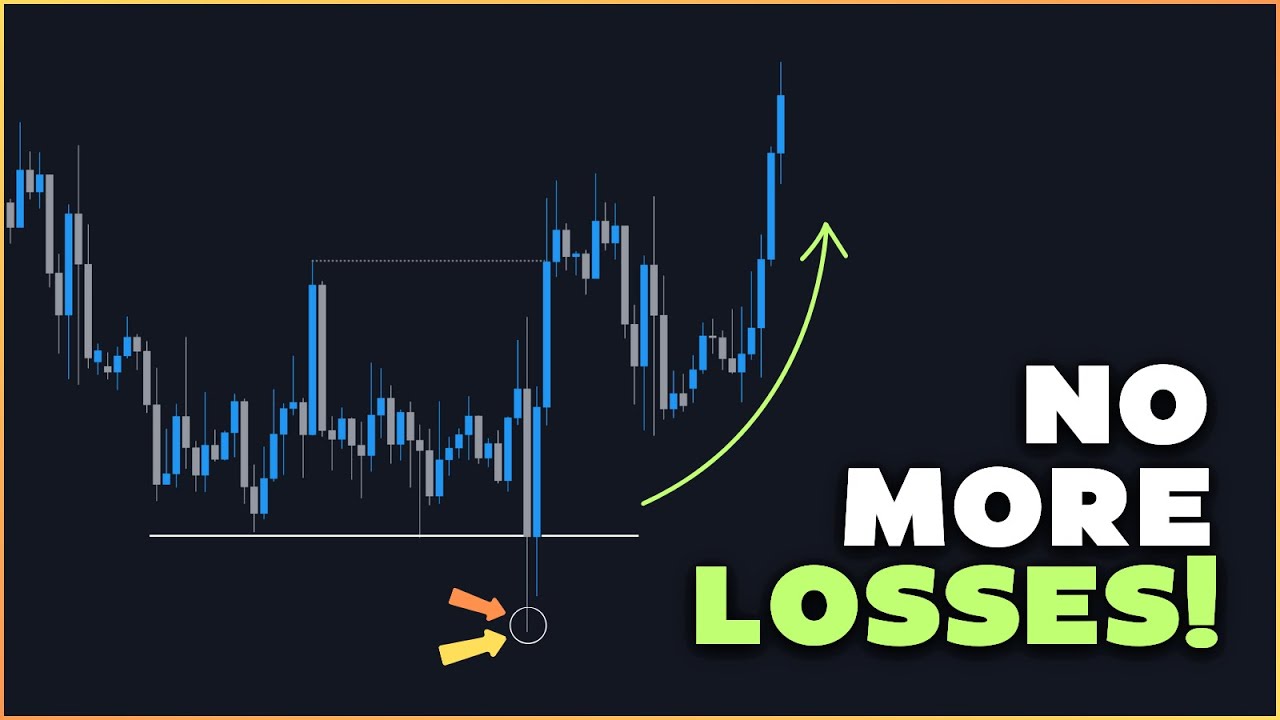
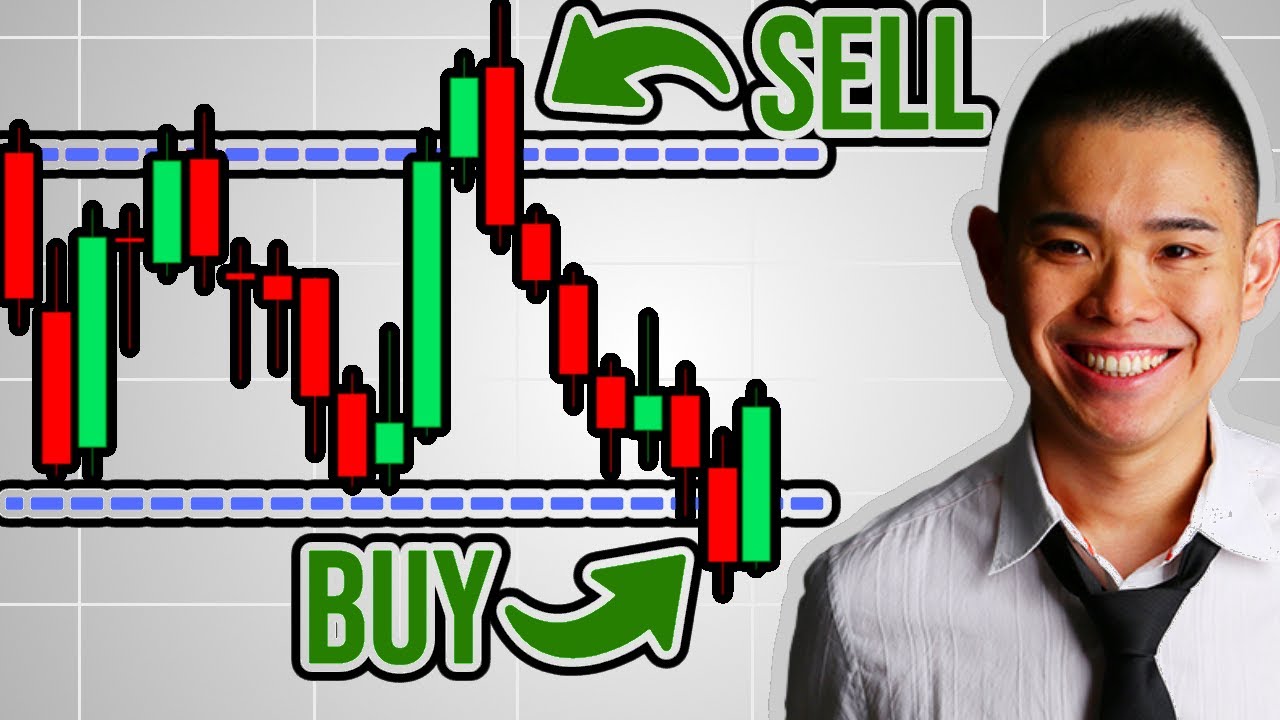
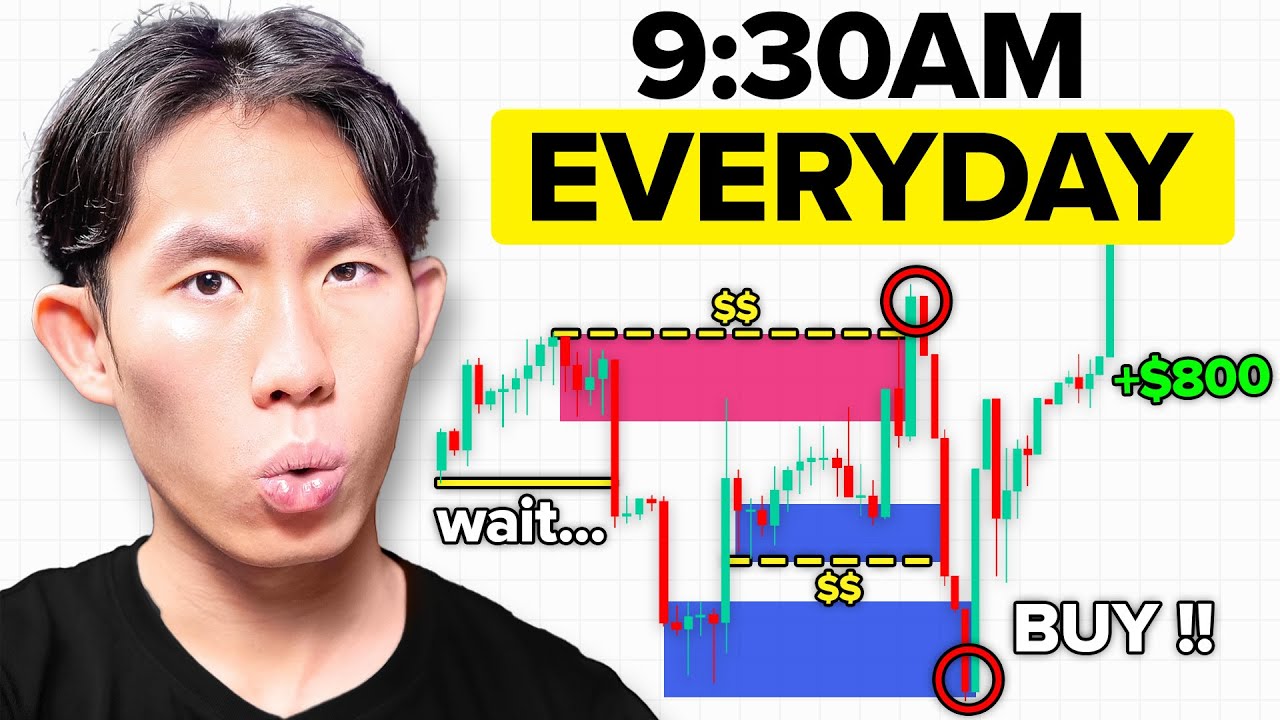
for the money so if you see the price of US 30 or Australian dollar US dollar or euro dollar going way way way way way up it's going to an area where the sellers are then once it gets there it's satisfied and it's sold all of its units and it just that's how liquidity Works in this video I'm going to show you how to find areas of liquidity on the charts so that you can take the delicious trades that just get you those nice big moves and to prevent you from getting stuck in the opposite
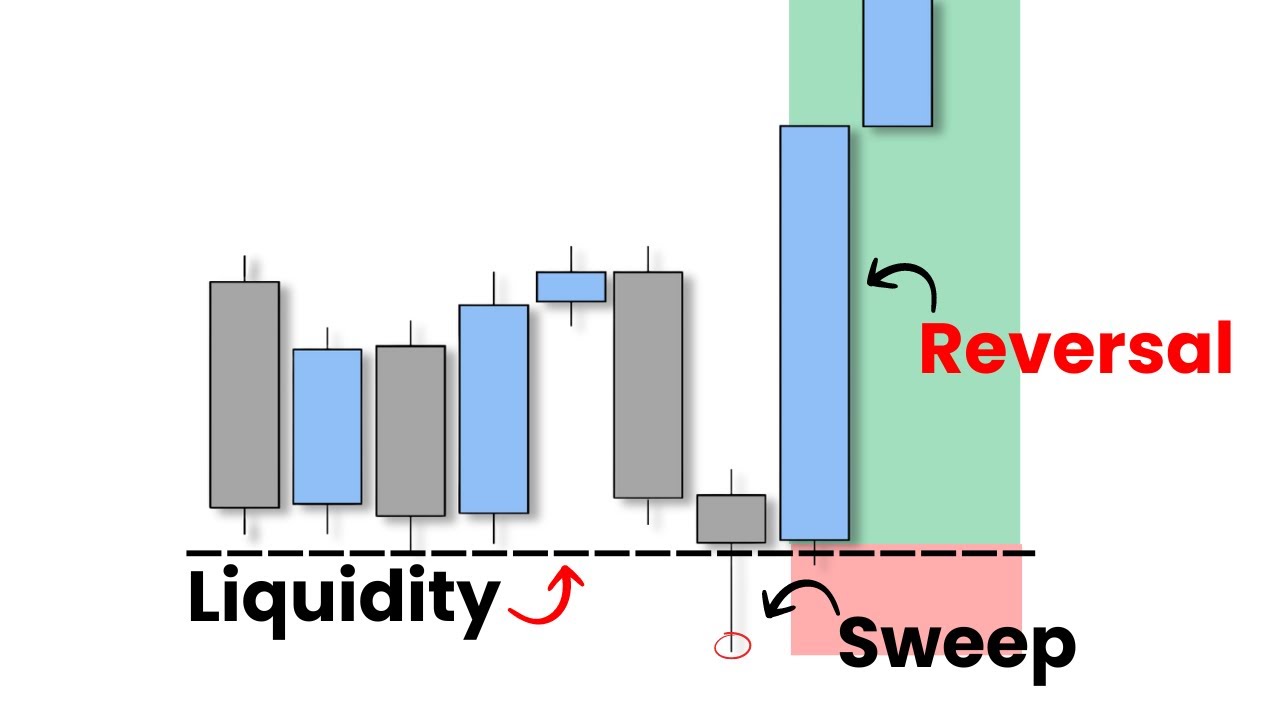
direction okay so this is Nas 100 on The Daily time frame price stopped going up right here and started to go down breaking this previous structure coming back up and do you see this Wick right here right above that right there was liquidity came up here tapped it and continued down grab this liquidity and started to come down what was it coming down to and looking for more of it kept going down if we look to the left we can see areas right here right at this area right below here there's nothing price came down
and made this very long Wick right here to tap out the liquidity below this once it was satisfied with that liquidity it started to go up it is now going up so it is now looking for the next available liquidity as you can see right here this High Point was 15 to 65.98 this High Point right here was 15 274.65. it is now above this area at 15 300. it has grabbed the liquidity from this area I don't know if it's going to reject down now because it grabbed enough liquidity or if it's not satisfied
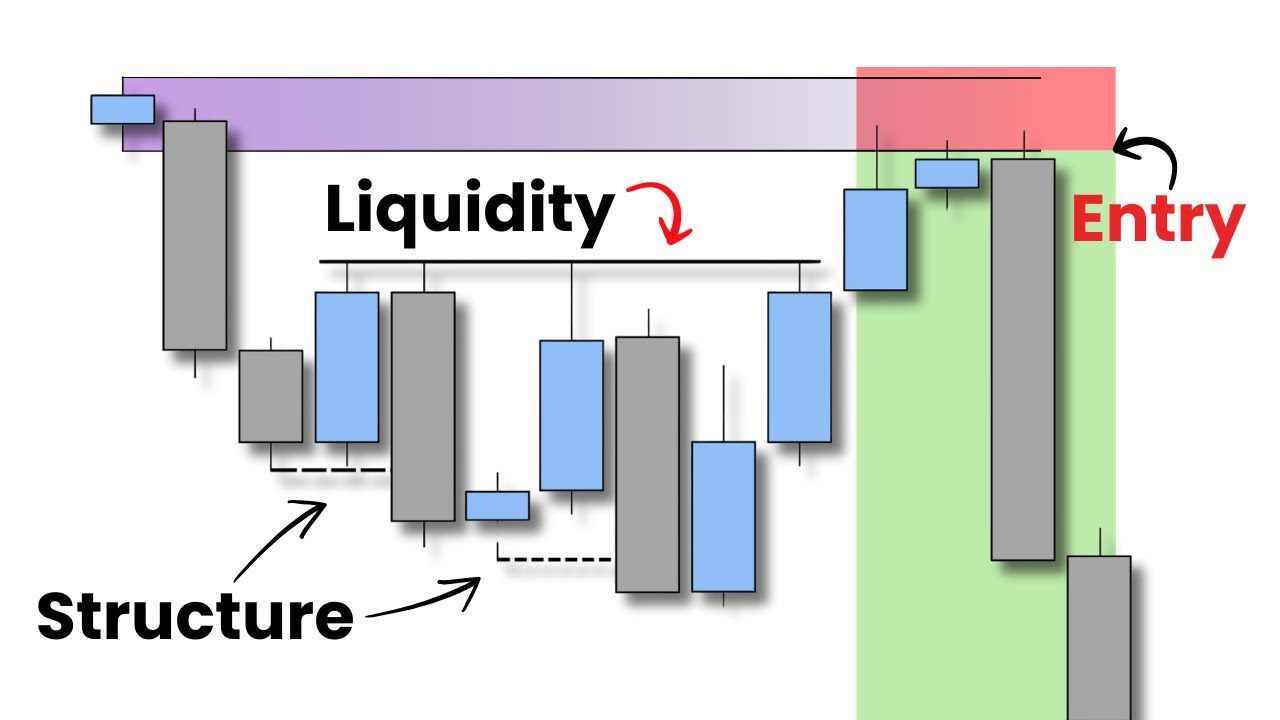
enough yet and it will go for this liquidity that lives above here because above here is a lot of liquidity so it might continue up grab this liquidity all of the buying or selling orders that live up here and then Cascade down in order for price to move up there has to be a large buyer down here in order for a large buyer to exist there has to be the number of sellers if people have stop loss orders right here on buy orders stop loss orders on a buy order is a sell order and also
if breakout Traders have their entries right here for short that means that there's a lot of sell orders below this area which is why once price got to this area it shot up so what I want to explain right here is as price was going up you see all these high points and low points this perfect Market structure coming up this is all Market structure and because of this Market structure it was very hard for price to get down to this area this makes it hard for price to come down which is why we got
so much of this price action on the way down because this right here is known as high resistance liquidity for price to get down to this it needs to fight through all of these levels once price fought through all of those levels as you can see it whipsawed back and forth forth until it was satisfied with the liquidity now price is balanced so all of the buying was balanced by all of the selling so all of this area is now balanced price now price has free reign to go to the top right here in a
very low resistance swing because price is already balanced over the last two years but because this swing up is so smooth this is now an area of low resistance there's very little market structure on the way up here so if price does start cascading down it's going to do it extremely aggressively because it's got no resistance of price movement to slow it down price wants to be balanced so when this starts coming down to grab liquidity below here it's going to do it very very quickly there's not going to be any of this zigzagging