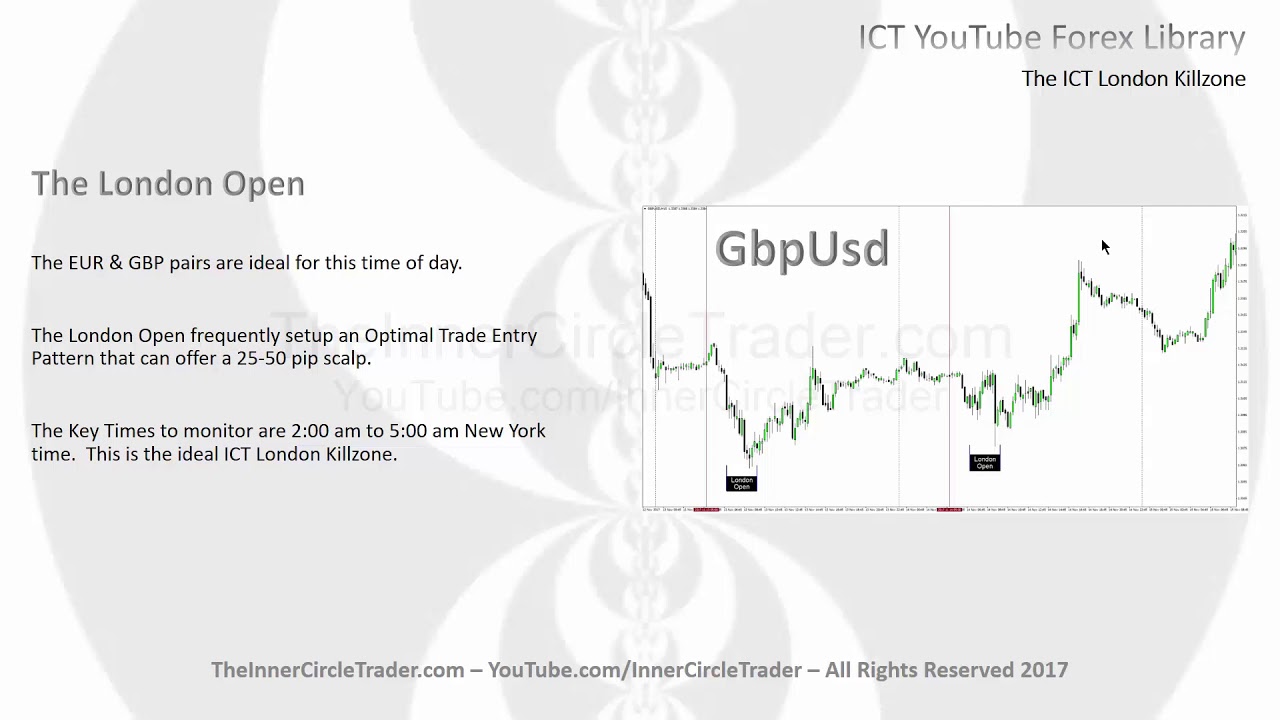
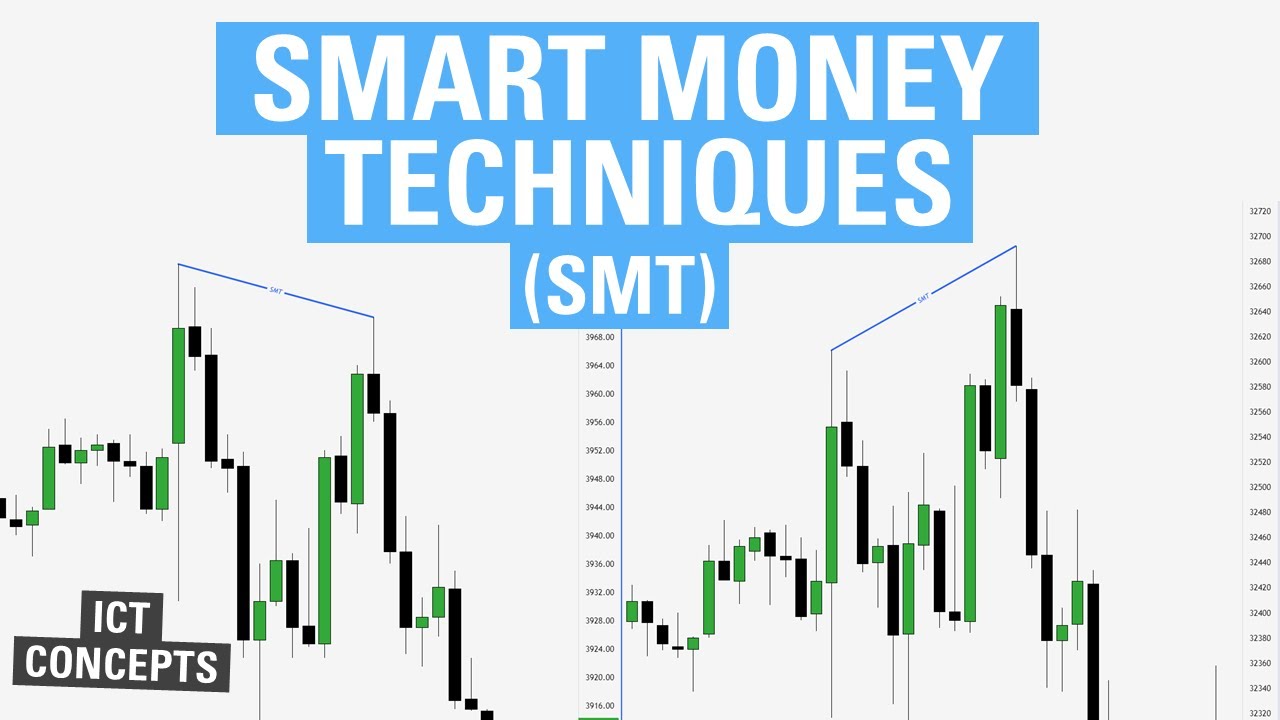
hey folks welcome back this lesson is gonna be teaching my eye CTS Mt divergence or ICT smart money technique ok the focus points on this module are introduction to the ICT SMT the SMT divergence in bullish conditions and the SMT divergence in bearish conditions okay folks we're looking at the Aussie dollars is a daily chart and I'm going to cover the SMT divergence specifically this teachings only be only on the USD X SMT divergence there's many different concepts for SMT that I teach but just to keep things simple and easy to understand one of the
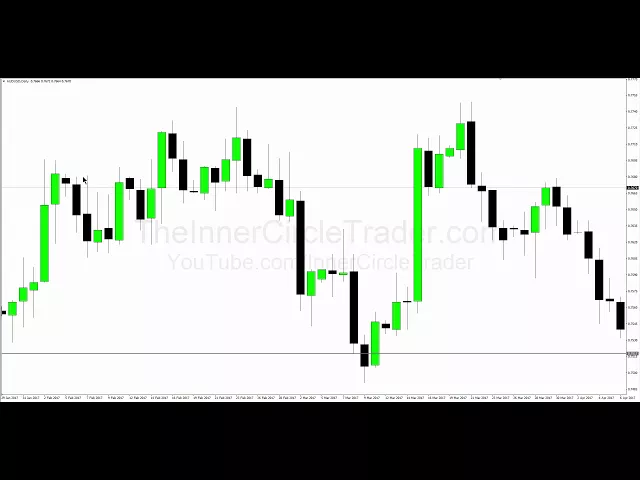
most powerful ones that I use is the relationship between a dollar index itself versus foreign currency pairs alright so we're gonna take a look at the Aussie daily and we're gonna highlight this little area right in here ok and what went on before the big move up now I'm gonna cover some things each you've already been exposed to so you can see how things start to more or less dovetail together and it helps you give you a better interesting at what price actions should do in the coming sessions and days the SNT diversions or SMT
smart money technique is something I've discovered by studying relationships between correlated assets and correlated markets and actually developed it and the understanding between the commodity markets when also commodity futures trader before FX I would look at the grain markets and I would look at the currency markets and I'll look at the bond markets the 10-year five-year and 30-year notes respectively and I would compare their price action with one another and I started seeing a setup that would always be there when significant price moves would occur and I think that if we were in a room
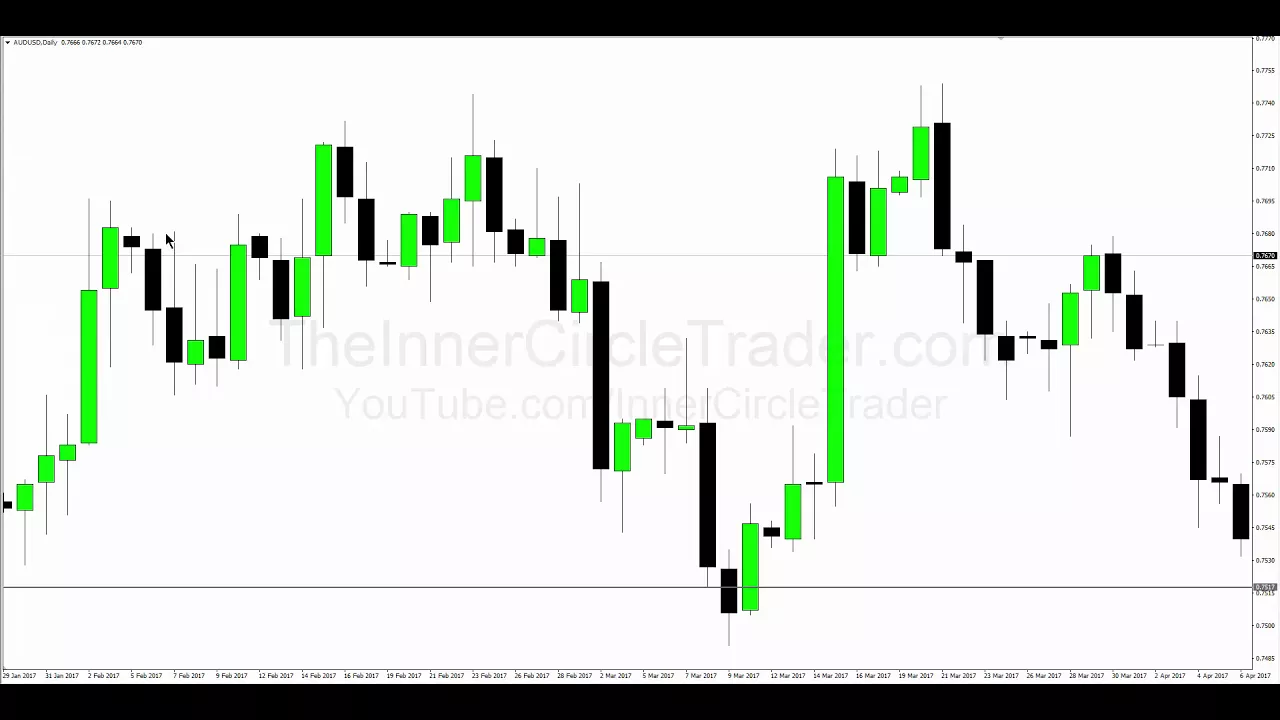
together and I asked everyone by raising their hand if they felt this move here on the Aussie dollar was significant and a worthwhile study in terms of what made this price action movement I think everyone would raise their hand or at least the majority of them in the room would raise their hand and agreed that this was a significant price maybe this is a daily chart so it's over 150 pips so it's respectable so I want to go in and do some breakdown on this low in here and show you some of the things that
takes place and how also you can use the S&T diversions for bullish scenarios and that's we're going to cover now okay so I have a crude diagram up here and this is going to more or less help me illustrate what it is that makes an smt divergence and for the sake of this specific bullish scenario we're going to refer to the blue line up here okay that's going to represent the Aussie dollar and the red line is going to represent the dollar index okay so in a symmetrical market where everything is as it should be
when the market creates a lower low and for instance in the Aussie dollar the dollar index should make a comparable higher high so while the foreign currency makes a lower low it should be reasonably expected to see the dollar index make a higher high this is what this is this is referred to as a symmetrical market sometimes you will see the market create this the market will fail to make a higher high at the time when the foreign currency makes it lower low so if the dollar index fails to make a higher high at the
same time that the Aussie dollar makes a lower low this is a cracking correlation so that means there's something going on underlying behind the price action that's showing heavy distribution in a dollar index because it's failing to make a higher high when it should reasonably do so if this is a lower low in Aussie conversely another scenario might be this and it would mean the same thing okay so I'm giving you two examples here that would give you the same analysis that being there's a cracking correlation okay so now we have the dollar index making
a higher high but now in this case if this was representing the Aussie dollar the all D dollars failing to make a lower low so this is suggesting that all Zee dollar is being bought up because it's failing to make a lower low otherwise it should have made a lower low as the dollar index made a higher high so when we're looking at SMT what we're doing is we're looking at exactly the same timeframe at exactly the same reference points or candles either one of these scenarios means the same thing what we just shown was
earlier the dollar index was failing to make a higher high while the Aussie dollar made it lower low that is weakness on the part of the dollar so that would be bullish or Aussie dollar here we see the dollar index making higher high and the Aussie dollar failing to make a lower low that still is bullish for Aussie dollar okay it takes just this relationship to be present and price action for you to see when there will be most likely a turning point or in this case accumulation in Aussie dollar so we're going to go
into this idea and I'm going to show you how we can take this information so I'm gonna take this idea and flesh it out using the Aussie dollar okay and I want you to take a look at the overall price structure on the daily okay so obviously we've seen Aussie dollars been trading lower for a long period of time basically since September of 2017 we've had several months of bearish prices so if we go out to a weekly chart okay and we have this really nice dynamic price movement here so we have to go right
to the down close candles and both these candles here back-to-back down close candles so we're gonna use the top of the most highest candle it's going to be our bullish order block and you'll learn more about these in coming tutorials so the high comes in at seventy five seventeen and seventy five seventeen is our level so we're going to take that level keep it there I'm gonna drop back down into the daily okay so we have our level here and also notice that we have equal lows okay so we have equal lows here on the
daily and we'll look at that one get down to an hourly chart and we also have equal lows here as well so won't reference both of those liquidity pools but we want to keep this level in mind because it's going to be significant in a couple minutes if we drop down into an hourly chart okay so we can see the hourly price action dips below that weekly bullish order block okay you can see that actual accumulation taking place rallies up retracements optimal trade entry and then nice expansion on the upside we're gonna take a look
at a few things over here we have our liquidity pool okay so we have this area here okay there's 30 pips below that and then we have another area over here okay so 30 pips below that and takes us down below into the daily into the weekly bullish shoulder block so we have to liquidity pools that price had reached for and then we went inside of a weekly bullish shoulder block okay so we have a lot of things going for us in this particular pair but I want you to take a look at this overall
price structure in here and I can see accumulation based on the price action itself but what if we had an opportunity to use not an indicator but price action of the dollar index itself to measure whether there's really smart money buying on the Aussie dollar here or if it's just noise now again we're assuming that we don't know this portion of the price action is taking place yet we're just looking at this whole area right in here the consolidation rate for the start of the move higher so let's take a look at this price action
ringing in the dollar index on an hourly chart as well all you have to do is take your chart and open up an hourly our chart open up an hourly chart of the dollar index and plot it with your window feature here on Windows tab at the top of Mt force form and you're gonna click on horizontal okay when you click on horizontal you have two charts open one time it'll plot it just like this that may put the dollar index on the bottom side or it may put it on the top in this case
it has it on the top doesn't make a difference because we're gonna be able to look at everything as we would regard to what orientation it is so we have the dollar index okay you always want to check your little data here showing the fifth of December 2017 and we're gonna have to roll back that by zooming in so that way we have the same reference markers okay you know I want you to take a look at closely and see what you see here I'm not gonna say anything yet I want you to take a
look at what you can spot on price action alone okay we've have the Aussie dollar failing to make lower lows here at the same time the dollar index was making higher highs okay see that says there's the start of accumulation in the Aussie dollar then we have the Aussie dollar making a higher high relative to this high here so if we draw a straight line down from that we're going to reference this low okay and if we draw a straight line Imagineering from this high straight down that represents this low okay so what we have
a graphic depiction of real accumulation and the Aussie and okay we can see the higher high in the dollar index we should see a lower low in the altie dollar we don't we don't see that so that means we have accumulation in Aussie dollar distribution in the dollar index not surprisingly this is exactly the same time when we saw the dollar index straight up into its daily resistance point okay that old high look at this level here and this level here this is distribution because we do not see the Aussie dollar making a lower low
so everything works like a teeter-totter okay if one side goes down the other side goes up if one side goes up the other side goes down if we put the dollar index on one side of the teeter-totter and the Aussie dollar on the opposite end what's being suggested here is there's more buying in the Aussie then there is buying on the dollar index even though the dollar index made a higher high here it looks like an outward base value only it looks like it's broke out it's bullish but if we start ringing in other correlated
assets like inverse relationship between Aussie dollar and the dollar index we can see that there's actually massive accumulation coming in at that very moment and we've already seen early signs of it back here because the Aussie dollar was making no attempt to make a lower low when the dollar index was making a higher high okay then we had a really nice interview term high relative to the hourly chart and failure to go lower again on Aussie so now we can look for optimal trade entry Long's at the same time that the market was getting ready
to sell off with an optimal trade entry so here so I'll give you an example what that looks like again sticking to the bodies of the candles the bulk of the volume rate there's a lowest body boom 70.5 level and in down she goes here similar idea just in Reverse okay we have the lowest body here drag it up to the highest body perfect 70% and I'll zoom in on that you guys can see it perfect delivery make sure I got it right on your side on my cheat right there 3 on top of this
body delivery of 79% on the Fed 300 extension nails it beautifully SMT divergence gives us an x-ray view of what accumulation and distribution may be taking place in price action Italy is a little confusing if you have not seen it before or studied it because it's well it's one of those things that you you have to study it for a while to get a couple examples of its use but this would be a bullish example of it with distribution and the dollar and accumulation in the Aussie dollar so let's take an example of it being
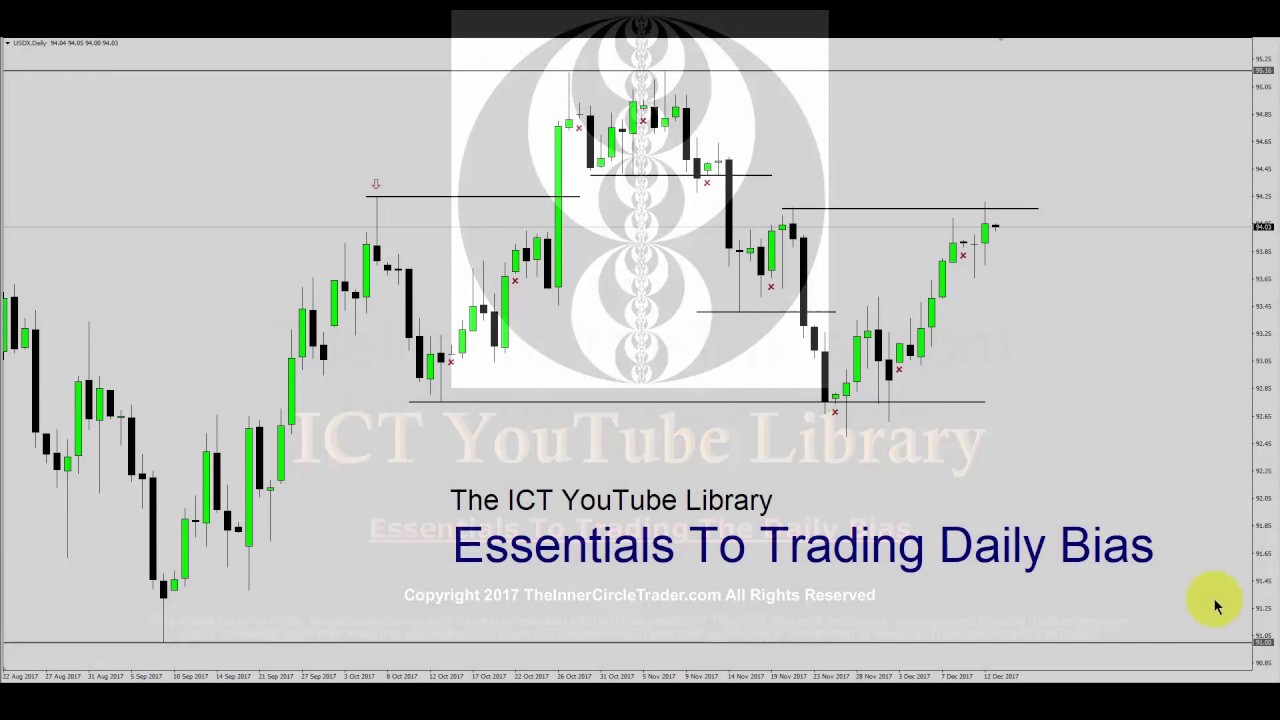
used in a bearish scenario ok so here we have the dollar index on the top hourly chart and the table out a chart on the bottom you see that the dollar index here makes a lower low here so face value it looks like dollars week at the same time the cable market you can see is not making a higher high as you would expect it to do so this is a cracking correlation that means that this isn't weakness this is in fact weakness because it failed to make a higher high when it should have what
the dollar making a lower low this shows underlying weakness in the cable and this is actually a false move below the old low this is going to be accumulated for longs for the dollar which is gonna relate to we're gonna translate into a weaker British pound and you can take that scenario and then Tessa pay weakness and start looking for areas of liquidity for cable underneath old lows and they would be your targets and we have lows over here equal market trades to it there and then we have equal lows over here market trades to
it here and finally below over here and it does that as well okay so this is an example of a bearish smt divergence when a dollar makes a lower low and the foreign currency fails make a higher high the weakness is in the foreign currency failing to make the higher high this is going to be a turtle soup long and this is going to be a failure swing or bearish scenario and you can look for opportunity to get short with an optimal trade entry sell and cable highest body open or close down to are reactionary
low here awesome trade entry here stop would be above this high you can see ghost a symmetrical price swing rather nicely and we have smaller ones in here too you could have used this range to this range here optimal trade entry again goes to the symmetrical price swing as well so there's several examples in here that you could used for optimal trade entry entries on short for a weaker British Pound because it failed to make a higher high when the dollar made that low or low the premise behind it is this is what makes it
work is this movement lower in the dollar upsets the majors everything that's paired with the dollar what we do is we look for currencies okay foreign currencies to fail to that same respective pattern but in a mirror image so that the dollar makes that lower low we go through all the major currencies and seeing which one fails to make that higher high as you would expect it to do if it doesn't it's showing underlying weakness in that particular foreign currency which is still bullish for the dollar and what that means is we could be a
buyer below this old low and say say this wasn't a dollar up here say say they were reversed they say the lower chart here on the bottom say that was the dollar index and the top chart was cable if I had this scenario here I would be buying below that low here on cable with the idea they said turtle soup long false breakout or run on sell stops and now I hold for higher prices as a result hey folks hopefully you've enjoyed this presentation if you like what you saw and you want to find more
you can go to my website at the inner circle trader.com