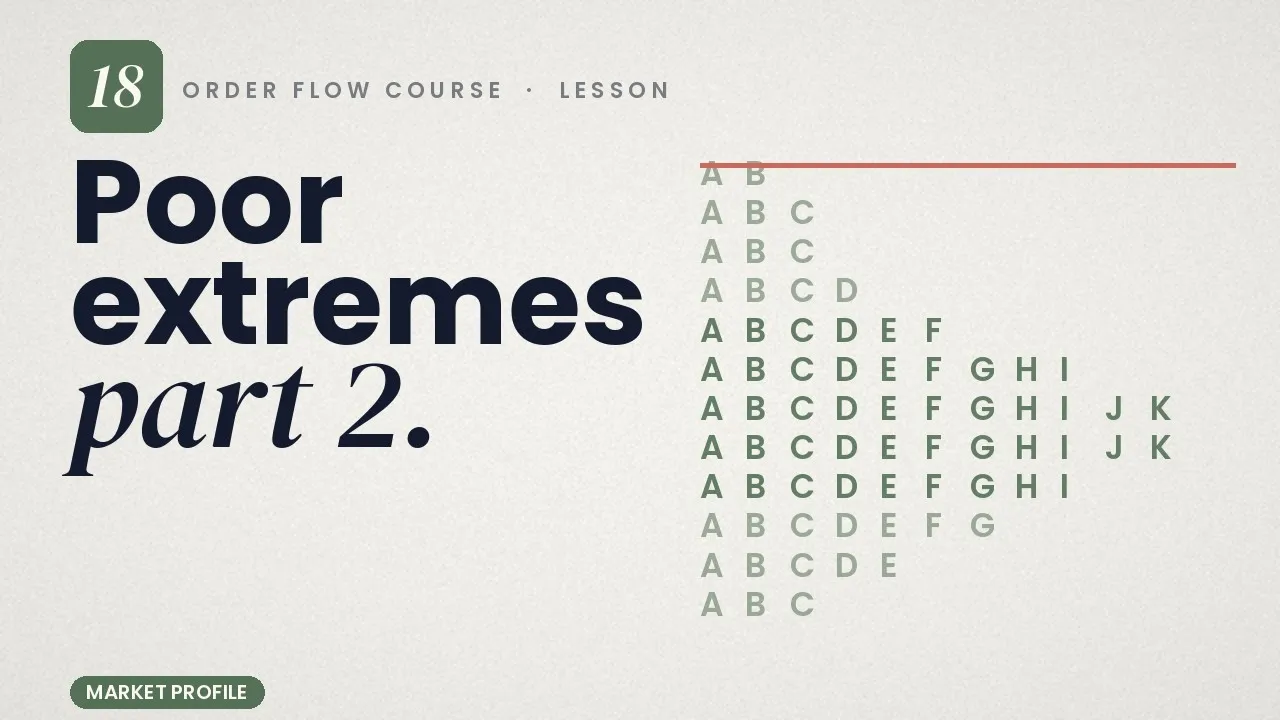
all right so just a little bit more on the idea of poor extremes so poor highs poor lows and as we went over in the last video this is sometimes due to the fact that the market is losing momentum and there is a failed auction or a lack of a complete auction at either the high or the low uh what we have is we have a high that is blunt or a low that is blunt and does not have any kind of sign of a tail or any resemblance of excess so instead of having two
tpos at the low we have something like one or even greater so here's an example of a poor low right here here is an example of a poor high and at this resolution you might not be able to see it as obviously but what we're looking at is just one TPO we do not have a print of two tpos so this can come in many forms it could be like this which is a little bit more subtle than something like this and a little bit less subtle and in between something like this so we have
one TPO two tpos and then three tpos so what this says is that the market and what we think about when we think about auction market theory and tpos and Market profile in general is that when we look for presence of the other time frame participant we look for something like Tails right we look for something like a sign of excess so what we see normally is a single print right we'll move into a location we'll Advance whether we're in a trend upward or downward or making our way for the first time outside of a
range we'll Advance through an area and we'll find that other participant and what it'll lead to is a kickback so we'll have something like a tail at the low or if we scroll back another tail down here or a tail at the high okay so what this says is there was some degree of Kickback by either that other time frame seller or that other time frame buyer and we talk about other time frame what we mean is we're outside of the intraday Traders we're outside of maybe the scalpers and we've found oursel a decent amount
of resistance so as I've said before you know we have many different types of participants in the market not all of them participate in the same Zone as we approach key key contextual levels we start to find more and more of those larger participants so sometimes we'll be referring to that as the other time frame participants so if you're trading a f- minute chart and you're close to a swing within a daily chart you're going to find yourself with other time frame participants as well so what this is said is that price has yet to
find that large buyer or that large seller to move prices back in the opposite direction okay so we still not have we still haven't found anyone to complete the auction so these are actionable in a few different ways right so we obviously need to take these in consideration with the context of the current Trend or the current range sometimes we might have a case of one poor high and you know the example to follow might be a poor low or it might be moving sideways within a range we'll zoom out and we'll just find a
different an example you know we have an example of let's say a poor high up here a poor low down here and you're wondering which one is more likely to be repaired which one is more likely to be filled well if we see that in the example we have let's say a trend moving upward and we're beginning to see rollover okay and we lose momentum but the trend direction is upward and we have let's say a poor high up here and a poor low down here well we might repair the poor low with something like
a stop run okay but ultimately move through the poor High because that was one of the signs that there was a lack of presence in selling at the high of the structure so you could look at poor highs as we said in the previous video as on the profile as an indication that we've been consolidating against a level so when we open up something like a poor High over here that has three prints you'll see what this looks like is that we've spent a good amount of time at this high before okay if we were
to open this entire structure we'd see that over the course of this time we' spent a considerable amount of time hovering at this location so what this does is it gives you a very obvious sign that there's consolidation at a level and again there's no immediate level of Kickback you could see that you know over here we had a poor High over here we had a poor high so again what this is doing is showing you that price has been consolidating at this level and if the general direction and energy of the market has been
up at this point you know we might expect like we said this poor High to be repaired and result in follow through but we might take out this low initially before moving up to run these stops so when you have something like a range forming just in the example of a range forming or a bracketed market if you see that there are poor highs or poor lows what these do represent also are good areas for stop runs so anytime you're moving within a range and price has yet to gain acceptance outside of it if you
see a poor high or a poor low this does represent a prime opportunity for a stop run which if let's say for example we have a trend that has been coming from a major move up but has been consolidating for a long period of time when we talk about where is best to get involved in a consolidation what we mentioned was over the course of the consolidation the best location to get involved are the extremes right the extreme High the value area high the value area low getting involved in the middle is one of the
more liquid areas but you can leave flat-footed unless you have the presence of a large Trend right what we have in this example we talked about this being what was a prevailing trend uh coming from an impulsive move up and now consolidating now the lows and the highs are where we' want to get involved for meanor verion trading but if we have something like poor lows along this structure and we know that it is coming from a greater Trend meaning this is a continuation potentially or a consolidation within a continuation pattern these stops that might
be run or represent areas these poor lows that might represent good areas for a stop run might be an area where you might want to consider placing your entries so one of the popular sayings is you should be placing your entries where other PL where other Traders are placing their stops so this is just one of the ways that we could use something like poor extremes uh and in this case that I've been mentioning that was poor lows but the same concept works with poor highs as well these are areas where the market has not
found any significant pressure from the other side they represent areas where we could potentially clean up and this might come in the form of either stop runs or continuation right and one of the things that'll determine what order we think that that will occur is the context of the current environment right are we coming from being in a range for a really long period of time or do we have a little bit more directional certainty whereas if we zoom out maybe you know maybe the greater prevailing trend has been that we were moving upward in
this case when we zoom out it's actually the case that we've been moving within a trend but what this is is obviously just multiple scenarios that we can sort of paint for you so that you can have the best approach moving forward