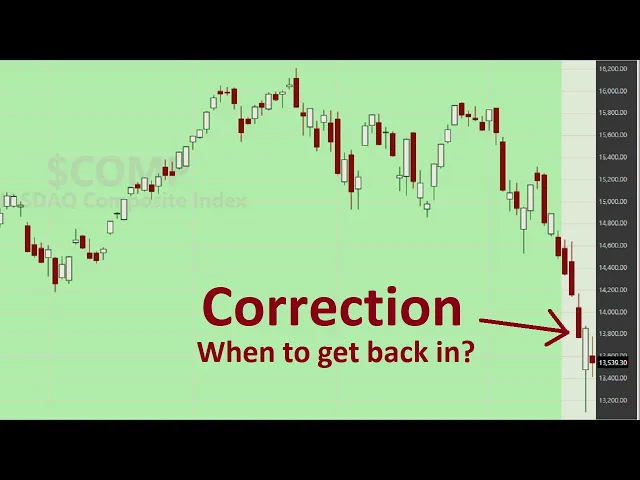
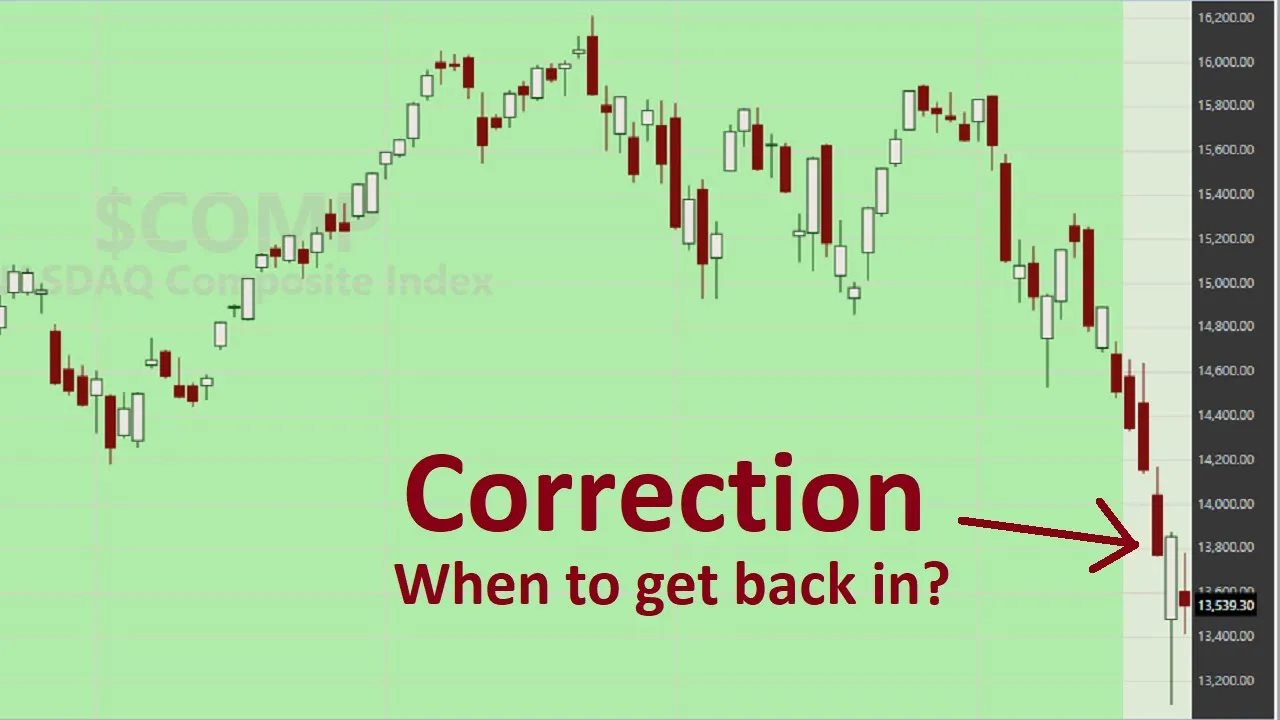
[Music] hey wealth lab 7 users glitch here i'm taking a few minutes out of my trading schedule day trading sqq today to go over some new changes i made to the previous strategy entry that we talked about in the last video where i calculate the market state bull bullish bearish uh bullish correction or bearish correction based on the classical definitions so go check out that video if you need uh some context here but the thing that i added to the strategy and a link to the strategies available in the video description is a table of
average returns after specific periods of time for each of the four market states and once again i'm running this on the nasdaq composite uh the beauty of this approach and the beauty of wealth web in general is you can use it as a tool not only to run trading systems with buy and sell signals but to do market analysis to discover for yourself the numbers of the market don't rely exclusively on what you hear in the media use wealth lab to run these numbers yourself and get the true picture so all of the so here
is our result table for the nasdaq composite on the left here we have the four market states bull bullish correction bear market and bearish correction and on the right there are some columns that represent the average percentage return after one day after one week one month three months six months and one year so a couple of interesting observations if your outlook is short term for example uh weekly monthly maybe you're a swing trader uh it's clearly not advantageous to attempt to do long position swing trading in a bear market with an average monthly return of
only 0.19 compared to the 1.09 of the bull market thought it was interesting though that the average monthly return was still positive it was only in the weekly scale that the average percentage return after one week was negative in a bear market uh after three months the despair the discrepancy is still pretty pronounced uh three month average return in the bull market for the nasa composite was three percent whereas in a bear market it was only one percent uh six months it was even a wider divergence uh 6.2 percent for a bull market and only
2.4 for a bear market i thought it was interesting that in the one year uh average one year return things pretty much coalesced uh into like around the 12 and a half percent range uh whether you are in a bull or a bear market so the experts say not to panic especially if you're a long-term investor so this data seems to kind of hold that theory up a little bit i think the other interesting thing i found about these numbers is look at the bear correction numbers uh the bear correction is when you're in a
bear market but prices have risen 10 percent from the bear market low but still not 20 which would get us into another classical bull market while we're in a bear correction we have actually the best daily weekly uh not quite monthly but the the three month and the six month and the one year average returns are superior to the bear and the bull market itself so and look at the one year average return of being in a bearish correction 18 compared to the 12 and a half of all the other market states so look out
for coming out of a bear market uh when you're in that bearish correction phase at least in the nasdaq composite that looks to be a premium time to jump in and get a jump on the next bull market so here you go a way to run your own numbers in wealth lab 7 do your own market analysis don't rely only on what you hear on cnbc or these other channels the link to the strategy is down here below see you all on the wealth lab forum this market state strategy is going to be incorporated into
a new indicator that will release in build 46 probably tomorrow so we'll have a build 46 update for that and until then see you on the forum