all right folks welcome back this is volume three of the energy trader market maker series in this volume i'll be teaching on market structure key levels and smt all right we're going to assume that when you're doing your qualitative analysis that means we've already gone through all the quantitative we're assuming the market price is up here and your analysis suggests that there is a move likely to ensue that takes us down to a key level low now these key level lows can be weekly lows old highs of entire time frame like four hour daily or
monthly or weekly they could be the top of an old trading range there's multiple ideas that could be used for a key level but what makes it a key level is it's on a monthly weekly daily or four hour less importance and significance place on the four hour predominantly the higher time frame daily weekly and monthly now these levels are important what makes them key is because they're used by large fund traders in their analysis they're not really going into these 15-minute time frames one-hour charts and things like that their analysis is predominantly linked and
founded on the monthly weekly and daily time frames because the volume that they work in and out of the marketplace requires them to be trading on those time frames because they don't have the luxury like you and i to get in and trade on one minute charts five minute chart 15 minute intraday so the idea is we're expecting where the market is now to trade down to this level and then a reaction should ensue now your choice as a trader is if we're here and you think it's going down here to set up a move
to go later higher you can be a trader from this point here down or wait till it gets to this level and then try to trade the bounce i'm gonna leave that to you to decide because a mentor should not try to press everyone into a mode it isn't a one mode fits all it's a approach to understanding how price is delivered and then you as a trader find a strategy or a process that allows you to engage price action without you feeling like you have to meet the same expectations that someone else is doing
so as the market trades down inside this price swing there's multiple opportunities in the form of swing trading short term trading day trading scalping and you can trade on both sides of the marketplace but predominantly the larger position and or more risk can be assumed on the short side whereas going long maybe scalping something like that counter trend to this expectation in the marketplace you'll use a lot less leverage and try to be much more nimble you know what your objectives will be much more smaller than that of if you were trying to trade in
line with this movement here once it trades at this level here you would expect higher prices and you can trade obviously with the majority of your leverage on the long side and any scalping or short-term trades against this idea should be done so with very low leverage and very term price objectives now let this image burn in so that way when we transition to the market maker buy model it's this idea we have in mind here okay market price is here we're expecting a trade down to a key level and then rally up now these
lows can form two different ways you can start by coming down come off that short term low and then make a lower low creating the ultimate low in this price swing here and then price running higher this sets up a ict breaker where we have a low high lower low once it breaks that short term high in the middle if it trades back down into that we could be a buyer somewhere over here to capture another continuation on the upside conversely there is another formation you can see where it trades down it comes off the
low and turns with a higher low and starts to trade higher this one here i like to see this form only if there is a smt divergence that would be in a market that's closely correlated to the one i'm looking at here for the analysis and what do i mean by that well let's assume that this is the euro dollar and i expected your dollar to trade from its market price down to a key low and then trade higher at this low if i see euro making the low and then a higher low at the
same time pound dollar is making a low and then a lower low that's an smt divergence okay smart money technique or smart money total i never really settled on the letter t what it would stand for it was always interchangeably used as smart money technique or smart money tool it's just simply a divergence between closely correlated assets or markets what this indicates is there's a strong disparity between what the algorithm is pricing in for one currency versus another the theory i operate under is all boats rise with the tide and if we're expecting higher prices
in euro it goes without saying that we should reasonably expect pound dollar to rally as well unless there's other factors that are outside the scope of this teaching that would negate that but for the majority of the time in a general rule of thumb all foreign currencies should be rallying together and falling dollar seen with that instance here if we have a low a higher low in euro and cable goes low lower low that's indicating that the algorithm is not wanting to take euro dollar to a lower low like it did with cable or british
pound versus us dollar and that crack in correlation many times signifies a a timing aspect that would be confirmation to expecting this level down here being significant or key that leads to an upward price swing later okay with that idea in mind usually the market will be in some measure of consolidation i like to see some kind of a short-term trading range and it is very subjective this part okay what is a trading range or a consolidation where price is having several candles not two not three not four but it just stays in an area
over a prolonged period of time how much time michael it's all relative to the time frame you're looking at if you're looking at a 15 minute time frame it could be i don't know maybe 10 candles or more and i'm just giving you a rough idea because experience is going to guide you on how many candles really make up a consolidation studying price especially if you're a new student this is going to seem too vague and i had this complaint before when i was teaching on baby pips as soon as i started to introduce an
idea you know right away they expect to have the understanding entirely from one lesson and you have to have something of a comprehensive study approach to what i'm teaching because it's not simple but it is simple once you understand all the moving parts so from a modular standpoint when i say that the market is usually in some kind of a short-term consolidation it could be you know consolidation on one time frame but just simply two or three candles on another time frame that would be higher up so it's all relative to what you're expecting in
terms of the market price if it's on a five-minute chart the consolidation may look a lot longer in terms of duration versus if you look at it from a four-hour chart it's all within one candle and you don't even see a consolidation but for the sake of continuity let's just assume that we understand there's a short-term consolidation here i'll be giving you an example here so that way you're not left with too much vagueness so the market will leave this consolidation and inside this decline we wait for another area of either retracement back to the
original consolidation which it does not have to do okay it does not need to do this this is kind of like what the white golf theory folks will look for there's lots of times where it just doesn't do that and that's why i don't teach why golf that's why what i'm teaching here is not wake off so as the market drops down i allow in my analysis the potential to return back to the original consolidation but if it does i need to see a very sharp rejection there it can't just come back to the original
consolidation low and then hang around for a little while it needs to come back up there and then break i like it even better if it tries to make an attempt to get back to the original consolidation low okay and fail to get there and then breaks hard i really like that because that indicates a very heavy market and it's likely to continue going lower but either or the next short-term consolidation and this doesn't usually last as long as the original consolidation up here so what we're looking as a consolidation a market that breaks lower
that maybe trades up to here and if it does we'll look for a sharp decline if it doesn't and just goes right into another area of consolidation it usually will set up like an optimal trade entry and if you're new to this channel or you're just watching this video for the first time i have a plethora of videos that teaches my optimal trade entry pattern it's very simple little pattern it repeats every single day it repeats on every single time frame you just need to know what you're looking for and why it should be forming
there and this is really the point of this lesson is where in market structure should things occur and how do we interpret it and how we anticipate it so in this area here usually you're going to see an optimal trade entry short it'll be a low retracement back up into a bearish order block and then slams lower or it could be a low short term high and then a higher short term high that runs out short term buy stops then it sells off so either one of those instances will allow for me to take a
trade going short because remember i'm waiting for some level down here i've indicated at the beginning of this discussion that i think it's going to trade down too or i'm watching price and i'm not really engaging price i'm just monitoring it and practicing and reading price and i anticipate some measure of selling in this area or i'm watching price so that way it just keeps me closer to the marketplace and i'm practicing either with a paper trade or a demo trade or i'm illustrating something with my my teachings and lessons i'm just anticipating whether i'm
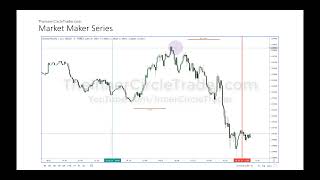
engaging or not another price leg lower and when it comes should it come we're waiting for some kind of expansion lower and sometimes we'll get a secondary level of distribution which will be another either optimal trade entry cell or a short-term high that's ran out with a higher short-term high and then leads to another level of lower prices until we get into that area where we expect that key level to be reached this is where the market goes into smart money reversal okay usually it will form the same way as outlined in the price swing
where it will create a low a lower low and then look for a breaker or it goes low high or low and if it occurs like that again using the inter market relationships i mentioned earlier if it creates a low with a higher low versus one definitive load that takes out a previous short term low in other words the diagram i outlined when it was just that big blue v giving you a rough depiction of a price swing the little animations i put in at the low those are the only two things that can happen
that's it so how they trade and form in price leads to what process you look for next i'm not really interested in a market that will give me a dull flat blunt-ended low i'll avoid that at all costs i'll avoid that because that means i'm gonna have to wait because we could be seeing just another level of distribution that leads to another break lower and then i'll revisit the analysis at a later time but if we see price trade higher we're going to assume that the smart money has accumulated loans in here they are not
pushing price up when they go long by the way we're seeing price trade down to this level and then it kind of like spends a little bit of time down here not a lot and certainly nowhere near the length of time that the original consolidation looks like very short term little consolidation and the algorithm keeps price in that range okay so it's a small little dealing range it works in and then it'll reprice if smart money traders do not buy they miss that move so they'll have to wait for a low-risk buy that usually will
happen over here in the small little consolidation which will form in what in the form of a optimal trade entry by or a low and then a short term lower low that takes out buy stops and then rallies remember when i taught in the previous lesson in this series that usually right before significant price advances higher some little short term lows taken out for stop raids and they assume those positions when the stops are taken their sell stops flood the market with selling so that way counterparties that understand what the algorithm is about to do
with price sending it higher they'll buy those sell stops and they'll be positioned for a rally higher we would expect price to trade higher until we get to another level of accumulation so what we've already seen here is consolidating and accumulation of shorts accumulate more shorts accumulate more shorts in this area you may only get one area of distribution and then it trades down to the smartment reversal where they distribute their shorts down here so they're going to buy to sellers at a low price and everything they assumed over here should be hopefully offloaded here
some of it here and some of it here so their heavy positions are entered here some of it's taken off in profit here some of it's taken off in profit here and here or they'll go short here add more here add more here and dump it all off here so there's two ways for them to engage price and work within this market maker buy model the longs that they assume here they may not get them all on and not to add more here and then add more here because as price is rallying up it's going
to be targeting the original consolidation until it targets the buy stops above this relative equal high or consolidation all those buy stops will be the target of all of this so if you're looking at price and you think that it's going to trade lower to go higher the original consolidation aim there you might have a higher time frame target some somewhere beyond that but initially study all old price data price swings and you'll see this phenomena is occurring and you don't have to have all the complications that are introduced with retail concepts i mean this
might seem too vague and it may seem an over simplistic approach to describing something but i promise you go into charts and study it you'll see this very thing unfolding it happens on all time frames and it happens on buy and sell this is a market maker buy model where they're taking price down not the traders the algorithm all the algorithms are working together it takes price down then allows traders that know what to anticipate to onboard here and then they take it in scalings here and here and finally the last bit of a run
it's in a hurry to get above here and this is a complete market maker buy model this is unique to me this is something that i introduced uh years and years ago and there's been some subtleties you know people adding like off to it trying to make it look like it's white golf it's not like golf it's very specific things and elements that are over here have to agree with over here and vice versa and again that's outside the scope of this teaching but just know that there's logic that is very precise it's extremely precision
oriented but this general idea here will serve you well as a road map for studying price swings now conversely we can look at price doing the opposite where this is a ict market maker sell model we're going to assume that the market price is down here and we think that the price is going to go up to some key high again that could be running out of old high it could be trading to an old high and just falling short of it because we don't think it's going to go higher it could be trading back
into an optimal trade entry so and there's all kinds of things that would be outlining this as a key level but what makes it key again is it's a monthly weekly or daily level and at the lowest four hour but again i'm only throwing the four hour out there as just an extra side note because predominantly the levels are going to be key because they're on this top higher time frame daily weekly and monthly so as the market trades higher and runs into that you could be a participant in buying that up or studying it
as it rallies up into that key level and then the expectation of lower prices if it materializes this whole fractal okay our price swing is what we're trying to strip down to its basic components okay what elements occur inside this entire price range that's what we're highlighting here with the models the high can form obviously with the higher high and then breaking down which sets up a potential bearish ict breaker which would be over here somewhere but the high and then higher high forming this high this is what i like to see i'm more confident
with this pattern but conversely if we're looking at it where we have a high and a failed higher high and then it breaks here this is only significant and a market structure break if we have inter-market relationship confirmation again let's assume for a moment that this is british pound versus us dollar and british pound versus us dollar makes a high and a short term lower high and then breaks down this is ideally a breaking market structure on cable or pound dollar if euro dollar makes a high low higher high and then it breaks down because
that would be a correlated pair smt divergence smart money technique or smart money total because what that is indicating is that cable was underlyingly weak from an algorithmic standpoint it was unable to make a higher high where euro was and i'm speaking hypothetically obviously but that's how i would use this lower high formation so in other words if i think it's likely to form a lower high then my attention will go to a correlated market like again if this is assuming pound dollar i'm going to be really watching euro dollar and i want to see
and if this is occurring here in cable i want to see and almost demand that it's a higher high in euro now if it creates a higher high in cable and it creates a higher high in euro that means we might not be really topping yet and i'll have to wait for more information or a real strong breakdown then i can get back in sync and trade with it later on as you'll see all right again the assumption is we're at a market price down here it could be trading in relatively cool lows or consolidation
and it leaves the consolidation at this point again the same it could come back to the original consolidation high but it doesn't have to we're waiting for it to rally up into another area where it creates an optimal trade entry long or it creates a short-term low and then another short-term low that's lower than it it takes out cell stops and then we anticipate higher prices rallying higher until we get to another level of accumulation so each one of these levels over here is accumulation and another point of advancement on the outside until we get
to our key level where we anticipate smart money reversal okay so smart money reversal occurs with some measure of consolidation not a lot okay but we're we're anticipating expecting the algorithm to kind of like hold up there for a little while what's a little while michael again it's all relative to the time frame you're studying because if this is a five minute chart it's not going to spend 20 candles in a five-minute interval up in this area you know what i'm saying like it's it's going to be very short-lived whereas if we were on a
four-hour chart and we're seeing this pattern and we're looking at a five-minute chart then it's going to probably look like a whole lot of candles so it's all relative to what you're what you're looking at through what time frame and again the way you learn how to do this and get better at reading what i'm suggesting here is you look at old data the back testing and studying of old data every successful trader every single one whether they come through my camp or on their own or wherever else they went through it they're always going
to be better and versed because of their own study the time they spend looking at old data and studying those price swings because those things repeat that element from rallying here up to some key level and then expecting it to trade lower it will have all these elements to it they might look slightly different each time but they generally have the same repeating themes after there's a smart money reversal we expect price to trade and break lower until we get to another level over here where we would see another optimal tread entry cell so it
would be a blow a retracement back in maybe to a bearish order block and then a displacement lower until we get to another level of distribution now in here it could be the optimum transfer cell or it could be a short-term high and a higher short-term high and then break down same thing here it could be an optimal trade entry cell or a little retracement creates a short-term high starts to go lower and runs up one more time takes that out the question you're probably asking is when does it do that when will it do
that in an optimal transit like for instance if you took a trade thinking it's an optimal trade entry cell here or here how do you know that it's not going to be one of those trades where it takes out the short-term high that you went into going short and you get stopped out that's going to happen i can't promise that you're going to you know walk through this marketplace without having those cuts and scratches and bruises you might break a bone or two okay you're going to lose some money but let's assume for a moment
you're taking an optimal treat energy short here this goes for the same thing i just mentioned on the market buy model this is a market maker cell model just reverse everything i'm saying here for for the other one if you take an optimal trade entry cell here and it starts to go down and then runs up and takes you out of the trade then what you can do is put a sell stop below the short-term load that's formed thus far and if the market goes down there it could take you right into the market sure
and if it's going to do what we're expecting here it probably isn't going to do a short-term high a short-term high it's higher then a short-term height is higher that's unlikely can it happen yes so rare it's probably never going to happen but it can so there's no reason for you to fear being knocked out or kicked out of the marketplace and take a loss because if your analysis is correct then you're probably still going to capture some move and overcome that drawdown you've taken here and if you get this other opportunity over here and
you have to stop around here chances are you're probably not going to get a stop run here it'll probably just be the optimum trading entry run right from a bearish order block down and it usually will be aggressive and quick to get down to the low of the original consolidation where cell stops are resting so this is the elements to a market maker cell model and again for someone new for someone that has not been looking at price charts for a long time this is going to look too elementary too simple too big too well
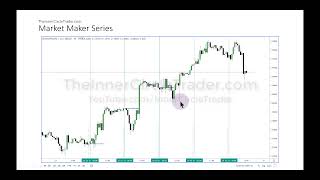
it's not really showing me anything i'm not really grasping it but i promise if you go through your old charts and look at a price swing say on a four-hour chart that does basically something like this and then you study it from a 15 or five minute chart and you'll see this general idea all right so let's go over to the british pound and if you've been following along in recent weeks the discussion on pound dollar i gave you guys in this very series too but let's take it back a little bit let's assume that
we're looking at this level over here it's a daily chart it's a relative equal low so you know what's resting below that cell stops and we're trading right here so we're looking at this high below and we retraced in and we look like we're about to break lower we have relative equal lows in here so saw stops there lots of cell stops there so we would expect to see price trade down there so this is a key level ultimately price does cascade lower all of this here my students and mentorship we knew about this we
outlined this talked about before it happened and the market has now at this point traded cell stops accumulated longs and then we have these relative equal highs okay in the last lesson in this series i talked about how this is the next draw in liquidity and the market trades up into that on thursday of the week of this production and today's friday so the market trades up and we've completed a accumulation of sell stops and a distribution to buy stops smart money buy sell stops and sells to buy stops okay so we can use all
this information here for the weekly range to get to our objective on weekly pip objectives let's assume that's this is that area where we were looking for the buy stops and this is where the old low was on the daily chart where the sell stops were look what we have here the market's consolidating it leaves the consolidation but why does it come back up here it doesn't need to so it's better for it not to do that and we have what we have the level of distribution here because we have what optimal trade entry sells
off another level here optimal trade entry sells off trades below that old relative equal low on the daily chart it's that blue level on the daily chart there's equal lows those sell stops are being absorbed here the algorithm holds price in this little consolidation allowing smart money to accumulate their buying does not send price up it that's not how this works i know you have books and they have authors and teachers and want to be mentors that tell you that the buying sends price up like this it does not how many times have you seen
people saying oh yeah we bought this and i bought i'm long i'm long everybody's long everybody was long in bitcoin before 20 000 back in several years ago and i called the top on that but everybody was buying but this still didn't send price higher it went the other way because these markets are manipulated they're controlled folks i know it doesn't feel good to hear that it doesn't feel warm and fuzzy because it feels like man i really don't have a chance no in fact you really do have a chance if you understand how these
markets are manipulated you follow suit with what the algorithm will do you're not going to always know i don't always know i know a lot i know lots of times when it's going to do specific things and i know when it's not likely to do the things that i would normally expect and i avoid trading but in this instance here the market's consolidating allowing smart money to accumulate longs once it takes off here they can't they can't enter they've already missed that opportunity so they're gonna have to wait for some new level of accumulation we
have a low a high optimal trade entry in here rallies up we have another level here from this low to this low that's optimal trade entry because you have a high low higher low boom rally trades up consolidates rallies again and then drops down takes out that short term low we talked about this in the previous discussion or volume and it accumulates and goes higher the algorithm is driving price up here it's not the buyers okay it's not the buyers the question is this if it was just the buying pressure why didn't it run from
here all up to break out above here because that's what we were aiming for why didn't run from here right above here in one shot why is it doing all this consolidation i mean think about it if the buyers are really controlling price and in retail traders coming behind and they buy it later chasing price why doesn't all that translate into just singular price runs where it just goes in one shot because that's not how the markets look okay it's not how it works folks all of these lows here are critical as we'll talk about
in later discussions that are outside this video but nonetheless we're looking at how price trades down into levels that take out short-term lows short-term loans were taken here in rallies short-term low was here it took it out and then it rallies short-term low here trades down below it and then on fmc fomc right there it wipes it out one more time and then rallies then it takes out this level here which will be critical later in other videos in this series it ultimately takes out all the buy stops above this relative equal high and or
original consolidation so this is a market maker by model this was what i hinged the analysis on in this video series live as we were walking through this week with you and my mentorship students knew about this as well the bias why i was looking for what i was looking for what i was expecting in cable it's based on what i'm showing you here now there's a lot more things than teaching mentorship students that aren't going to be included in this series obviously and you can get upset and be mad or you can say you
know what i appreciate what you're showing me here this is enough you can make lots and lots of money with this okay lots of you don't need a job you can win ftmos and you can do all these funded account contests and get funded using what i'm teaching you on this youtube channel you do not need to buy mentorship i'm not offering seats to it anymore that area is closed down but this is something you can study on your own and go into your charts and see what i'm showing you here repeats over and over
and over again and in 2022 after march because i'm gonna take a month off i'm going to be more active on the youtube channel and i'll be teaching a lot of these types of things real time so that way you'll be able to see over my shoulder what i think is going to happen and i'm going to just use what you've been introduced in this youtube channel and you're going to see how quickly and easily you can hit the ground running and find consistency and i'll be like a little bit of a guide through youtube
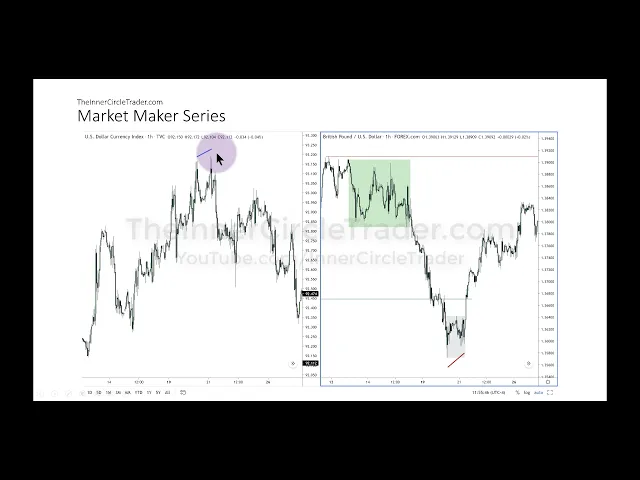
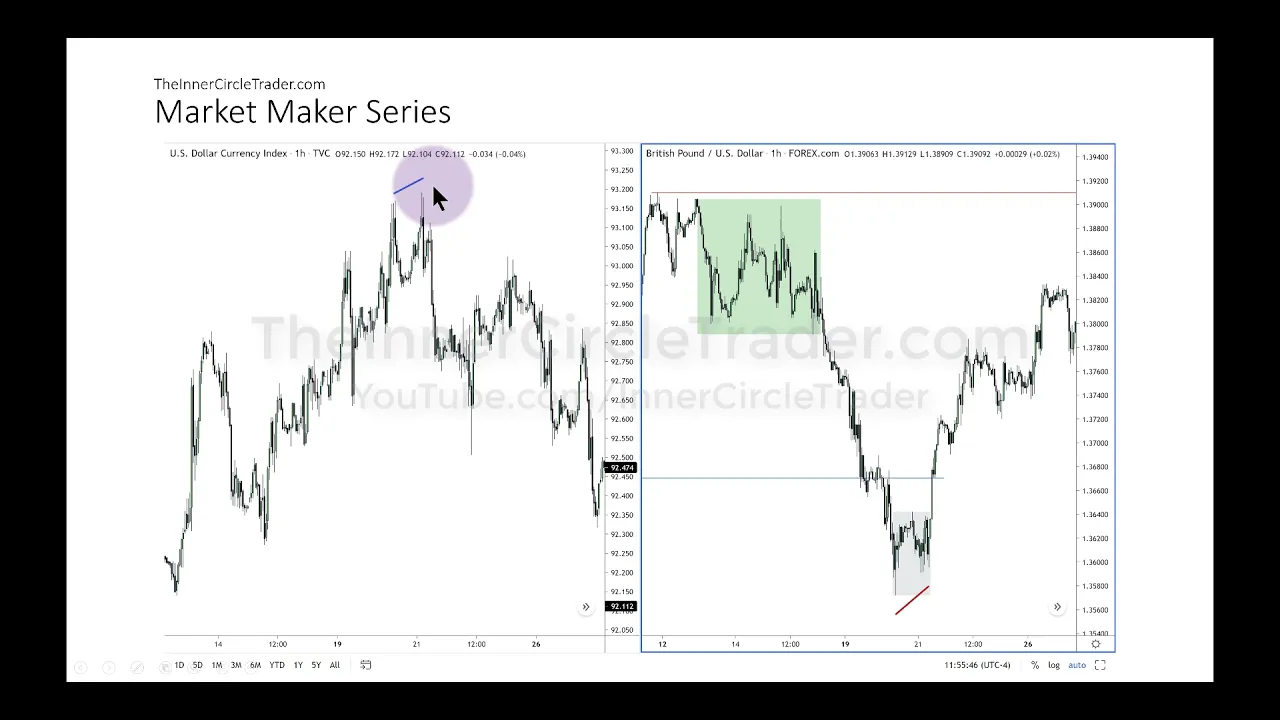
doing that now we're going to talk about smt smart money tool or smart money technique when we're down below these relative eco lows on british pound we're expecting price to accumulate those sale stops but how do we know that that's really going on how can we trust that well bring in the dollar the dixie dxy is being overlaid on the pound dollar chart and on trading view you can see that the dollar index went a little bit higher than this short term high there at the same time pound dollar was unable to go lower than
its previous low now think if the dollar is going higher pounds should be going lower but if pound is going higher dollar should be going lower vice versa but if you look for times when there should be a key level influencing price this is when you go to smt now i taught smt on baby pips like 10 years ago and everybody took that and ran with it and tried to make smt occur on all time frames every time they wanted to get a trade they're looking for it you only consider using smt which is a
divergence between correlated or inversely correlated markets if you're looking at the dollar index against the pound or if you look at the dollar index versus the euro or the dollar index versus the australian okay that's a usdx smt divergence or dollar smt if you're looking at correlated pairs that are like euro and cable or like let's say this way euro dollar comparing its lows to pound dollar that is a correlated pair smt divergence if you see them break their correlation in other words this is a breaking correlation this high with a higher high on dollars
should have been seen with a low and a lower low on cable but notice what's happening this right here is how the algorithm tips off the traders that are in the know we already know going below those wealth of equal lows that their cell stops down and it's probably going to go down there accumulate and go higher that's likely but how do we really know and trust that's going to happen the dollar index gives us the insight the x-ray view if you will where it went high higher high low failed lower low so it's telling
the traders without really broadcasting it that okay cable's gonna start going higher because it failed to make that lower low where the dollar made the higher high so this is smt divergence higher high higher low this is occurring at the same time we're below those daily equal lows and we're expecting price to go higher anyway and all this does is confirm smt is not a timing tool it's a confirmation tool okay it confirms something that you were already expecting anyway and this is why a lot of folks that learned from me on baby pips thought
that oh smt doesn't work it doesn't work because i tried to look for here and there and it failed here it failed there you don't go into your charts looking for divergence between highs and lows that's not what you're doing you have to have logic and some measure of a narrative behind what it is you're looking for otherwise the divergence could be there momentarily and then completely evaporate and then what you trade on you trade it on the basis of like an indicator and this is not an indicator when it's done correctly because i'm comparing
the price of one benchmark currency the dollar versus another currency pair and they should be mirroring one another okay so if this is high or high this should be low or low if it doesn't do that that to me indicates as a cracking correlation therefore it's tipping off algorithmically this is the signal it sends it's not oh it went down and there was not enough sellers to send it lower that's not what that is it also isn't a low and there's too many buyers to let it go down it's not that either i'm telling you
what it is i'm telling you exactly what it is and majority of you aren't going to agree with it because you know you probably read 14 books okay or watched a couple videos on somebody else's youtube channel and they swear up and down that it's this and it's that and they maybe have exotic cars that they're leasing and they're trying to convince you with stacks of money they're carrying around with them all the time going on trips go into a chart okay and use these things i'm teaching you okay and study like that and you'll
learn far more than any book out there is going to give you because most of the books that's being written now are just bleeding information from what i'm giving you here on this youtube channel or for my mentorship and that's the truth and if it sounds arrogant i'm sorry if it sounds arrogant i'm not trying to be arrogant i'm just telling you if you're going to learn how to do this you need to learn it from the source and that's me i'm going to show you how to use this stuff and make money with it
real money not demo dollars that i teach through for compliance reasons because i'm not licensed to give you trade advice but i promise you this if you learn this stuff and you get good with a demo account what separates the ability for you to do the same thing in a demo account in a live account fear and greed and i have modules in this youtube channel to help you conquer that also so there's no reason for you not to be making money there's no reason for you not to be passing a funded account challenge so
that way you can get out here and start making money because times are going to start to get real tough soon folks real tough and if you're relying on your job i'm telling you you are setting yourself up for failure i could be your best friend and all you got to do is a pad and pen sit down take notes and study and experience will guide you i'm going to put you in the right place in studying but all that work is on you you have to do all this stuff you have to study it
and go through example after example of hindsight data and then you train yourself to see these things you don't go in looking for divergence because that's the same thing as a student that trades with retail logic will look at an rsi and say okay it's going higher and higher but look at this rsi it's diverging variously and they try to go short and they get their clock cleaned and just keeps on going higher it doesn't make a difference what indicator you slap on that chart they're all going to flash bare signals okay because it's measuring
mathematically a number of bars in the past and by default it's going to be going lower and people don't understand that because they're not they're not versed in basic math okay there's simple things that you're being tricked by but because they show example after example that doing this or that in the past then you go into thinking okay well i believe that this is going to happen because i've seen it in the book four or five times never seen the author trading with it never seen the author doing it with a live account never seeing
them show you in live market conditions you don't see those things but they have cherry picked hindsight examples where they're talking about the left side of the chart all the time i did this series i did this series again for youtube but i used real market action real analysis to deliver it how better can you expect from a mentor to be able to do it outline it i signed my name on it where i thought cable was going to go and here it is i did it on a week during fomc and i even traded
fomc i put the trade on my telegram it's there you can see it and it went up and traded and i did a one shot one kill set up with that all of that with this logic here better view of what i'm referring to here is smt divergence on the right hand side it's the chart of the pound dollar and the left-hand side it's the dollar index here's that higher high in its own chart and then here's that higher low on its independent chart on cable so these two price points are correlated to these two
price points this should have went to a lower low than this one it didn't but because it didn't do that and were below those relatively cool lows on the daily chart on cable this was accumulation of longs the algorithm is signaling to interbank traders this is going to go higher not because of buying and selling pressure deficiencies but because it's being controlled and manipulated don't take my word for it i don't want you to believe me i don't want you to believe me at all about what i'm showing here i want you to go into
the charts and study it with this premise in mind go into it looking to disprove what i'm saying and you're going to shock yourself because it's there it's been there all this time and until i started talking about it no one paid any attention to it so until we talk next time be safe