Drw down is one of the most important but also most misunderstood metrics in trading. Most traders don't understand how it's calculated, how it affects their strategies, how their stop-loss levels feed into it, and most importantly, eight out of 10 traders have no idea that not all draw downs are the same. So, in this video, we're breaking down the different types of draw downs you absolutely need to understand, how each one impacts your strategy, and how to use that knowledge to fix what's broken without throwing away a perfectly good trading plan.
Let's dive in. First things first, let's pin down exactly what we mean by draw down. In trading, as you open and close positions, the value of your account will increase or decrease.
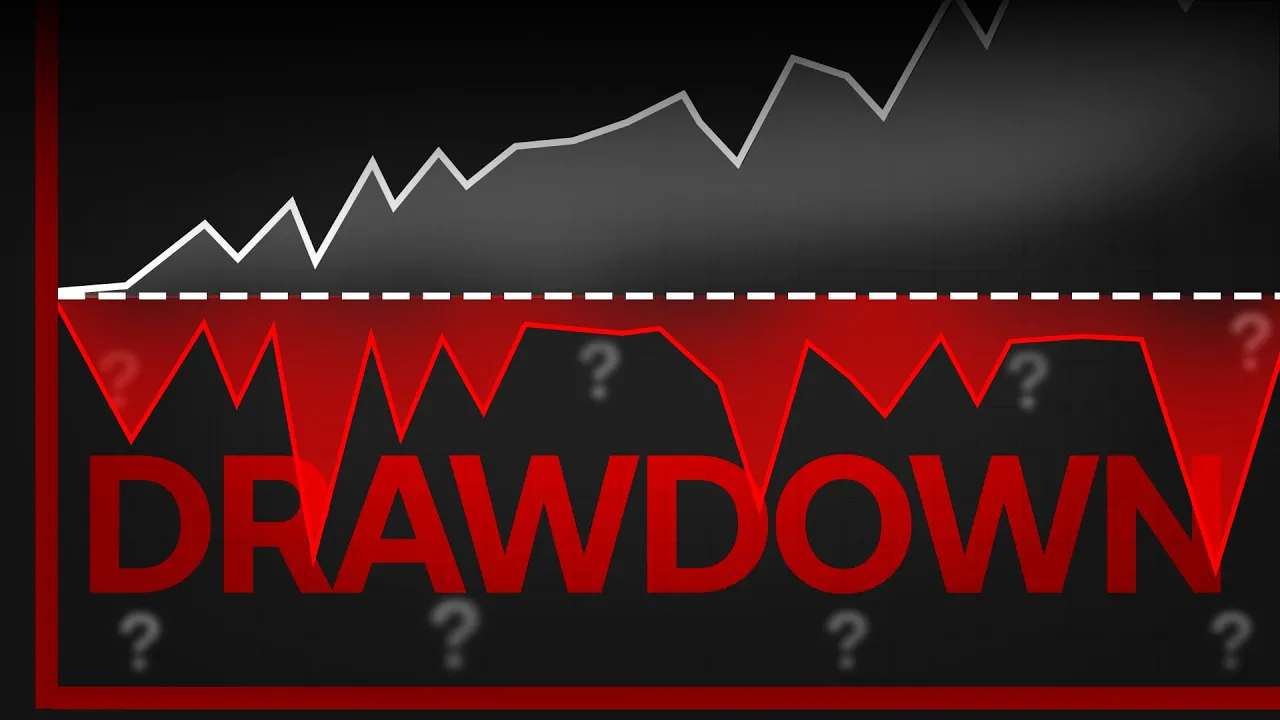
A draw down is simply the decrease from the highest point of your account balance or equity to a lower point that follows. To better visualize this, picture a roller coaster. As it climbs higher, each dip afterward counts as a draw down.
Some dips are more significant than others. And we usually express this measurement as a percentage. That percentage is your reality check.
It tells you how much your account shrank during a losing streak and it gives you a clear sense of the risk and volatility your strategy carries. But here's the thing. Not all those draw downs are calculated the same.
So let's break it down. Forget what you've heard. At this stage, there are really only two types of draw downs you need to understand.
Absolute draw down and relative draw down. Let's start with an absolute draw down. This measures how far your account balance drops below your original starting balance.
Here's a scenario. You start with $10,000 and you make a 50% gain. So, now you're sitting at $15,000, feeling unstoppable.
But you follow your favorite get-rich guru and go allin with your profits and surprise, the market humbles you and your account drops to $10,000. You've lost $5,000 in profit, so your draw down is 5%. Right?
Wrong. Your absolute draw down is zero. This is because you never went below your original starting balance.
Going back to our roller coaster example, absolute draw down doesn't care about how high you went on the ride. It only cares about the distance between the trough and where you started. As you can imagine, this type of draw down has its pitfalls since it only measures losses below your original deposit.
That means it can make a trading strategy's performance look safer than it really is. Relative draw down, on the other hand, is an industry favorite for evaluating strategies. It measures the percentage drop from your highest equity peak to the lowest point that follows.
The key is that it's dynamic. As your gains grow, so does the scale it measures from, keeping risk proportional to your account's growth. For example, if your account grows from $10,000 to $15,000, but then for some reason drops to $13,000, your relative draw down is based on the $15,000 peak, not your starting balance, making the draw down 13%.
This makes it a true reflection of how much of your recent gains you've given back to the market. So, why is that important? Imagine you're looking at a strategy's equity curve.
You could choose to invest in that strategy at any point along that curve, and you want to know the relative draw down risk you might face from your point of entry. Absolute drawdown won't tell you that and offers no insight into potential losses from a current or recent peak. Now that we understand these two types of draw downs, when should you use each one?
Relative draw down is best when you want to know the realistic ongoing measure of risk. It's especially useful for investors who evaluate strategies over time by showing potential losses from the most recent gains. It's a powerful tool for strategy comparison and performance tracking.
Absolute drawdown, on the other hand, is better for assessing the maximum risk taken relative to your original capital. Long-term investors or funds focused on capital preservation often pay close attention to this metric to ensure the initial principle was never at serious risk. It's most useful for evaluating the starting phase of a strategy without factoring in what happens to profits afterward.
Now, while these are the two main types of draw downs, you might find variations of them in the trading space. For example, you'll come across what's called trailing draw down. Trailing draw down works like a live moving version of relative draw down.
As your account equity increases, the trailing draw down threshold rises with it, maintaining a strict buffer below the highest point. Unlike relative draw down, which is more of a retrospective measurement, trailing draw down enforces limits in real time by always anchoring to the highest peak of equity. Many retail prop firms love this mechanism because it tightly manages risk and prevents traders from giving back too much of their hard-earned gains.
So now that we understand how each drawdown works and why a trader or investor might use them, the question is how can you as a trader apply this knowledge to improve your own performance? By understanding draw down, you can identify what aspects of your strategy need adjustment. For example, if your absolute draw down is high, it could mean the strategy is fundamentally flawed.
You're losing a significant portion of your initial capital. However, that alone doesn't tell the whole story. A strategy could recover from an early slump and trend higher beyond your starting balance.
So that is why the relative draw down becomes valuable. If your swings between gains and losses are too large, a high relative draw down may reveal that your stop-loss settings are either too wide, letting losses run too far or too tight, triggering stops too often. You can then optimize your exits, reducing your relative draw down, turning a choppy, unattractive equity curve into a much smoother, more stable one.
Drw down analysis also feeds into other important performance metrics. One of the most useful being maximum adverse excursion or MAE. M AE measures how far on average a trade moved against you before it was closed.
It's typically compared to the trade's final outcome and plotted on a grid. This grid maps all trades from your strategy, showing each trade's maximum draw down versus its closing result. If you notice a cluster of trades with large draw downs but small profits, that's a red flag.
It suggests you're holding on to losing positions for too long. The goal is to shift your trades toward the top right of the grid where draw downs are smaller and profits are larger. There's also maximum favorable excursion or MF, which measures how far a trade moved in your favor before closing.
MF can highlight whether your take-profit levels need optimization. For example, if trades often move far in your favor, but you hold for too long, and you give back some of your profits before you close, there's a strong chance you need to time exits better. We can also calculate recovery factor and much more.
Recognizing how critical these calculations are for traders aiming to build a real edge in the markets, we've added a powerful metric to our signals and overlays back tester potential ratio displayed right on the dashboard alongside other key stats. This metric measures the relationship between your trades total maximum potential profits and total maximum potential losses. The key word is potential.
A higher potential ratio means your entries consistently offer stronger upside relative to the risk taken, signaling that your strategy has the capacity to deliver more gains than losses. Conversely, a low ratio can expose aggressive risk-taking where entries are more likely to lead to significant draw downs. Paired with our AI back testing assistant, which can explore and test strategies from a pool of over 6 million individual strategies, this metric becomes a precision tool for fine-tuning your approach and aligning it with your unique trading objectives.
You can try the back testers, an AI back testing assistant at luxalgo. com with a 30-day risk-free trial. We hope this video has given you a clear understanding of the different types of drawdown, why they matter, and how to use them to sharpen your trading edge.
Don't forget to follow us on X where we share daily market updates and trading insights.