with this video we are starting a data analysis project on generating sales insight now this project is perfect for anyone who wants to pursue their career as a data analyst or a data scientist my whole intention of doing this project is to give you an experience of how data analysis projects are executed in big forms so this is not just a simple like power bi tutorial where they teach you how to do XYZ thing because those things are just the instruments but there is an end goal and there is an approach to achieve that end
goal and I'll be focusing more on those aspects so that do you get a real experience of you know how these projects get executed in a corporate environment and this kind of having experience with this kind of projects will look pretty good on your resume as well as it will give you a very good exposure as well now I want to thank you my friend Hemanand who is a senior data analyst he is working for a company in a Germany he's recently promoted as a data analyst manager in the UK so he has put a
lot of afford I also have more than 10 years of experience in the field of data science so we both have put a lot of hard work and all the experience we have gained through years we have tried to convey a share that experience or via this project now in terms of the project breakdown it will be maybe six seven part of tutorial series and what we'll do is we'll start with the problem statement where we'll discuss how a computer hardware manufacturer is facing issues in terms of their sales and then how they hire a
team of data analysts and how data analysts will first use the Ames grid to define a problem and define strategy to tackle that problem and then how the work on data discovery the next step would be data cleaning and data merging and the next step will be generating those dashboards in in power bi now you can do the same thing in tableau as well doesn't matter I'm just going to use power bi for this project so once this project is done and once we have built this a power bi dashboard what you will get as
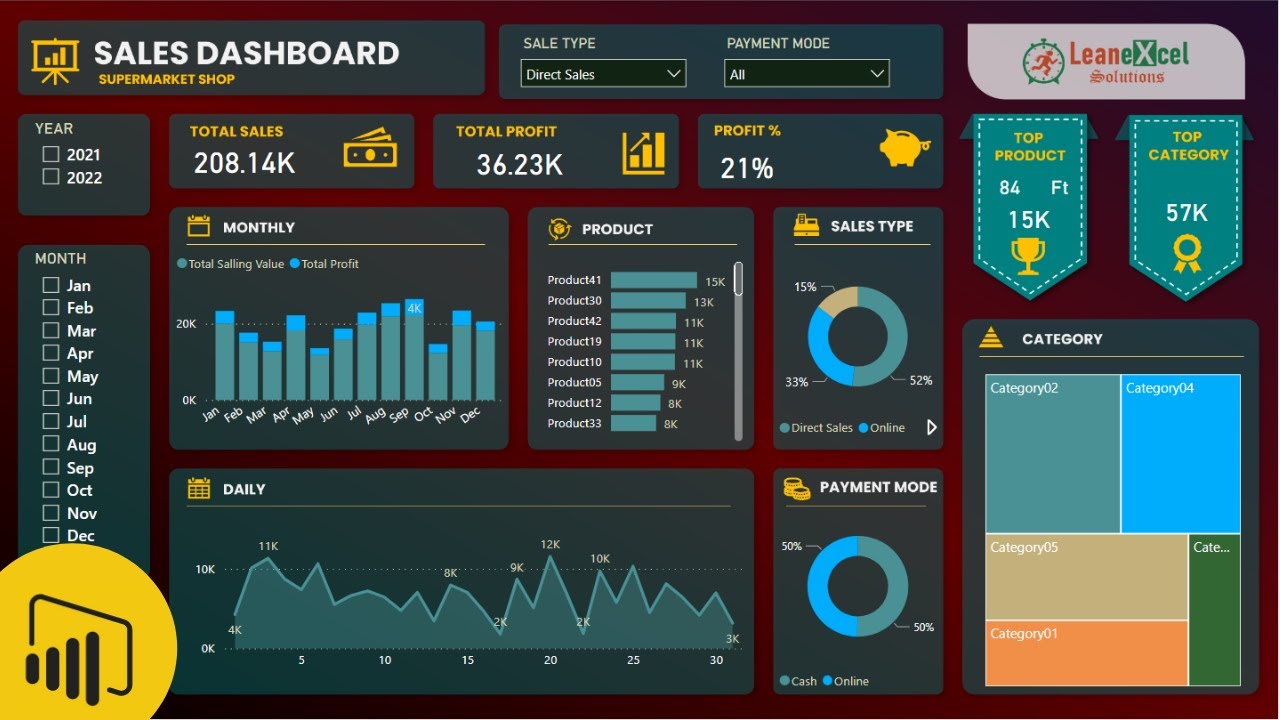
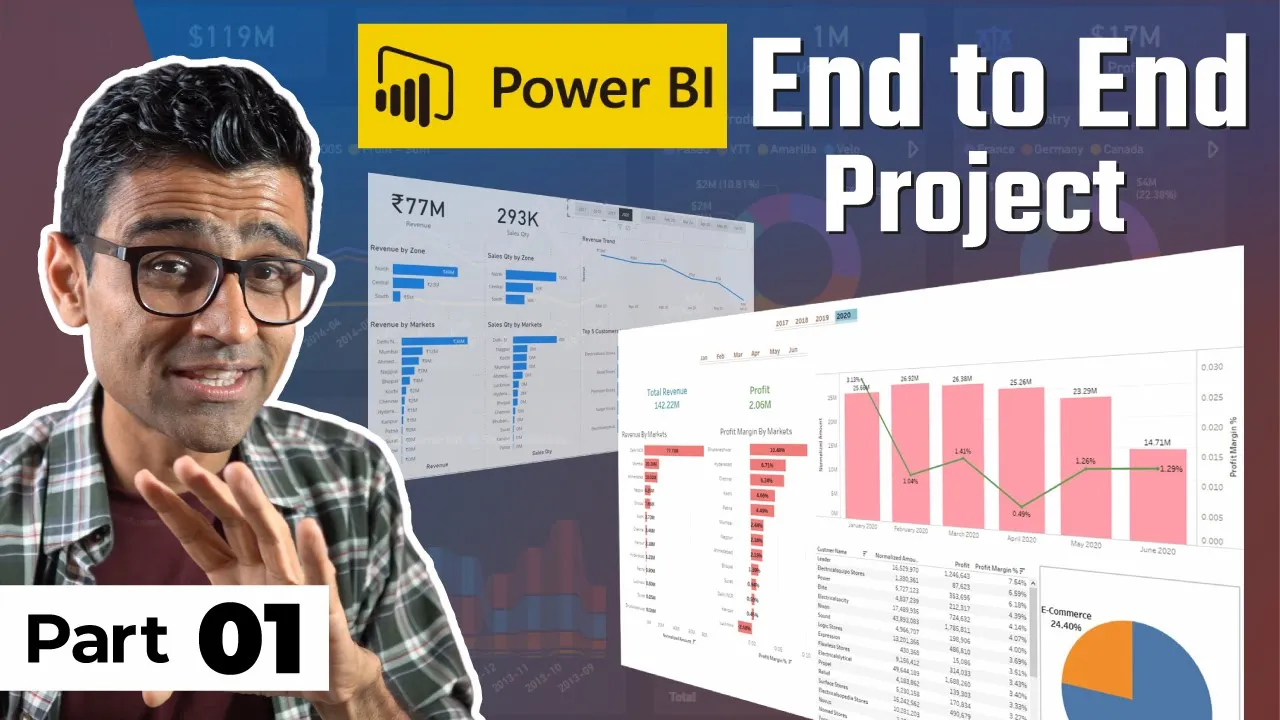
an end product is this powerful dashboard where you can track revenue numbers and sales quantity numbers year over year you can also track the revenue breakdown by regions by different products and so on and you can also track the revenue trends and one very interesting thing we are going to do is I will hand over this dashboard to you so at the end of this these videos you will get this power bi dashboard but then I will ask you to act as a stakeholder and give us me and Haman on the feedback on that dashboard
so because what happens in real life is a data analyst will build a dashboard they will give it to stakeholders who could be sales director or marketing head and after that those people start consuming the dashboard they give the feedback and based on the feedback these dashboards evolved so for us you all will be acting as that stakeholder and then you give us a feedback and then we will make improvements into it at some point I will also invite Hammond for a conversation on this project it will be one of the videos where we will
discuss you know as if we are working in a company and we both are data analysts so we will discuss what are the next steps and you know how we can evolve this project further with that let's discuss the problem statement first AtliQ Hardware is a company which supplies computer hardware and peripherals to many of the clients they have this client called Excel stores normal stores across India and they supply all these equipments to them now ethnic Hardware has a head office in Delhi and Delhi India and then they have a lot of regional offices
throughout the india now bhavan patel is a sales director for this company and he's facing a lot of challenges so the challenge is this the market is growing dynamically and then he's facing issues in terms of tracking the sales in this dynamically growing market and he's having issues with the insights of his business so he has this Regional Managers for North India South India and Central India whenever he wants to get insights in these three regions he would call these people and on the phone this local regional manager will give him some insights that okay
this was the sales last quarter and we are going to grow by this much in the next quarter the problem is the conversation which are happening they're all verbal and you know there is this habit that all the managers have which is they try to paint a rosy picture you know they don't want to look bad so sometimes they will lie or even if they are not lying they will try to sugarcoat the facts so bhavan patel who is a sales director is extremely frustrated with this because he sees that overall the sales are declining
but when he is talking with his regional managers he's not getting a complete picture when he asked for our numbers what these people will do is they will give him a lot of Excel files okay and this AtliQ hardware is a pretty big business and they have so many clients so that these Excel files that you get there are so many Excel files with so many rows in it okay and behind put it is very frustrated he's like why are giving me the 69 Excel files just tell me in simplistic terms how our business is
doing what are the biggest areas where we need to focus you know so if there is a region where the sales numbers are declining maybe we can start some promotion offer or maybe we can engage with customers in a more better way so that we can increase of ourselves so he is interested in getting a simple understandable digestible insights but what these guys are giving is so many suffice and you know we as humans cannot consume so much numbers actually so there is a saying which says a picture is worth a thousand words so he's
more interested in a dashboard which he can go and he can look at the real data because data will speak the truth okay so if the data is coming from a correct source and if you build a visualization such as shown in this image for buying Patel it becomes very easy now he can lately he can come to office and he can open this chart you know and he can see what how the numbers are trending he can also set monthly email reminders where you know at the end of the month power bi will send
him an email saying that this is how the business looks basically in terms of revenues customers and so on so that way now bhavin doesn't have to call these managers and whatever information he's getting from power bi will be the actual information it will be telling him the truth and then as a sales director he can make data-driven decisions and this data-driven decisions will help him increase the sales for his company so that's all I have for this introduction video in the next video we'll be talking about ins grid and data discovery


![Hands-On Power BI Tutorial 📊 Beginner to Pro [Full Course] 2023 Edition⚡](https://img.youtube.com/vi/77jIzgvCIYY/maxresdefault.jpg)

![Model Driven Power Apps FULL COURSE for Beginners [UPDATED 2024 Edition]](https://img.youtube.com/vi/HrILchHvMUA/maxresdefault.jpg)