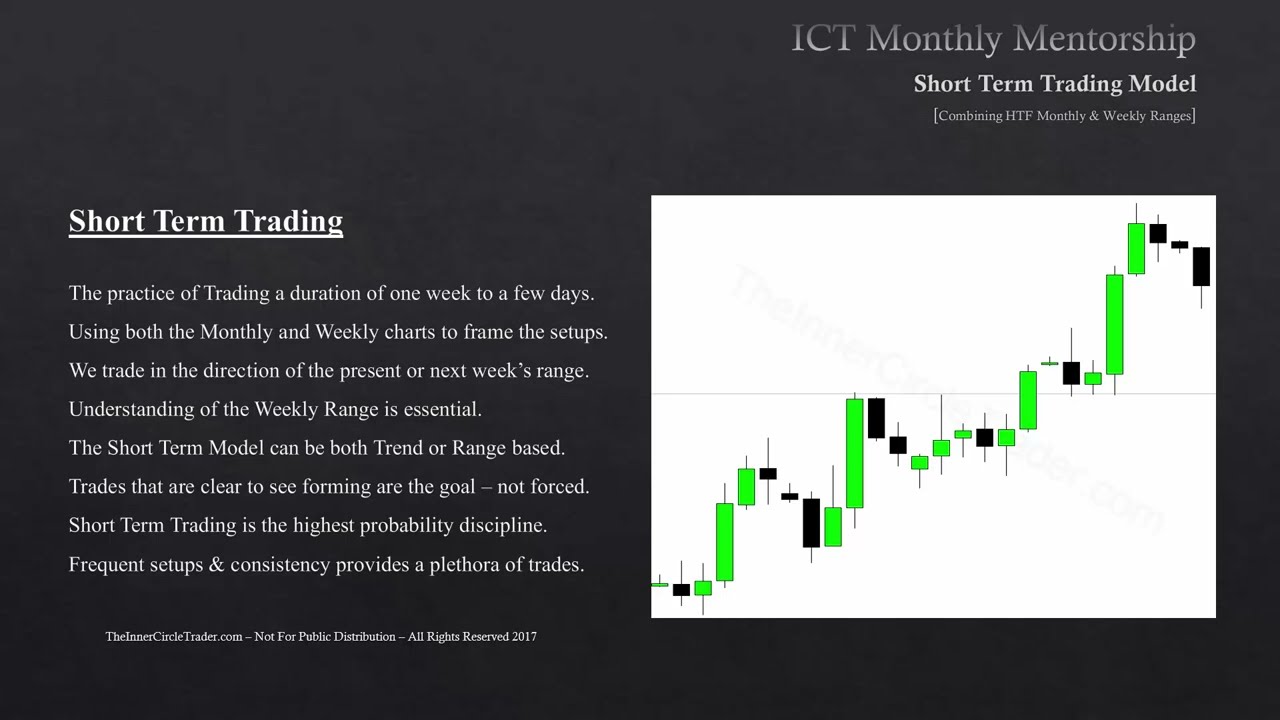
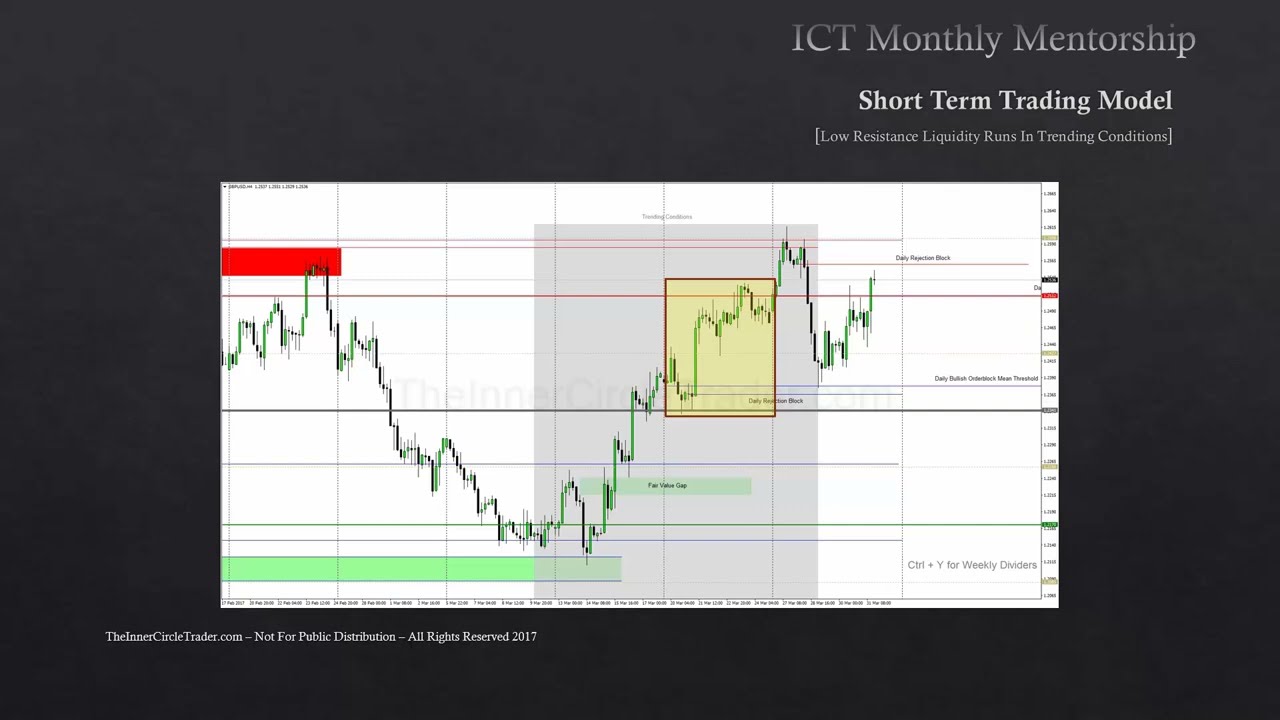
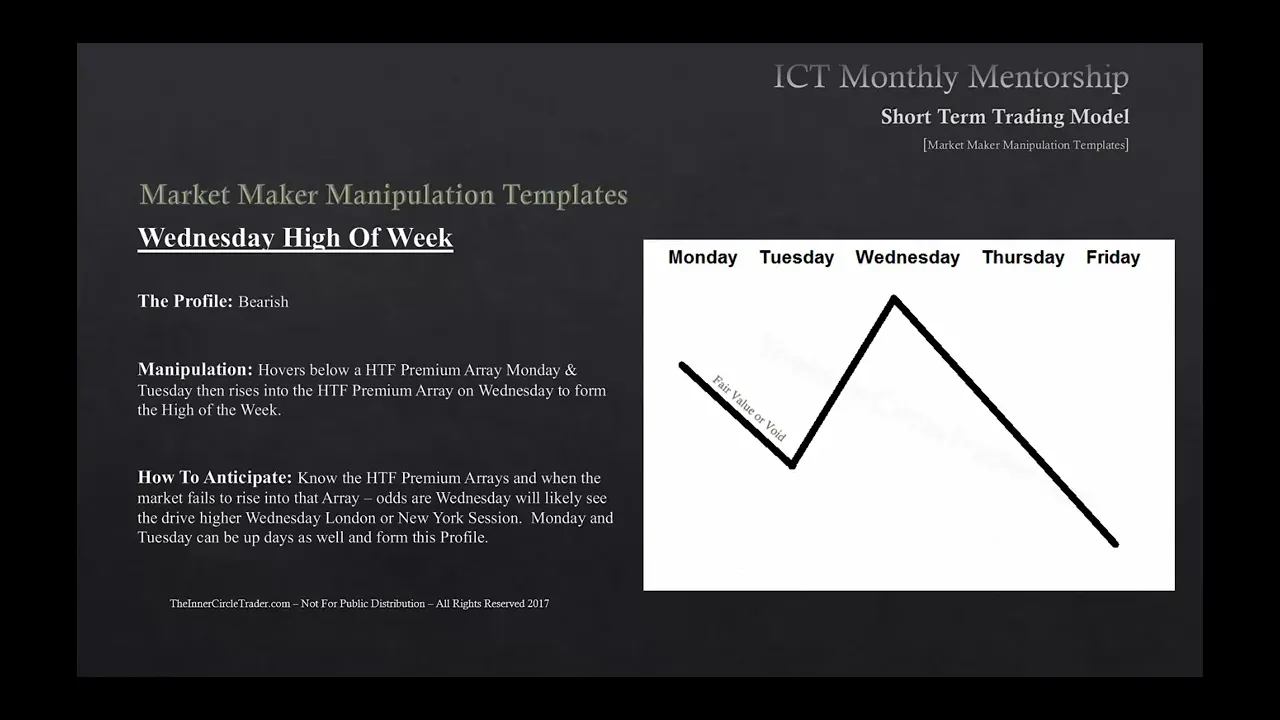
welcome back folks this is lesson three short-term Trading just lessons going to be teaching Market maker manipulation templates okay in lesson two we went over the weekly profiles how the market generally unfolds not every single subtle Nuance of price action is covered obviously but the majority of the time you're going to find that one of these market profiles will basically classify the price action you've seen it'll classically Define the weekly profile if you go through each one of these templates it'll give you basically the idea of how the market manipulation has taken place along with the market profile for that week so we're going to be blending the two ideas on why the market does what it does in these individual weekly profiles and applying it to a template idea so you can almost forecast what the market makers are going to be doing in advance based on the conditions currently in the market that you're Trading before we get in to the details of it all every example here much like in lesson two all of the charts or diagrams are represented in and depicted as a 60 Minute chart so the perspective I'm trying to show you is if you were to go through your charts and open them up in a 60 Minute or one hour chart basis Monday through Friday this is generally the theme of which you see the market trade in okay the first one we're going to cover is classic Tuesday low of the week now there's going to be a few instances where we go through a few scenarios each template and there's a few that only have one or two ideas around it but for the classic Tuesday low of the week what you've been looking for is a market that is primarily bullish and the market trades down on Tuesday into a discount now this is going to be in the form of either old monthly weekly or daily low to run a liquidity pool in other words it's running out cell stops Thursday end or going into Friday but generally you want to look for the high the form for the week by Thursday's New York session I can carry over into Friday a little bit but in the general rule of thumb just look for Thursday as the lines portion of the weekly range and you're looking for it to trade up into a premium Market PD array now the key is you're looking for a time frame lesser than the discount liquidity pool that you used to buy off of for an example if you bought a monthly liquidity pool you're gonna be looking for a weekly or daily premium PD array to trade up into another scenario for the market maker template for a classic Tuesday low of the week again the market condition is you're bullish the discount Market you see the market trade down to an old monthly weekly or daily high that means the market has already broken out above a historical high or an old high and the market has now come back and retested that area as support you'll be looking for this Market to trade up into a premium PD array and or a fib extension combination of 127 or 168 extensions for or a 100 percent symmetrical price link or what I classify as a perfect Market structure swing you're gonna be looking for it to trade up to this premium Market PD array and overlapping FIB in a time frame lesser than the discount old High so in other words if you're treating at a weekly high as support in the form of a discount Market you're buying down there as a support idea if it's the weekly high that you bought you're going to be looking for a daily or four hour PD array and an extension of either 127 or 168. or preferably a perfect symmetrical price swing of 100 percent another scenario for the classic Tuesday low of the week we'd be looking for the market to trade down into a discount Market and trading into a bullish order block this could be either a monthly a weekly and or daily or any combination of an overlap of those three time frames it can also be a four hour just for the sake of space I didn't have that in here but you could be trading that to a four hour bullish order block and or this can occur as a market has already been trading higher and you've determined the overall price move may be much significantly and higher than what you see graphically depicted here in this diagram in other words it could be a multi-week scenario where the market could trade higher for more than one week so if that's the case you could be seeing the trade trade down into support or below shoulder block on Tuesday where you'll see the first swing grade or it could be happening in at the equilibrium price point where price could be expanding up and seeing equal measured move higher or it could be a third swing grade now generally third swing grades are the halfway point between the equilibrium and the ultimate objective in your price objective or the for the trade generally you don't see a stop run in the third swing grade right before the determinants of the price move you're looking to trade entirely as a profit go back to the lessons where we talked about grading the swings and you'll see what I'm referring to that third area or midpoint between equilibrium and your target generally you don't see a stop run there but you do get a little shorter box sometimes that you can trade off of them this is that type of scenario we can use this template regardless of what time frame you use you'll be looking for it to trade up into your premium Market PD array and or if extension overlapping of 127 or 168 or a perfect symmetrical price swing or basically a 100 duplication or measured move of the price swing and traded down into the Tuesday low and you'll be looking forward to trade up into a time frame lesser than that of what you use for the bullish order block so again if we used a weekly quarter block we're gonna be looking for a daily or four hour premium PD array to take our profits at something lining up with price above us in the premium Market but in a time frame lesser than that which we traded our entry on fair value or a liquidity void also could be an instance where this trade could materialize okay the classic Tuesday high of the week okay the first scenario you're going to look at is a market trading up into a premium Market could be trading up to an old monthly weekly or daily high in the form of running a liquidity pool in other words buy stops above and on high and we'll be looking to frame the trade with a time frame lesser than that which we used for the premium liquidity pool and we're gonna be trading down into a discount Market PD array what you'll be framing is for instance an example would be if you sold short at a daily High being ran out for a liquidity run on buy stops you could see a four hour discount PD array to trade down into as your objective so that would be your weekly range Being Framed another example would be if you're looking for a weekly High to run out buy stops you'd be looking for a daily or four hour discount Market PD array again you're looking for a time frame lesser than that which you use to trade with since we're using monthly weekly and daily as a framework it gives us a great deal of probability that the moves are going to take place secondly we're using a lesser time frame to take our targets because if we don't want to hold for what would many times take greater than a week to unfold for a move moving off of a monthly or weekly level okay our second scenario for the classic Tuesday high of the week would be the market trading up into a premium market and trading up to an old monthly weekly or daily low that means the Market's already broken down out of a measure of Market structure or maybe took an old low now it's retesting that as support broken down resistance and we'd be looking for a discount Market PD array and or FIB extension of 127 and 168. and or a perfect symmetrical price swing and a time frame lesser than that which we used for the premium old low so they'll write it for an example we would be looking for the market in a bearish context we're looking for lower prices overall The Market opens on Monday trades up into Tuesday creating the high of the week but it's retesting a old monthly weekly or daily low to that daily low whatever it is we're going to be using that as our means of framing our entry with the expectation that we're going to be selling short looking for a discount Market PD array any time frame lesser than that which we used to get short off of so if we're trading a weekly low as resistance we could also employ a lower time frame bearish order block or something that effect to get in sync with it but for instance if we're using the weekly low we would be looking to trade down to a discount daily or discount four hour Market PD array and an overlapping FIB extension converging at the 127 or 168 or a perfect symmetrical price swing now I'm going to show you examples of what I mean how you anchor the FIB in here in several examples but just remember the move up initially in the beginning of the week that's your price Suite is going to be using your fibon you're going to run your projections off of that and I'll show you what the fulcrum points are for each one of these foreign value or void that fills in is all that's necessary before the Tuesday highs form back up to that old monthly weekly or daily low okay our next scenario would be again a fair value or liquidity void and the market moving up into a premium bearish order block either a monthly weekly or daily and or it could be a first swing grade or at equilibrium or it could be a third swing grade entry in other words if we're seeing a larger longer term price move going lower if we graded our swings we could be looking for this scenario to take place at the first grade swing equilibrium or the third swing grade discount Market PD array or FIB extension 127 168 or perfect symmetrical price swing measured move in a time frame lesser than the bearish order block we use to trade off of now I'll give you an example on this one the market makers will see the for instance we could Gap open lower on Sunday and then all through Monday we could trade up through higher and then up into Tuesday London open arm New York open we could create the high of the week we would be in a premium Market relative to the weekly range that's just started we would potentially fill in a fair value Gap or a liquidity void trading back up to for instance a daily bear shoulder block so if it gets to a daily bearish order block we could be using a four hour discount Market PD array that overlaps with a 127 or 168 or perfect symmetrical price swing in our fib we're using a time frame lesser than our bearish order block entry in other words it was a daily in this example I gave you we'd be looking for a four hour discount PD rating to take our profits but it has to overlap with a projection on that fair value or liquidity void swing that's going up into Tuesday that's your swing so you would measure your Fib from that low up to the high that's one on Tuesday and your projections down in the form of 127 or 168.
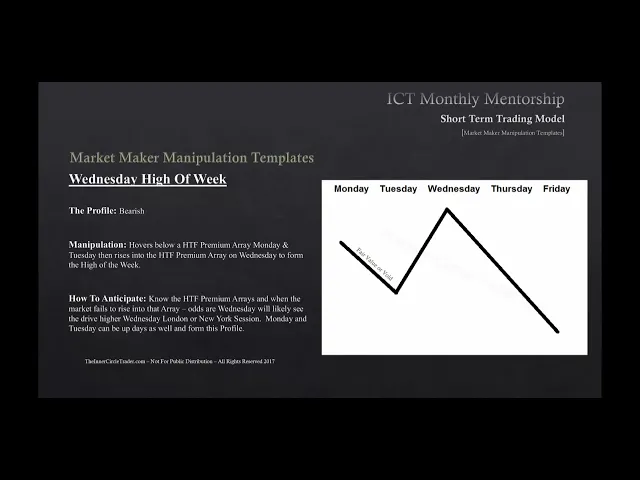
if they overlap and converge with a four hour discount PD array then you have your target for the week and you can Define what their weekly range would be and you hold for the opportunity to unfold until Thursday and maybe into Friday okay now we look at the Wednesday low of the week okay this is a market profile that's bullish okay we'll generally see the market show a short-term low on Monday and trading up into Tuesday and then Tuesday we'll see it trade lower down into a discount market now it could be trading down into an old monthly weekly or daily low for a liquidity pool in other words running out sell stops and we're looking for the market to trade up into a premium Market PD array in a time frame lesser than the discount liquidity pool that we use to train off of for a long you'll see this if you're familiar with my old teachings many times this is the framework I use for a reflection pattern and trust me I'll go through all these patterns in August when we fill in a lot of the gaps on things that are just subtle nuances and little extra tips I throw in that don't really have a place always that I can clearly Define it where this always does this or does that there's going to be some quirky things I teach you in August so that's one of those things I'm also going to apply but the uh the reflection pattern is basically a 127 or 168 extension where it runs at an old low but it's going to trade down to a discount Market PD array if it takes out the cell stops below the lows we're going to be looking for the market to trade up into Thursday or Friday preferably Friday into a premium Market PD array if we're going to see this occur on a weekly we're going to be looking for the long on the weekly and exiting our position on a daily or four hour premium Market PD array okay our next example for the Wednesday low of the week we can frame our Market with a discount Market old monthly weekly or daily high in other words we've seen the market trade up broken out now it's coming back down Monday we started to trade up a little bit then Tuesday it traded lower down to the old High so it could be a monthly high that retains back down into on Wednesday and we're going to be framing that with an expectation of seeing the market rally up into Friday with a premium Market PD array and or FIB extension 127 168 or perfect symmetrical price swing in a time frame lesser than that of which we use for the old high long so for instance if we bought a old monthly High retest after it's broken out we can see the monthly High acting as support so our electric time frame PD array or premium Target would be seen either in a weekly daily or four hour the key is finding where it overlaps with the 127 and 168. we're not just simply looking for 127 and 168 extensions we're doing that also and coupling it with in all these examples with a lesser time frame PD array that's contrary to what we use to enter the trade okay our third example for the Wednesday low of the week we can see the market trade down into Wednesday into a discount Market when the markets generally primarily bullish anyway and we're going to trade into a bullish order block and it could be in the form of a monthly or weekly or daily or it could be a first swing grade entry in other words if we see the market moving higher much longer term than just one week and we're seeing our first retracement back where we can get our lawn take a swing trade or a position trade on that it could occur at that first swing grade or it could occur at the equilibrium of the overall price move or halfway point of what you expect to see as an overall price Target or could occur at the third swing rate in other words one half between where you're halfway point equilibrium is for the trade and the ultimate Target now when we look at Price swings or targets And Trades we graduated into four stages first stage second stage takes us to equilibrium third stage or third swing grade and then the fourth is Terminus where the end of the trade takes effect and that's where your profits are taken that's the maximum we expect to see the market move this occurs sometimes at the first equilibrium and third swing grade as a potential opportunity so the market could be just floating around between a premium and discount Market on Sunday and Monday and Tuesday but then Wednesday it trades down into a discount level where it clearly hits a order block and now can be capitalized and send price higher up in through Thursday into Friday whichever you use in other words the time frame you use to go long on whatever that order block is whatever time frame it is that you use for instance could be a daily we're going to be looking for a premium Market PD array with an overlapping FIB of 127 168 or symmetrical price swing in a lesser time frame in other words if we've seen it on a daily that we bought a bullish order block on on Wednesday we're looking for the four hour premium pdra that overlaps with a 127 168 or a perfect symmetrical price swing the fair value or liquidity void that run down that price swing is what you use your fibs on to run your extensions for 127 168 or perfect 100 percent duplication of that price swing down just projected from the high okay Wednesday high of the week this is when you're looking for a bearish market environment okay and you have a short-term High here the market will trade up into a premium Market up into an old monthly weekly or daily High liquidity pool in other words it's running out an old High and we're framing the idea with a move down into a discount Market PD array in a time frame lesser than that which we used for a premium liquidity pool for instance if we are expecting bearish prices and this can occur in an equilibrium area on a larger price move that you expect maybe from a position Trader's mindset or a swing Traders mindset in other words if you're looking for a move that's much longer than just uh just one week we could be the Midway point of that and you'll see a short-term High being ran out this is a classic stop run and this is generally what you see on a Wednesday and if you see it on since for instance like a weekly liquidity pool if he runs out a weekly High it takes out those buy stops we could expect to see a daily or four hour discount PD array be our objective for the week another example for Wednesday high of the week okay we have a fair value or liquidity void and then it runs through that for the stops if we see that and we're overall bearish disc again we're gonna be looking for this as a scenario where it's a retest to an old load okay this could be a return back to a premium Market in front of an old monthly weekly or daily low and we're looking for a discount Market PD array and or a fib extension of 127 to 168 and or a perfect symmetrical price swing and the time frame lesser than that which we use for a premium or blow retest so in other words if we're looking for a retest back to a monthly low if we get short on that monthly low narrowing down our time frames down to a smaller time frame which we'll learn in April and in May with a shorter time frames but when we use the hourly chart we can fine tune that to a smaller degree of risk but we're framing our trade-off of the monthly load that's being retested traded button to Wednesday we'll be looking for that opportunity to send us lower if it's monthly that we're looking at that low on Wednesday to sell short from we're gonna be looking for a weekly daily or four hour discount PD array that has an extension overlap of 127 to 168 or perfect symmetrical price swing from that low up to Wednesday's high in other words Tuesday's low to Wednesdays high that price swing up that's what you're going to be anchoring your FIB on and the extensions below Tuesday's low would be a projection of 127 168 or a perfect symmetrical price swing or that of Tuesday's low the Wednesday's High that range subtracted from Tuesday's low that would be a perfect symmetrical price swing if you get that overlapping with a in this case if we're looking at a monthly low uh we could be looking from a weekly daily or four hour discount PD array that overlaps with that so again we're blending time and price in the last example for Wednesday high of the week we're looking for a fair value or liquidity void price going up into a premium into a bearish order block on a monthly weekly or daily basis or it could be returned back into our first retracement of an overall larger price swing and this will be the first swing grade entry or it can occur at equilibrium or it could be a third swing grade entry discount Market PD array or FIB extension preferably both overlapping a 127 or 168 or perfect symmetrical price swing in a time frame lesser than that of the bearish order block that we used to trade entry on consolidation Thursday reversal okay this is a market profile that's generally bullish you'll see this happen where the Market opens up on a Sunday and Monday trades sideways on Monday and Tuesday into Wednesday and then all of a sudden Market trades down on Thursday into a discount Market you've been looking for many times Traders expecting the market to shoot higher because of buy stocks being taken out or will be deemed as a market structure shift bullishly but we're looking for sell stuff in a bullish Market to be ran out so when that happens generally it's going to be like an fomc or an employment release the fomc release generally happens around the two o'clock hour in Eastern Standard Time New York time or it could be a New York session employment data released that can send the market higher based on this false break below an old low early in the week on Monday or Tuesday this false break becomes a turtle suit long and you're looking for the market to trade up into where the weekly buy stops are this is your liquidity pool and it's going to trade up into that level as your weekly objective so your one shot one kill setup would be buying the break below the weekly low on Monday or Tuesday running out to sell stops on the heels of either a high impact news event with employment data on the New York session around 8 30 in the morning Eastern Standard time or if you're again if you just want to play the fomc announcement once the market drives down takes those sell stops out if you can take a very very very very low risk entry and small position don't put a lot of money on this type of trade because if it's fomc you can get really crushed if it's a lot of whips on it but if you're going to be trading fomc very very small position wait for the initial knee-jerk reaction put your limit order down below the low let's follow Monday and Tuesday absorb all those sell stops and look for the buy stops to be ran out for the intraday high or running out the entry week high in the form of the buy stops liquidity pool so your one shot one kill would be framed only Thursday going into Friday so it's really one day's worth of action that you waited for all week but the scenario looks like this generally consolidation service a reversal this is when you're looking for bearish markets on Thursday the market trades up into a premium Market earlier in the week it'll look like it's taking out sell stuff or Market structure shift has broken to the downside and then Wednesday into Thursday you'll see the buy stuff taken they were formed intra week usually fomc 2 pm Eastern stand time or a 8 30 a. m Eastern Standard Time employment release could be the driver for this or the Market's driven up to above the intra-week high to take out the buy stops in an overall bearish Market environment in the market causes a false break this is a turtle soup short and you'll be looking for the targeting of the cell stops below the intra-week low for your liquidity pool okay and consolidation midweek rally this is a bullish Market profile and what we generally look for is the market to start off on a Monday right right from the beginning and on Tuesday you'll see retracement down into Wednesday and you're going to be moving back into a discount fair value Gap or liquidity void or bullish order block so any one of those scenarios could be your Catalyst but you're looking for a discount PD array and you're expecting on Wednesday a high or medium impact news event either in London or in New York session your swing projection or fulcrum point is the intra week high formed on Tuesday now this could also be a Monday High ticket in other words it can trade up to creating a short-term high on Monday and then trading down Tuesday and into Wednesday but that's one simple caveat to this this template and it's a reverse for when you're looking for a consolidation midweek decline what you're aiming for a premium PD array either in the form of a monthly weekly or daily and converging FIB extensions of 127 and or 168.
or could be a perfect measure swing projection now what does that mean the swing projection fulcrum is the highest high at which the market starts to retrace from that's the point which you want to pull your FIB down from into where it trades into the order block that'll give your swing projections up into the premium PD arrays let's take a look at that what that looks like an example so we have our high here this is going to be our swing point for outcome and then we're going to take our FIB anchor from the high down into the oral block or whatever PDA rate that we're using for a discount to enter that's our level we expect price to move up from so there's our range what we get then is an extension of 127 and or 168 FIB extension which takes us up into the premium Market what we look for not just a fib of 127 or 168 we're looking for a time frame lesser than that which we used to get long on either a bullish order block or bear shorter block whatever that time frame we see forming our entry on on Wednesday we use a lesser time frame to take our profits at but it has to be an overlapping of a premium PD array and a lesser time frame you use to buy at that overlaps with 127 and 168. now the FIB overlap levels are based on the time frame we enter on we look for a lower time frame COPD array in a premium range to overlap with that 127 and 168 when we get those two things we have a high Confluence level where we have both time and price and a green where the algo may very easily retrain for those levels and then that'd be it for the Target okay consolidation midweek decline this is a bearish market environment okay what we're seeing is on Wednesday you'll see uh it could it could occur on Tuesday too but we're looking for a premium fair value Gap or liquidity void to be filled in or trading up into a bearish order block and high or medium impact news in Wednesday London open or New York open and we have a swing projection fulcrum point and we expect to see the market trade down to a discount PD array in the form of a monthly weekly daily and converging fit extensions in the form of 127 or 168 and again it could be a perfect symmetrical price swing or 100 measured move so let's take a look at what that looks like as well in Reverse terms of what we just showed for the buy side okay we have our premium fair value Gap or liquidity void and or bearish order block but normally we're looking to sell short at a premium PD array in a bearish market environment we know our low the week is formed we've measure that up from our fulcrum point and we get our 127 extension from that low to Wednesday's High projected down that's 127 percent of the range between Tuesdays low and Wednesdays High and then we get the 168 percent of the range of Tuesday's load when it stays high now you don't need a Fibonacci overlay tool for this all you have to do is get Wednesday's highest high and Tuesday's lowest low and or it could be Wednesday's low okay but basically you're looking for the lowest low between Mondays opening and Wednesday when it trades up it's got to be trading up so whatever the highest high is that forms your projected low is whatever the range low is for the week up to Wednesday's High that range in terms of Pips times that by 1. 27 and that will give you your range that you subtract from Wednesday's High and you can do the same thing for the range from below the week up to Wednesday's High whatever that is in terms of Pips each times up by 1.
68 and you subtract that number of Pips from Wednesday's high and that'll give you your Fibonacci extension whoa okay so you can destroy bullish Friday okay this is a low probability or neutral condition all we're really doing is watching to see if it gives us any favorable outcome and it's more or less a market environment you want to be either on the sidelines or just demonstrating just for experience okay the market will generally create a small consolidation throughout the week going into Thursday we have a liquidity pool for cell stops it's forms in intra week higher medium impact news on Thursday usually it's tight like I said it's either fomc or employment decision and we're going to be anticipating the sell stop raid below the lows of the week intra week buy stocks would be determined and a liquidity run to a daily or weekly premium PD array would be the result in other words we're not going to be looking just for a intro week run on buy stops we're going to be looking for a run completely above all of the entry week highs to a liquidity run on daily or weekly premium PD arrays so in other words we're going to be creating a new weekly Range High in a level that hadn't been traded for so far for that week and it's going to move it aggressively and very speedily to that level now this Market environment can occur when the Market's bullish but it also can occur when the Market's bearish if the market trades Down Below in Old low or breaks out on a higher time frame but sales that have any movement lower we can get a Thursday high impact on medium impact news event or interest rate environment that sends us aggressively higher in this environment or this Market profile this is one of the hardest ones to trade and if you see the market just consolidating back and forth taken by stops and sell stocks you know throughout the week it's probably better for you to sit on your hands and just don't trade it anymore because the chances are you getting this right are not 50 50. you know and if you're wrong it can really blow through whatever your stop loss is if especially if it's fomc or if it's you know um well it would just have to be something along with the monetary policy once it gets up to a daily or weekly premium PD array what we're looking for there is we want to see possibly a potential reversal so what we're doing is why is this template useful that's your answer you're waiting for it to get up to a daily or weekly premium PD array once it does that we are expecting a reversal okay so you can destroy bearish Friday again this is a neutral low probability profile and Market manipulation template what we're looking for is the outcome of this we're not looking to trade it so we're looking for the market to create a consolidation Monday through Wednesday and then building a liquidity pool of buy stops intra week and on Thursday we anticipate that market to be taken up to that level taking out the buy stops and a run on high end or medium impact news usually is the Catalyst for that we're anticipating the buy stop breed and the market will run the intra-week cell stops and ultimately Target a liquidity run to a daily end or weekly discount PD array again we're not looking to trade this we're looking for it to unfold usually when the markets are in consolidation Monday Tuesday and Wednesday and it's usually like a employment number or it's a fomc type event that type of Market driver that's released later on in the week the second half of the week uh post Wednesday in New York open we're looking for the market to run to a higher time frame PD array okay and if we see they run to buy stops intra week and they sync it lower what we're going to be watching for not that we're trying to trade it we're looking for it to trade down into a higher time frame daily or weekly discount PD array when that happens what we're looking for is a potential reversal okay uh Wednesday weekly reversal now this is not the same as the Wednesday low of the week uh templates that we're given into towards the front of the um this presentation this is a little bit slight slightly different we're looking for an old low or retail support and high or medium impact news drives price down below that and it is generally on a hard time frame basis that we see these types of moves taking place in other words we're running a weekly monthly level or support level out and it's on the heels of higher medium impact news and then once it dries down below that the Market discounts that news and reverses what we're looking for is a Fibonacci extension of 127 or 168 or even a perfect symmetrical price Wing but generally it's usually a 127 or 168 extension from the old low retail support rally up into Tuesday's High project that down that'll give us some measure of extension the market usually will find its way down into a monthly weekly or daily discount array and we'll be using the swing projection fulcrum point to project up to a 127 or 168 extension and overlapping of a weekly or daily premium PD array and lastly the Wednesday weekly reversal when the market is bearish okay we're looking for old high or retail resistance higher medium impact news runs it above it and then the market rejects or discounts that news event and it takes us up into a Fibonacci one extent 127 or 168 extension and a monthly weekly or daily premium array in order to looking for something up there to align with that 127 168 extension and then the market will look to move below the swing projection fulcrum Point down into a weekly or daily discount PD array overlapping with a Fibonacci extension of 127 or 168.