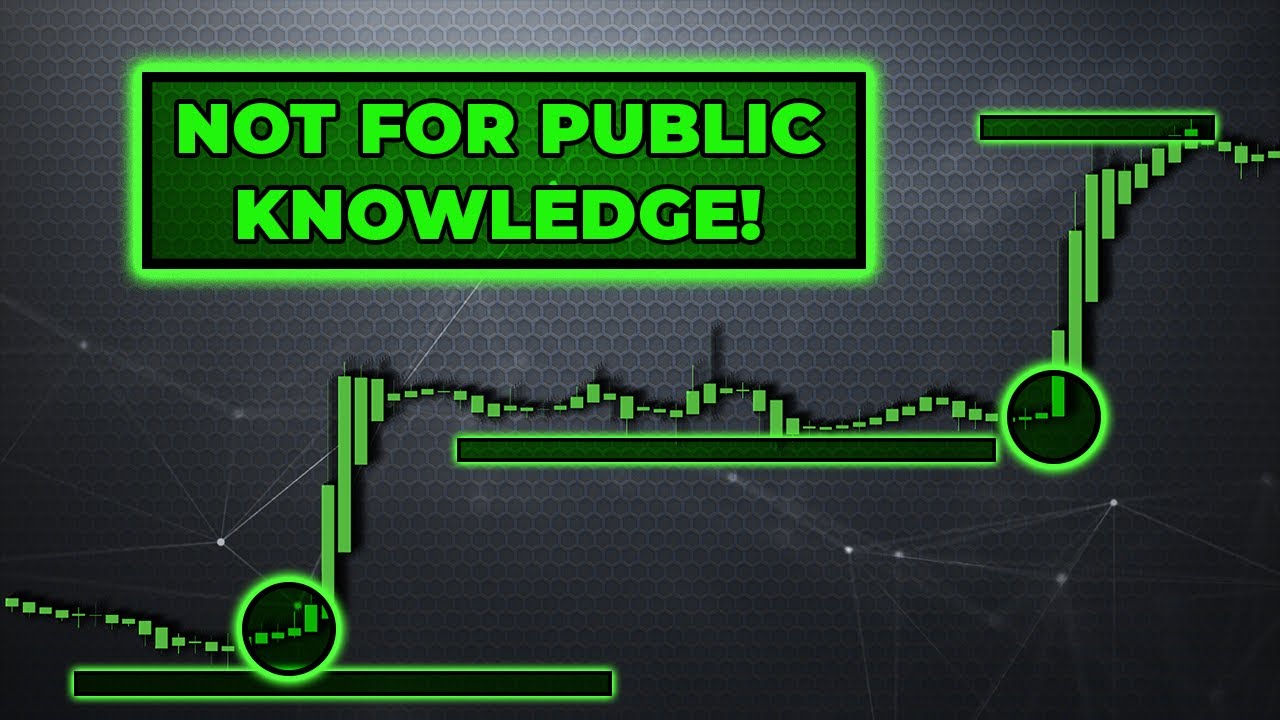
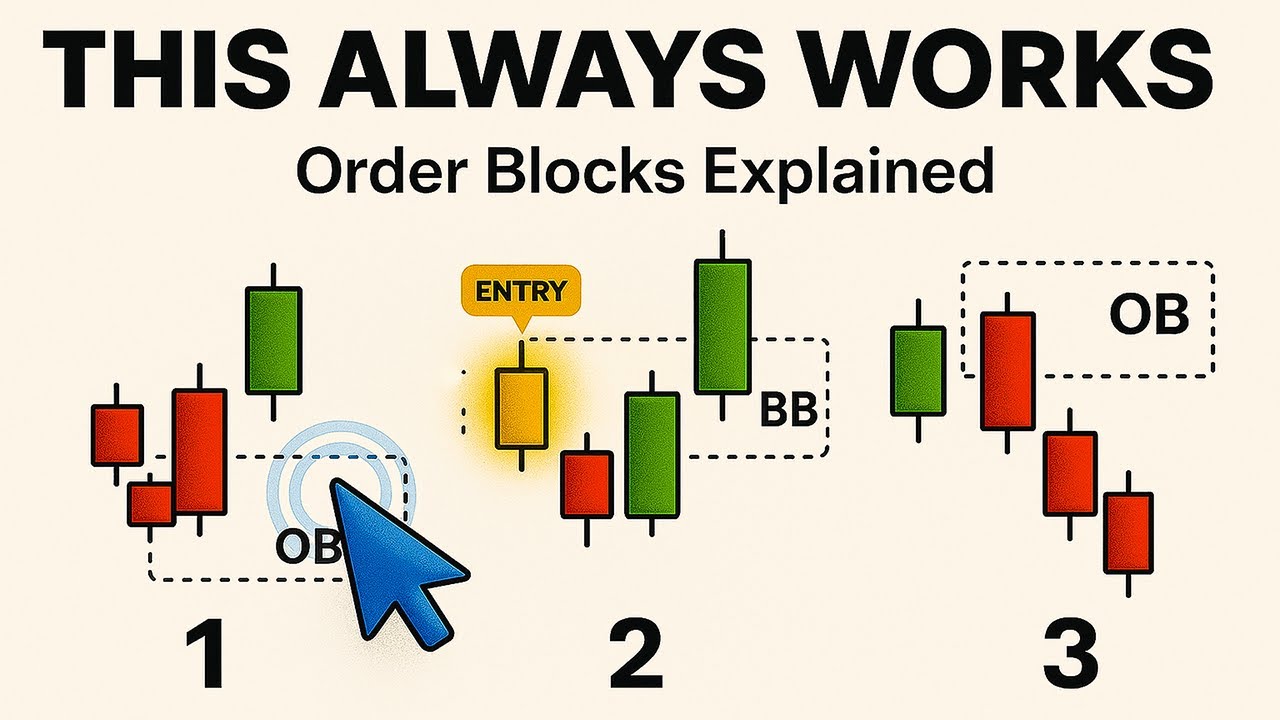
Take a look at this chart. This is one of the most common traps used by smart money to fool both buyers, and sellers, at the same time. You probably faced this yourself.
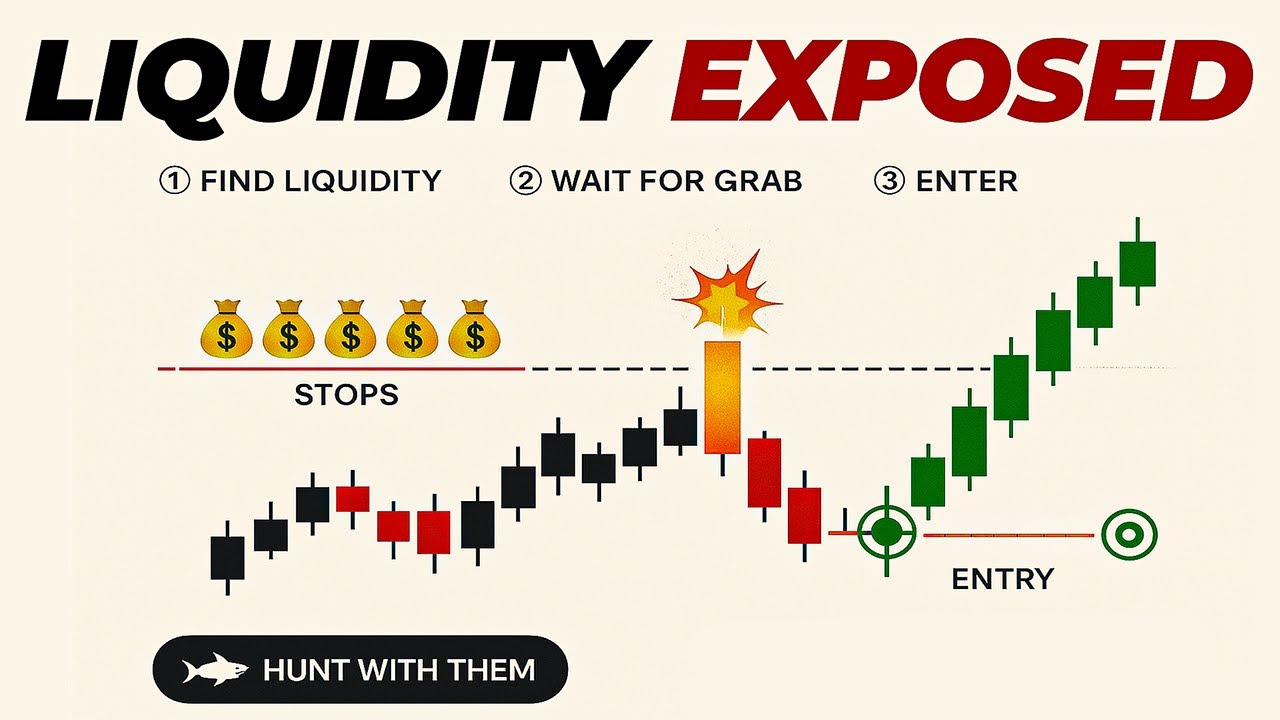
Market breaks a swing high, you think is a breakout, but instead of continuing higher, it aggressively moves lower, also breaking a recent swing low. Basically, a double liquidity clear-out. It happens every day, on all time frames.
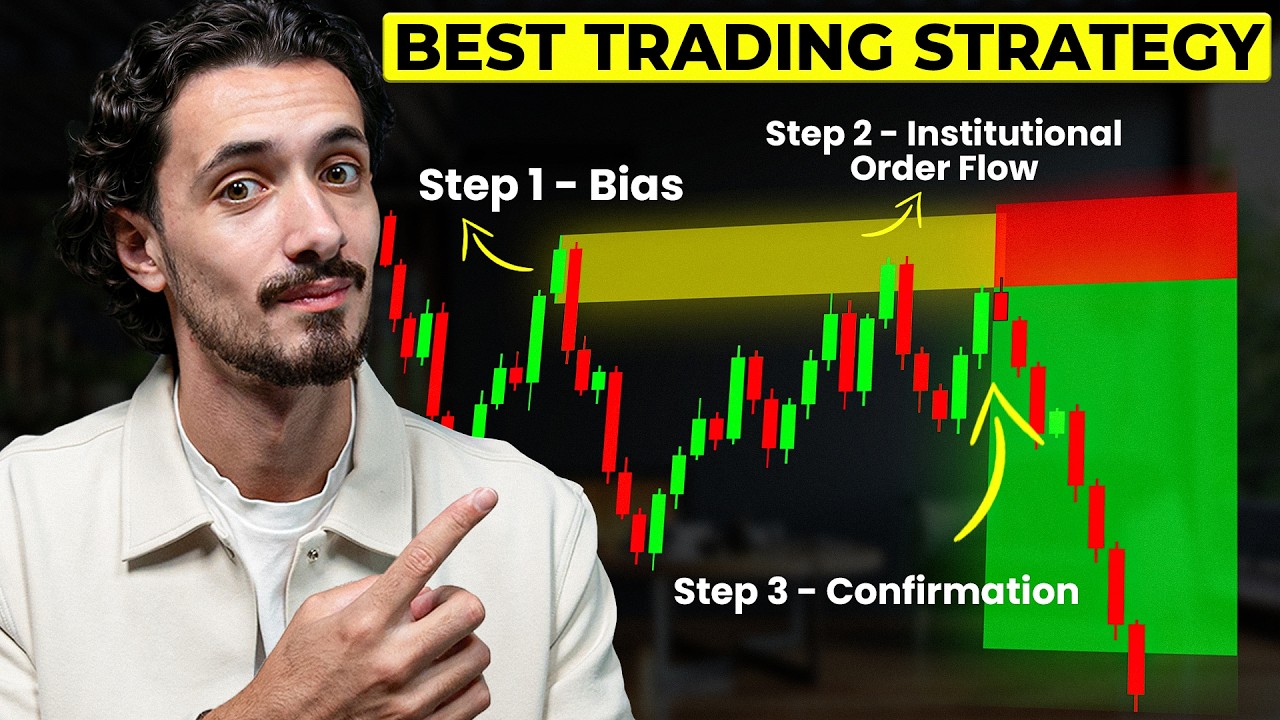
And if you identify it correctly, it might be one of the best smart money setups to trade. Let’s talk about this. You know the drill, like, subscribe, and stick around for the full video.
The Double Liquidity Clear-out TRAP It all starts with a breakout that fails to continue beyond a level, resulting in a ‘false’ breakout. False breakout patterns are one of the most important price action patterns to learn, because a false-break is often a very strong indication that a momentum move might start soon. Trading is a game of deceptions and traps, and you must learn to play accordingly.
So, firstly, price will break a swing high, but then it quickly reverses, deceiving all buyers who took the ‘bait’ of the breakout. It’s often the case that amateurs will enter what looks like an ‘obvious’ breakout. Then the professionals will push the market back the other way.
This is the first liquidity clear-out. The second part of the pattern consists in another trap. Price will fall and will break a swing low, this time trapping traders on the short side.
This is the second liquidity clear-out, designed to trap the ‘weak hands’ in the market. This include traders that take positions when a market is already quite extended or they try to ‘predict’ a breakout from a key support level too early. Smart money of course watch for these missteps by the amateurs.
As a price action trader, you want to learn how to use this double liquidity clear-out to your advantage, rather than falling victim to it. From my backtests, after I spot this double liquidity clear-out setup, I try to find a trade in the direction of the initial false breakout. It’s basically a trend continuation setup.
Don’t get me wrong, it takes discipline and a bit of ‘gut feel’ to know when this pattern is likely to occur, and you can never really know ‘for sure’ until after the second liquidity clear-out has formed. But when you find it, the high probability trade is in the direction of the initial breakout. Both buyers and sellers are trapped in losing positions The double fake out pattern occurs in all market conditions; trending, consolidating, counter-trend, but, from my experience, the best way to trade it is in-line with a dominant trend.
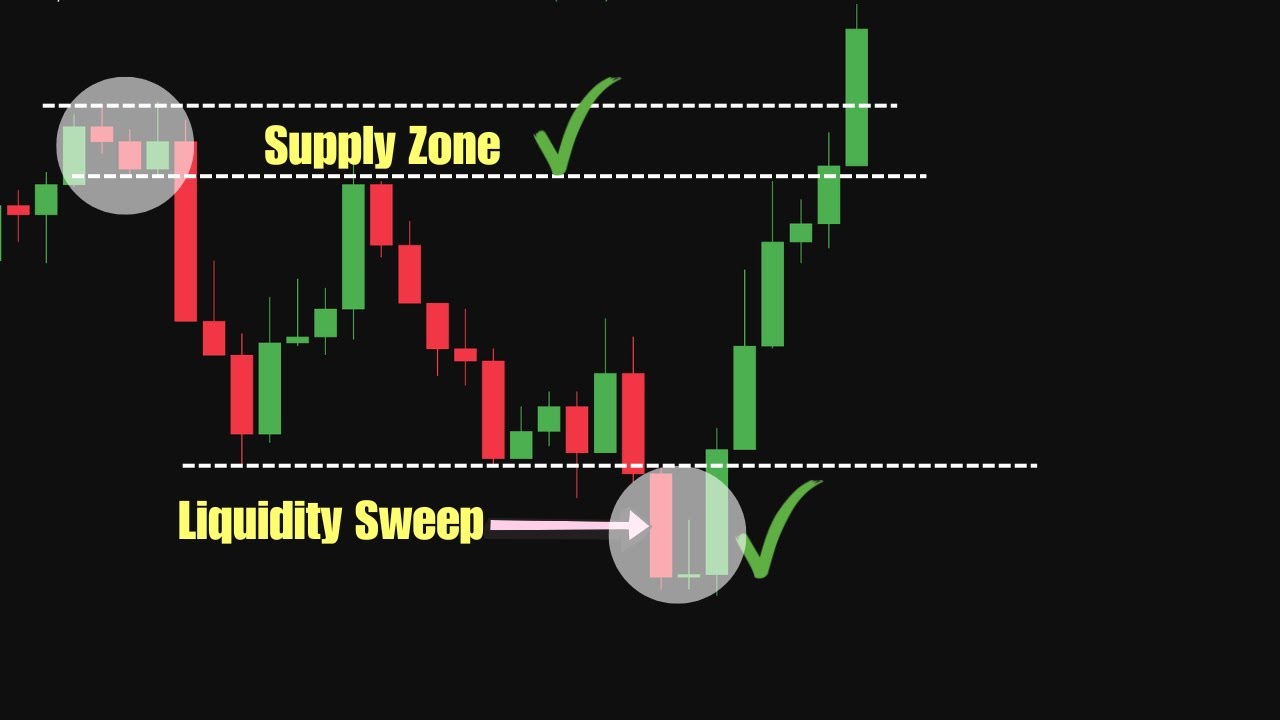
Have you ever been stopped out, only to see price reverse from that very same level? I’m sure you have and you’re not alone. Many traders tend to place their stops in the same types of places, without sufficiently weighing the fact that they are incredibly easy to hit.
In this chart, we have a clear downtrend in place and a double liquidity clear-out, first to the downside, then, to the upside, within a larger downtrend trend. When you have the second trap, baiting buyers in the market, where movement is against a dominant trend like this, it’s usually a very good signal that the trend may be ready to resume to the downside. Amateur traders love to try to pick the bottom in a downtrend or the top in an uptrend, and most of them are happy to trade a reversal, instead of a continuation.
On each of these false-breakouts in this example, 2 different types of traders were trapped. First, traders that entered short when the market was making a new low and the second batch of traders that thought the downtrend was over and so they started buying. So initial sellers were removed from the market, as their stops were probably around the area where buyers anticipated a breakout.
Buyers were also trapped after the second liquidity clear-out. And then professionals took advantage of the temporary strength within the down-trending market and entered short from value, and then the downtrend resumed, flushing out all those amateur traders with weak positions. Enter after the second liquidity clear-out You want to position yourself after the second liquidity clear-out, in line with the smart money and with the dominant trend.
I can’t give you an exact entry, but price action is again your best friend. When price returns inside the previous range, after the second liquidity clear-out, and there’s no momentum to the upside, you have to find some sort of signal to enter. In this case I see a double top and a bearish engulfing candle, offering several clues that the downtrend might resume.
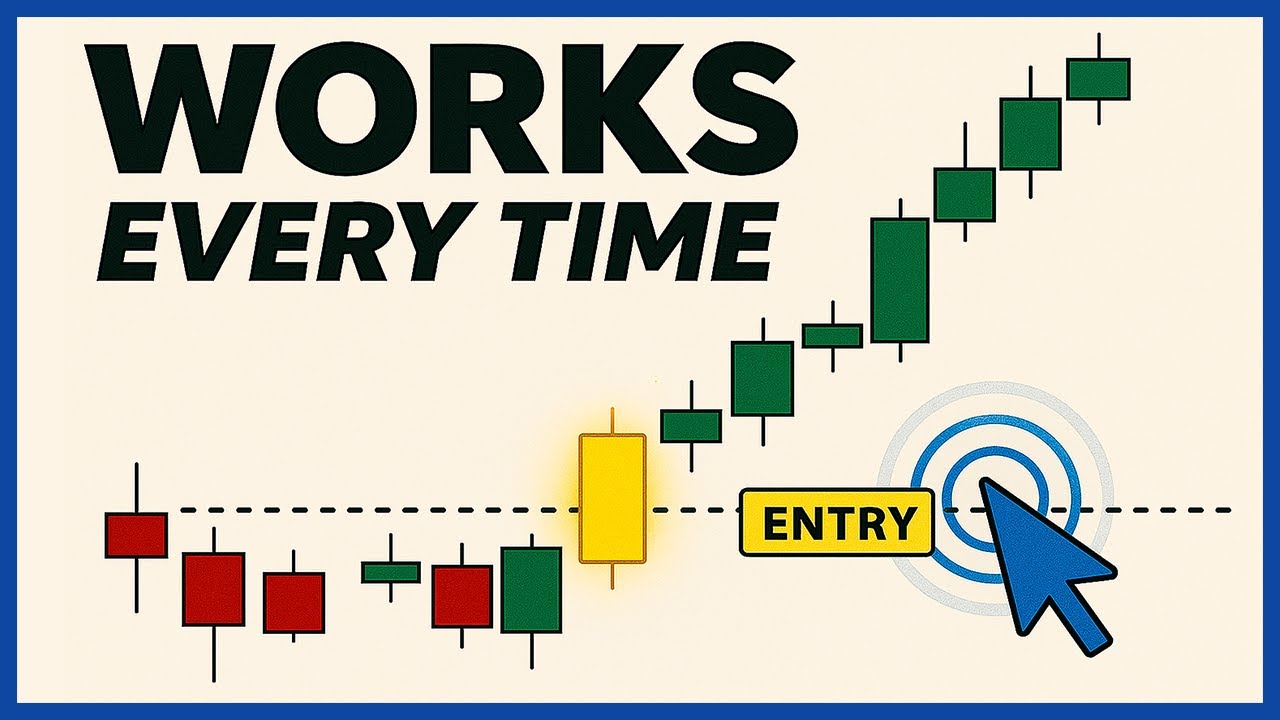
You could also add a 20 moving average, and trade when price moves below it. There are many methods to enter, you just have to choose the one you feel most comfortable with. Expect liquidity clear-outs when a market is stuck in a range The double liquidity clear-out pattern is very common in trading ranges because inexperienced traders often try to pick the breakout of the range.
However, price may stay range-bound for longer than most assume. Knowing that liquidity clear-outs are somewhat common when a market is stuck in a trading range is a very valuable piece of information. Trading this setup in a range-bound market can be very lucrative as you can wait for liquidity clear-outs at both the support or resistance boundary of the range, and then trade back in the direction of the first false breakout.
It sounds easy in theory, I know. The best way to be sure you don’t get caught in the second false-breakout, when you plan to enter, is to simply wait for price to close inside of the range. If this happens, there’s a good chance the pattern is completed and price is then going to start trending again.
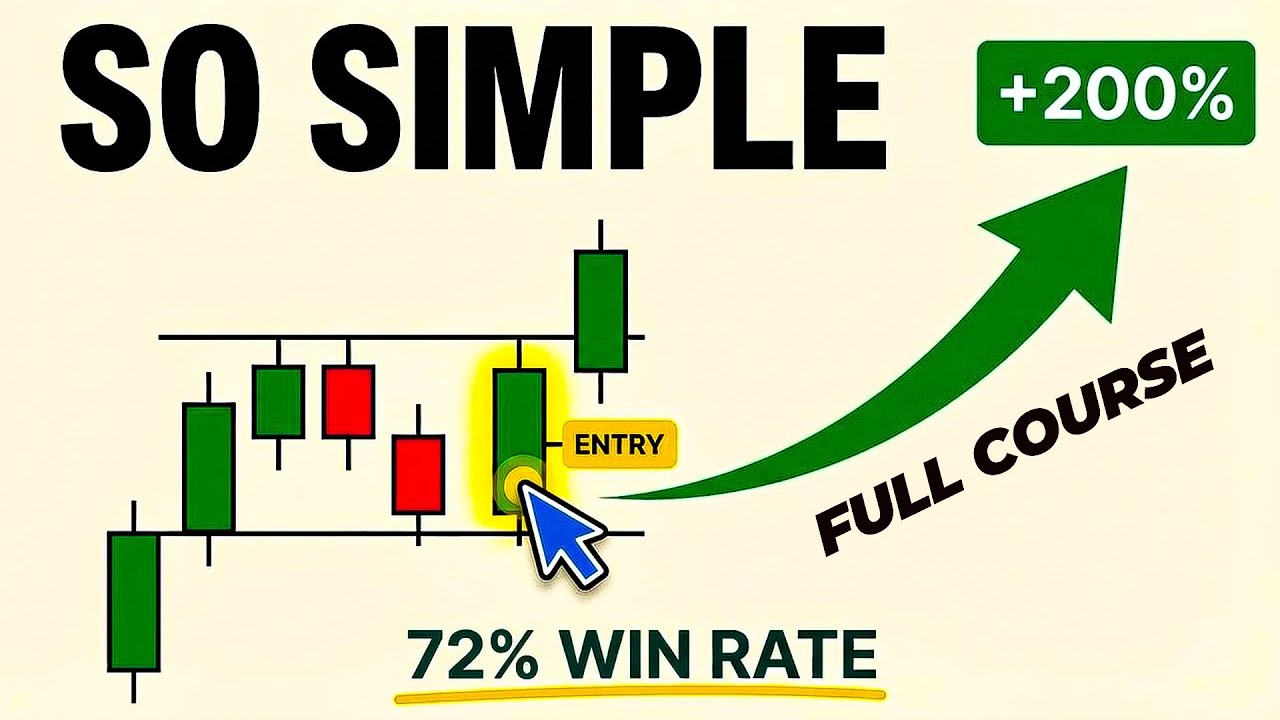
Pin bars and candles with large wicks With this setup, pin bars and candles with large wicks will help you to identify the liquidity clear-outs and will also help you to time your entry. Let’s look at his EUR/USD chart, on the hourly time frames. At a quick glance I see not 1, but 2 obvious setups.
The first one is here. Liquidity clear-out, reversal, buyers are trapped, liquidity clear-out, sellers are trapped and price continues in the initial direction. And the second one here.
Liquidity clear-out, sellers are trapped, reversal, second liquidity clear-out, this time, buyers are trapped and price continues its recent downtrend. Both setups have one thing in common. Can you identify it?
We have candles with large wicks during the second liquidity clear-out, on both occasions. A price action trader can use this false breakout pin bar signal to trade the setup. First we get the bullish pin bar at the bottom of this liquidity clear-out.
This pin would have looked like the big bearish candle, baiting sellers to enter the market. A lot of traders shorted the market when the candle was forming. And I know that if the market was to move higher from here, at some point the traders who have sold during this pin are likely to close their trade.
The same here. Before this pin bar became a pin bar it was actually a large range candle. And if you watched my previous video about common market traps, you know that large range candles are the types of candle which traders will use to jump into trading positions.
The price made a large up move which seduce lots of traders into placing trades in the direction of the candle, the sudden increase in buy orders means smart money are now able to complete a trading action such as taking profits or placing more trades. When smart money make their decision, all of the orders which were coming into the market from the traders placing trades in the direction of the candle are consumed and the price moves in the opposite direction. And because these actions pushed the price in the opposite direction to which buyers had placed their trades, it means their positions are currently at a loss.
In both cases, if you want to profit from these trapped traders, a pin bar will make it easier to place your trade. You set the stop loss, below the bullish pin bar here, and above the bearish pin bar, here. The psychology behind the double liquidity pattern It is important to understand the psychology behind this double liquidity pattern and why it often reveals that smart money might be behind buying and not retail "weak hands".
After the first aggressive liquidity clear-out, many retail traders don’t think of buying, if anything the opposite. The magnitude of fresh selling could discourage buying and trigger selling instead (many traders start thinking about abandoning their prior long positions). If someone is actually strongly buying after the second liquidity clear-out, it is more likely than it isn’t a retail participant.
This gives you insight that someone bigger is willing to defend this area. After you have been on the wrong side of a market a few times, you will begin to realize that this double fakeout can actually provide high quality tradable opportunities. The reality is that classic technical analysis, teached in most trading books, is kinda outdated.
And you should design your trading strategy around these types of scenarios. Some of the best trades occur when market players become trapped and begin to cover their losing trades. Accumulation, manipulation and trend phase.
If you have trouble finding this pattern, try to break it into 3 stages: accumulation, manipulation, and the trend phase. Accumulation is the stage where smart money enter their positions, manipulation is the stage where the first and the second liquidity clear out appear, and after the traders are trapped, the trend phase begins. The first thing you need to identify is the accumulation.
Sometimes is obvious, sometimes in not. Banks either enter the market by accumulating a long position which they will later sell at a higher price, or a short position which they will later buy back at a lower price. If you can identify the price levels where banks are accumulating, you will also be able to identify the direction of future price movements.
Accumulation is often characterized by a ranging-type market where the price moves sideways. It is in this zone that banks regularly enter the market to accumulate their desired position. Manipulation is the next step after accumulation.
This stage is characterized by false movements. And as we already discussed, retail traders are the victims of such market manipulation. They take positions when they see that there is a potential breakout.
But it turns out to be just a fake push and the price then moves in the opposite direction. If you ever find yourself in this situation, it's not bad luck. In this example the banks are trying to enter or build up a long position.
At the same time, they're also creating selling pressure. They will try to "manipulate" retail traders into first going long, then short. To follow the banks, you need to identify the second and hopefully, the final liquidity clear-out that marks the end of an accumulation phase The third stage, is the trend phase, the continuation in the direction of the initial fake out.
At this point, the banks have accumulated their position and created the market manipulation. They no longer try to conceal their presence. Now, the banks will try to push the price in a specific direction, which means this is where a market trend will begin.
And yes, trying to avoid the traps and recognizing the pattern is difficult. It takes a lot of research time, and plenty of live trading and market observing experience, to notice these stages in real time. But if you understand how the banks are manipulating the market, you'll be able to identify the direction of the market trend that the banks are trying to push.
Your next task will then be to just follow the trend, after the second liquidity clear-out. This doesn't mean you'll never lose when using this strategy, but it will keep you focused and ready to win more consistently. Once you adopt trading strategies that are in line with those of the big players, your chances of making profits will go up.
Now, this strategy is designed to take advantage of market traps. If you want to easily spot areas on your chart that are likely to be targeted by Smart Money, you should definitely watch this video, because it will show you how to adapt to the different challenges that the market will throw at you. And check out our academy program, if you want to further level up your trading.
Until next time!