Welcome to the final class. This is going to be the final class that you will need to watch in your whole entire trading career to understand how to trade. I'm talking about in this 10hour video, I am literally going to teach you from zero to 100%. From the point that you are literally going to be able to execute a trade with me inside of this video live. Whatever I do on my phone, you pause the video, you do it on your Phone. Whatever I do on my chart, you pause the video, you do it on
your chart. I'm going to take you through the most stepbystep process that I have personally ever created or ever even seen online on a complete tutorial on how to teach you trading from zero to 100%. This is everything in one spot. I swear to God, I wish I had this video when I started my trading journey back in 2019 2018 when I was learning how to trade online. Nobody created tutorials Like this. There was a bunch of different videos throughout the whole entire internet and I kind of had to piece them all together. And by
the time that I pieced them all together, I simply had an information overload and I didn't know what I actually needed and what I didn't actually need. In this video, I'm going to teach you everything that you need and I'm going to briefly explain to you what you don't need so you don't have to simply waste time on It. Because the truth of the matter is that right now in trading, everybody is having a massive opportunity to make money online. the more time that you waste having the lack of knowledge and not having the proper
education to go and trade, the more time you are missing out on these profits. So, I'm going to make everything on this one video, so all you have to do is just watch it from zero to the end. You're going to know exactly how to be able to go out there And execute trades live in the market. Now, I have really been thinking about doing this video for quite some time. I just haven't had the time to actually get it done. But, when I actually now decided to get this video done, I wanted to this
be more than just an information overload video. Like I wanted you to practice this in real time. You're actually able to go out there and execute live based off off of this video. Something that you actually get Value from and you're actually able to go out to the market and properly do it for yourself. Now, you're probably asking, who is this guy that's going to be talking to me for the next 10 hours and is he even a reliable source? I've been trading the currency market for the last seven years, and it took me about
three years to become a profitable trader. I was two and a half years trying to figure out how to make money online when it comes to trading. And After two years of watching endless amounts of videos and failing, I finally figured it out. But it really wasn't always about trading. I first wanted to make money online. But before making money online, I was working at Dunkin Donuts. Before working at Dunkin Donuts, I worked at Crocs, Arab Postal, Sant's Enchanted Forest, and I even tried to get a job at a Valley parking, but I never got
hired. I was just a regular high school student that got out of high School and did not want to go work the regular 9 to5. I wanted to get out of high school and become a successful person. I wanted to become a millionaire. I remember as the semester was finishing, my professor came up to me and he woke me up from an nap and he was like, "Hey, just letting you know right now, you could not come back tomorrow or not even finish this semester, even if you were to ace every single one of the
next tests, you're Still going to fail the class." And I said, "You know what? Thanks, man. You just saved me the next two months of my life cuz I was going to keep coming in here and falling asleep." Fast forward for the next two months. I kept going to campus because my parents were tracking my location and I had to go to school because they would, you know, kick me out of the house, ground me if I wasn't going to school. And I was going to school to just figure out how to make Money online.
I was figuring out a way on how to do drop shipping, which I tried to buy multiple different products, but my credit card limit wasn't enough. So, I couldn't have enough inventory. Tried that for a little bit, dabbled with it, never had success. And then I tried Airbnb arbitrage. So on my free time, as soon as I finished work and got out of the school, just sitting in the library trying to figure out how to find the Good properties for Airbnb arbitrage, I realized that when I did find a good property, I didn't have the
proper credit and have the bank statements to sign a lease so then I can subleasase it, put on Airbnb, so on and so forth. And I pretty much wasted about 6 months of my life trying to make money online when it came across, you know, these different businesses. And then one day, one of my friends invites me to this event where they're teaching trading. I'm like, ah, dude, I've heard of this stuff before. Supposedly, it's a scam. It's not real. Said, "You know what? What's the worst that can happen? I lose 100 bucks. Really, all
I have at the time to risk on this." I go to the event. I get sold on the whole entire MLM product, multi-level marketing. And uh what that really did is that it opened the doors to what trading is and the possibility that it actually has. I was there for probably 30 days. I Realized that these multi-level marketing companies don't teach you how to trade. They just teach you what it is. But that opened the gates for me to actually go out there and try and figure it out. So I tried to go on with
stocks and I realized in order for me to actually create a account in a stock market or with the stock brokers for you to actually go trade, it was a minimum of 25,000. That was back in 2018 2019 when I was starting to trade. I didn't Have 20,000 $25,000 to open up a trading account. So then I heard that there's this forex market, foreign exchange where the entry barrier is 100 bucks, 50 bucks, and you have leverage up to 1 to 1,000. And then there that means you have a lot more buying power in your
money. The markets are open 245 compared to the stock market. They're open 9 to5, 5 days a week. I said, you know what, this is a lot more attractive. Let me actually go head first into this. And Little did I know that I was going to be walking into one of the longest, darkest, and loneliest journeys that I have ever been. And that journey began by myself in the library at Miami Day College campus. I was a whole entire year going to Miami Day College campus. Instead of me learning English or learning mathematics or whatever
they were teaching me in criminal justice, I was learning what the foreign exchange market was, watching endless amounts of Videos on YouTube, buying different a bunch of different courses trying to see if it all worked, where it all came down to one simple thing. And all of that I'm going to be teaching to you guys in this video completely for free. and it's all going to be in one spot. I had to piece so many different videos together that literally that is probably what took the most amount of time getting all the information that was
on the internet, hearing the same thing seven different Ways, realizing I'm watching the same thing from a different person, saying it in a different way, and then having to minimize all that information for it to come down to one thing. And that is exactly what I'm going to be doing in this video today. And it almost feels like it went by extremely fast now that time has gone by. But after 6 months of me just trying to put all this information together, lost a couple thousand dollars. Another 6 months went By and then I was
supposed to be graduating from college, getting my AA on pretty much year two and my parents realized that I was not going to college and there I had to pretty much break through the news that I was doing this whole trading stuff and I was probably about a year in year and a couple months in and I was so deeply invested that I had no other choice but to continue to go. There was no way I was going to continue in figuring out a different way On how to make money online once I've already invested
a whole entire year into this. And things were starting to click, or at least I thought they were at the time. So, I basically broke the news to my parents. I said, "Hey, I'm trying this whole trading stuff. I need you guys just to give me some time to figure it out. My parents did not believe in me. They weren't supportive of it. And I wouldn't either. I have old school Cuban parents that they barely Know how to use WhatsApp. They don't speak English. They honestly just all they understand is work on a regular job
and that's how you're going to become successful. It's not their fault. They were raised differently. But I knew that there was different ways on how to make money in this world, especially online. So after about a year and a half, my parents aren't supporting me. I'm just kind of living there at the house. I'm literally trading from my mom's closet. We have a closet downstairs and I'm just trading out of that closet. And I'd say probably for the next six to eight months, it was a battle in between myself and understanding the actual markets. So
now I know exactly what trading is, how it works. But now I'm just trying to figure out these patterns and if there really is one behind it. And I'd say after 6 months, it got to the point where I was seeing the patterns. I would see things happen over And over again. But I just wasn't entering at the exact point. I was either entering too late, I was entering too early, and I was probably closing out my profits too short, my stop losses were too tight, I was just doing a lot of minor mistakes that
accumulatively made me a unprofitable trader. Right around the 2-year mark, my parents once again are pressuring me, what am I going to do with my life, and I just kept asking for time, still working at Dunkin Donuts, dabbling other jobs, but I'm trying to dedicate as much time as I possibly can to trading. Now, at this point, I seek some different types of more serious mentorships. I understand a little bit more. You know, you need act an actual strategy for you to actually become a profitable trader. And right around the 2 and 1/2 year mark,
I went from losing consistently for two and a half years to having my first ever break even month. I'm like, whoa, I think I Might be doing something right because you know what? This month, I didn't blow any accounts. I didn't lose any profit accounts. Like, I think I'm on to something. The month after that, so two months, two years and about seven months, I had another break even month, but a little bit slightly in profit, probably 1%. And then the month after that, I was in profit 10%. I went from being an extremely unprofitable
trader to then a break even trader to having my First profitable month. All of that in the span of nearly three years. And in this video, I'm going to shorten what I learned in 3 years, all of the mistakes that I did, all the unnecessary information that I had in just a one class setting. This is going to save you guys so much time, so much headache that I can't even I wish I had this when I got started. After my first profitable month, everything literally just clicked. I started going from break even Months to
a profitable months to then just this becoming the new normal. All I had to realistically do was look back at my actual winning month and be like, what did I do right there? If that's what worked, let me just double down on it when I see it again and then again and again and again. And then you fast forward for another year. So I'm about three and a half years into my journey. I am now a full-time trader. I think on my third year, three month three years And one month, I left Dunkin Donuts, left
my job, and I'm now just a full-time profitable trader. Told my parents that it's actually working. They're seeing the money. they're believing it. And then right around my fourth year, I decided to just start posting on social media because, you know, that was the only way to pretty much meet people as a trader cuz if you're a trader, you're kind of in an office like this. You're just home 24/7. You're never going to really engage with anybody cuz you don't need to go out to a social setting for anything. Everything you could just do it
from home. And all of my friends that I had in my journey as I was learning trading, all of my high school friends, I pretty much separated myself from them because they didn't believe in my journey. They didn't understand what it was and they were causing me so much stress trying to convince them of what it is and that It's actually possible that it was distracting me from the journey. So, at this point in my journey, I'm really by myself and I'm just trying to open up my doors to new people, just meet people, maybe
meet some new girls, attract girls, cuz I'm realistically just making a decent amount of money by clicking a couple buttons and I have so much free time throughout the day. And like a hurricane or like a snowstorm or whatever you want to call it, it just Blew up. I started posting, you know, I bought my first supercar, which is an Audi R8. I started posting profits. I'm making a couple thousand dollars every single day. And out of nowhere, this created this massive community of other people wanting to learn how to do the same thing. The
questions that I was getting asked were pretty simple questions. And I decided to say, you know what? Let me just start helping people. And I just started posting YouTube videos. And fast forward another three, four years, and we're here where I arguably think I have one of the biggest trading communities in the industry. And I have helped thousands of people all around the world and shortened their learning curve from years to months and gotten people to make tens of mistakes a day to maybe one a week and then them learning from that and using those
losses that they avoid to optimize and actually be able to risk The correct amount of money on the right markets. So it all went from being a unprofitable trader by himself to then developing a skill set without even knowing it, posting it accidentally on social media. it blowing up and now to the point where I just changed traders lives all around the world and now this video is for you. And the only reason why I gave you this whole entire backstory is so you understand at the point where I am right now in my Journey.
I have so much free time that all I generally have passion about right now is just helping other people. I am literally dedicating more than 10 hours to make this video for you because this video is going to probably be 10 hours and I'm done with it. But for me to record it, for it to all get shortened down to the point where I probably put 20, 25 hours into this video, I'm doing this for you. So, all I ask for you is to literally only focus on this video. And if by the end of
this video, you did not learn anything. You have absolutely no value. Hit the unsubscribe button, block me, never look at me ever again. Don't believe me. But I am putting so much time and so much effort into this video because I personally really do wish I saw one of these videos when I got started in my journey. So if you have any question, if you have any concern, just go back, pause the video, write down notes. If I were to show you The amounts of notes that I took when I was learning in my journey,
I think I wrote down the same thing 15 different times because I was watching 15 of the same videos just in different ways from different people. And that confused me so much because everybody would say it in a different way. And what I can guarantee you is in order for you to become a profitable trader like me, there is no other video that you need to watch online, including my own, because This video is literally going to teach you every single topic, every single subject that you need to know to understand the markets exactly that
I do. Once this video is finished, the only thing that separates you and I is going to be experience. And that is what's going to lead you to become a profitable trader. So right now, if you're driving, if you're at work, you're on a lunch break and you started this video, make sure you pause it, put A bookmark on it, and come back to it when you're ready to sit down and actually focus. Do not halfass this video. Do not put it on 2x. The points of trading is for you to take your time with
it. This is a marathon, not a sprint. And you attempting to learn this information faster is actually going to slow you down because you're trying to speed things up and get all this information as fast as you can. It actually slows you down because you're Not going to process it and understand it and you're going to have to come back and watching it again. So, it's going to actually take you double the amount of time. No matter how fast you want to learn this, it takes time. It takes repetition and you need to understand this
is a brand new language. And a perfect analogy that I can put is let's say you're going to go build a house and the same day you buy the land, that same exact day, you have the builders, you Have the plumbers, you have the roofers, you have the carpenters, you have the landscapers, everything. You cannot have the roofers put on the roof if the builders haven't even built up the walls. You cannot have the gardeners put up the garden if they haven't finished the construction. You're going to mess up your garden. Everything is a stepbystep
process and it takes time. And that is exactly what this video is intended to do. It's intended to go step By step in the correct order and for it to be taken my time for me to explain to you so you understand it at the correct time. Now, with that being said, let's officially begin this video. And if you are not 100% ready to write down notes, if you don't have your notepad out, if you're not in a calm setting, if you're not locked in, you don't have your headphones in, do not watch this video.
Click the pause button and come back when you're ready. It's going to be a Lot more effective that you watch this video when you are 100% prepared to actually watch this video so you take a notes effectively and you understand everything effectively. So with that being said, let's begin. So what is this trading stuff? What is this forex? What is this stocks? What is this crypto indices, commodities, futures? What is this charts? What is trading? Well, I'm sure we've all seen charts, right? This is what a chart is. chart is when Something goes up or
something goes down. You've probably seen it either on an actual candlestick format like that or you've seen it on a line chart like this. These are different ways on how the markets are seen. You can see it on a line chart. You can see it on a bunch of different ways. And don't worry, we're going to get into all of those different ways in just a second. But what exactly is trading? Well, trading is when you're literally doing what it Says. When you are trading, you're trading one thing for another. Now, some people think when
it comes to the forex exchange market, the foreign exchange market, that you're actually trading one currency for the other. Some people think that, oh, the euro and the dollar, you're actually buying the euro and you're exchanging it for the dollar, or you're selling the dollar and then buying the euro. At no point are you ever actually doing that. You're Essentially just betting that something's going to be going up or something that's going to be going down. We're going to get into all of that in just a second. Now, before I actually get into the charts
and I show you how to actually read the markets, I first need to teach you and educate you on the actual markets. What are these markets? What do they consist of? How do like when I actually buy a currency, am I actually owning it? Like, do I actually Buy the euro? Does that mean that I own the euro? If I actually were to buy gold, does that mean that I actually own gold? If I were to trade the NASDAQ, do I actually own a piece of a company? So, let me break down these actual markets
and what they consist of, right? So right here we're going to have all of the main markets that are going to run the trading industry or the trading niche. And these are in order. The first market is going to be the foreign Exchange market also known as the forex market where every single day it moves anywhere from 7.5 to 8 trillion on a daily basis. This is not only the largest market in the world but is actually decentralized and it is open 245. Now when I started trading in 2018 2019 I remember reading this exact
same sentence right here and it was anywhere from five to $6.5 trillion. The fact that in just five six years this has nearly almost added $3 trillion into Trading volume is absolutely absurd to me. This just shows the amount of opportunity that is inside of the foreign exchange market. So the beauty of this market is that it is available 245. You can pretty much trade it whenever you want throughout the week. And that is the beauty of the foreign exchange market. It is the most volatile market, has the most opportunity in it, and it is
available the most out of any single market. Next is going to be the Stock market, which you've all heard of the New York Stock Exchange. That's where people would trade on the trading floor. And this is where the global stock market trade. And it's anywhere from 200 billion to 300 billion on a daily amount. So you can realize the magnitude and the size of the foreign exchange market. It is nearly 15 times bigger, 20 times bigger on a daily basis because you're trading every single currency in the world. Right here in the Global stock market,
you're pretty much just trading around the US, mainly around the NASDAQ and all of these other different USA companies. Next we have the commodity market which is going to consist of futures, oil, gold, wheat and the daily volume from this can vary in a couple of billion dollars but it's around a hundred billion on a daily basis. Now when you go trade the commodities markets when you go let's say you're going to go buy gold for Example doesn't mean you actually are going to own a piece of gold. You're just betting you're basically betting with
the markets that gold is going to go up in price. That's pretty much it. When you go buy oil or you go sell oil, at no point are you actually owning any oil. It's all digital currency. It's all money on the screen. They're basically making an educated bet if this market is going to go up or it's going to go down. At no point do you ever own anything When trading any of these markets except the cryptocurrency markets. The cryptocurrency market has an average volume of 100 to 200 billion in day trading volume, but it
is extremely volatile and is mainly controlled by Bitcoin and Ethereum and a couple couple of other stable coins. Now, obviously the problem with cryptocurrency is there's, you know, no centralization around it. It's completely decentralized, very much how it is when It comes to the foreign exchange market. But these currencies are backed by countries. They've been backed by hundreds of years. The crypto market is still fairly new. It's been around for, let's call it, 20 years at the max, 25 years. And it's something that is completely decentralized. And when you actually trade a cryptocurrency, let's trade,
say you're trading Bitcoin, Bitcoin, you actually own it. If you trade Bitcoin and it goes up, you make Money with it. If you trade Ethereum and it goes down, you lose money with it. Same very similar how it works with the foreign exchange market. But when you're trading the foreign exchange market, at no given point, you actually own some of the actual currency. I can say I'm trading EuroUSD. At no point do I actually own Euro or do I own USD? So all of these I'm going to go into great detail of how you can
actually trade them, which ones you should be trading, Which you shouldn't be trading, and how you can actually build a profitable strategy to actually trade on these markets. These are going to be the main markets that are going to be out in the markets and that you should have any interest in trading them. Any markets inside of these, they simply don't have enough trading volume. And if they don't have enough volume, which is big numbers like this, the odds of you becoming a profitable trader are much more Difficult because lack of volatility means lack of
opportunity. You want to make sure that you are in a market that has a fair amount of volatility, not too much because then you're prone to getting major losses and all of that. I'll explain later into the video as well. But you want to make sure that you have a decent amount of volatility so you can have good opportunity to actually make money when it comes to trading. But I personally have been Trading the foreign exchange market for the last 7 years successfully and lately I've been dabbling a little bit with commodities and I just
have been investing into crypto when it comes to long-term. This is my form of an asset. I would much rather put multiple six figures into a digital currency where it can make me 20 30% annually compared to putting it into real estate where let's say it can make me those same returns but I have to deal with less headache. I've never personally traded the stock market just because I am not interested in trading in a market that does not have anywhere near as much volume or availability as the foreign exchange market. I've traded the NASDAQ.
I've traded the S&P 500 and all of these other stock markets. And you can also do that in the foreign exchange market. And all of that we're going to be breaking that into this video. And we're going to be actually taking a trade together. You're going to be able to pause the video, look at the profits or losses on your actual end. And then you're going to be able to have an clear understanding of how to actually do this for yourself. And now before we get right started into what is actually trading, I want to
bust every single myth that is out there online. All of the myths that my parents thought that this was that even including myself thought this was or just the people that Have an opinion on something that they're just simply not educated on. And there's nothing wrong with having an opinion, but it's always good to get educated on it. So I'm going to bust every single myth on what trading isn't. Trading isn't a Ponzi scheme. There is Ponzi schemes out there on people creating systems around trading. That is entirely true. But trading itself is not a
Ponzi scheme. Like people are just essentially betting that something is Going to go up in value or that it's going to go down in value. If it goes up in value, people make money. If it goes down in value, people lose money. That is what trading is. So no, it's not a Ponzi scheme. Also, in order for you to actually become a trader, you don't need to be a mathematician. You don't need to go to college. You don't need to get a degree. You don't need to be a genius. To be fair, I graduated high
school with nearly a 1.7 GPA, I think it was, or a 2.0 GPA. I can't even remember what it was. I barely passed high school. I failed at college. I was not the smartest kid in class. But what I did do was show up every single day to try and figure this out. I had a driving mindset that was going to lead me to success. But I did not know what was the root square of 75 when a car is driving at 50 miles an hour and x equals 5. I have no idea to this
day what that is and I don't need to and I've had two Bugatti. So I think I've done very well. Trading is not something that you need to have habits for. You don't need to wake up every single day and meditate. You don't need to wake up and light up a candle, read a book, set a certain light, all of that Instagram, Tik Tok stuff. That is not real. You do not need any of these morning routines in order for you to become a successful trader and understand how to read the markets. I can be
looking at the markets in front Of my computer. I can be looking at it on my phone about to board onto a flight. I can be looking at it while I'm driving, while I'm at the beach, while I'm doing anything. All I need is a screen and decent amount of internet and I'm able to go ahead and look at the markets. You don't need to set up a whole entire ambiance around me to actually read and understand the markets. If you know how to read it, you know how to read it. And trading isn't Also
something that a lot of people think like, oh, we're going to wait for price to come all the way to the bottom, so we buy. We're going to sell all the way at the top. We do not try and predict tops or bottoms. Actually, on the complete contrary, I want the market to be moving up very aggressively and I want to buy with that market. The trend is your friend. I've had that quote on my desk, I think, for seven years. The trend is your friend. I am not here to Create a trend. I'm not
here to break a trend. I'm here to trade with the trend. What do you think is easier? To swim against the current or with it? And here in trading, we are here to swim with the current. At no point are we ever trying to predict something when it hits all the way at the bottom and then we buy or something when it hits all the way at the top and then we sell. We trade with the trends. And another one of the biggest misconceptions that people have Is that they think that they need to be
in front of the markets all day in order for them to actually read the market and become a profitable trader. Do you need to be in front of the markets for a long period of time for you to actually understand how the markets move? Yes. But once you get it, you don't need to be in front of the markets every single day. Another one of the biggest misconceptions that traders have or people in general when they get started Into trading is that you need to be in front of the markets all day every single day
in order for you to be a trader and a profitable trader. That is that cannot be further from the truth. The less amount of time that you spend in front of the markets, the more amount of money that you're going to make. It's very counterintuitive because at the beginning you actually need to spend a lot of time so you can learn and practice it. But once you understand the Skill set, then you don't need to be in front of the markets all day every single day. It's like when you're going to go learn a language,
let's say you're going to learn Chinese, for example, it's your first time learning Chinese. Are you going to have to spend more time than the regular person that wants to learn Chinese in the class? Yes, you're going to have to spend more time. But after you learning Chinese and being in the class for an extra hour every single Day for the last six months, it gets to the point where you no longer have to be in class for you to understand Chinese and to perfect it. You could be listening to some music. You could be
interacting with people on the street. That is where you practice it and you perfect it. And then you don't need to speak Chinese every single day in order for you to master and perfect it. You just need to make it part of your normal routine and it just becomes second Nature. Once you learn it, you're not going to unlearn it. It's the exact same thing with trading. Once you learn it, you don't need to be in front of the markets every single day to trade. You only trade when it's time to trade. And by far
probably the most important one. People think you need money to make money in trading. And I'm going to answer this. The answer is true. You do need money to make money. But you don't need a lot of money to get involved into Trading and make a decent amount of money. You can get started with a couple hundred bucks, maybe a couple thousand bucks, and that is going to lead you to have returns equally to what you invest. It it is all based off of risk-to-reward. If you risk a hundred bucks, you're going to make a
couple hundred bucks. If you risk a couple thousand bucks, you're going to make a couple thousand bucks. You're not going to turn a one singlehandedly $100 bill Or a couple hundred dollar bills into a quantion. That's not going to happen. Can you multiply it and scale it over time with proper risk management? Yes. But you don't need a large amount of money to get involved. And people have this conception as well as as soon as they put the money into the market, it's automatically gone. No, that is the complete like opposite. You actually predetermine how
much you want to risk of the capital that you put into trading Every single time. Let's say right now I go and deposit a h 100red bucks into the broker that I'm going to be using. That doesn't mean that that 100 bucks is invested right away. That just means that the money is inside of a platform that then I can go and execute one of these positions on. Now, before I execute that position, I'm going to pre-calculate my risk on my $100. I only feel comfortable risking $10 on this trade. That's all I'm going to
lose. And I'm going to be teaching you guys on how to do that throughout this whole entire video. But I want to make it extremely clear what trading is not. Okay. So, now that you understand that there is different types of markets out there. You have the currency market, commodity, stocks, you have crypto. There is many different types of traders that executes on these type of markets. For example, we can have what is called a positions trader, which these are also known as Whales, which these traders happen to take anywhere from one to two positions
a month. These are people that have large sums of monies and they're realistically not interested in being active every single day or every single week. So now moving on, now that you understand that there's many different markets out there, you have the foreign exchange, the stocks, the crypto, all of these different markets. There's different types of ways of trading these Markets and there's many different types of traders that execute these markets. Now, you can trade these markets as if you were to be a position trader, a swing trader, day trader or a scalper. You can
be any one of these traders and execute this style of trading on any one of those markets. For example, if you were to be a position trader, these are also considered whales because they are risking large sums of money either once or twice a month on certain positions That they take. They aim to have anywhere from two to three to 4% a month realistically with minimal effort, minimal activity, and just large sums of money. These large sums of money are this is why they're called whales and position trading, but this is more for kind of
institution style and people that aren't really active in front of the markets every single day. Can you make money as a position trader? Of course. But it does require large sums Of money because you're looking to target bigger trades. So, you're going to have very, very, very big take profits, very, very, very big stop- losses. I've attempted this style of trading in the past. It's just very expensive because you have to risk large amounts of money because you get charged every single time you hold a position. And I'm going to get into all that stuff
later into the video, but this is a future way of I think everybody will Eventually become a trader of as you progress throughout this whole entire chain. Next, we have a swing trader. So, a swing trader is somebody that anywhere that takes anywhere from four to five positions a month. And these positions that they take are not as big as the positions traders, but they are decently big trades. And these trades happen to have the best risk-to-reward out of any one of the traders. The swing traders are the ones that look on the higher Time
frames but still incorporate the lower time frames to have entries and have great risk-to-rewards. I personally myself am a mix or a hybrid of a swing trader and a day trader. And this has led me to be able to have the sniper entries of a day trader and the takeprofits and the great risk-to-rewards and the big big big trades because of the swing trading approach. So a swing trader takes anywhere from four or five trades a Month. The trades that they take are very sniper, very accurate, and they tend to be probably the more patient
traders next to the position trade. Next to that, we have a day trader. So day trader are somebody that are obviously most commonly known in the trade industry. We all know trading because of day trading. You trade every single day, but that doesn't mean that you're actually trading every single day, but you're more or less looking to be active Either two to three times a week on a market. Really depends the types of opportunities that you get. Because typically, if you were to enter a trade today, it should hit your take profit today. Maybe it
can overlap into tomorrow. That's where you take anywhere from two to three, maybe even four trades a week on the higher end. Day traders tend to have anywhere from a 40 to 50% win rate, but obviously they're taking a lot of positions and the Risk-to-reward isn't as high. A swing trader's win rate tends to be anywhere from 60 to 65% because they're taking less trades, which the quality means that they're much better. And then a swing trader's win rate tends to be anywhere from 70 to 65% but their risk-to-reward tends to be even greater than
that. Last but not least, or like I would like to say definitely least is going to be a scalper. Scalp trading is probably what every single person thinks That they are when they come into trading because people think that the more amount of positions that you are in, the more money that you will make and that cannot be further from the truth. A scalper is somebody that tries to take two to three trades every single day, a trade every single day. And that actually overexposes yourself and puts you at more risk because the more you
get involved into the market, the more risk you are in. The more you're Actually trading, the more odds you have of losing. The less you trade, the less likely you are to lose. So then you might ask me, "Wait, Alex, so then how do you actually make money if you're not involved?" You make money by entering the right trade at the right spot, and you let it ride. You make money while the market moves. You don't make money by getting involved into the market. Two very very big like they're two completely different things. And the
Quicker you understand that, the quicker you're going to make money in trade. You don't make money in trading by getting involved. You make money in trading by getting involved at the right time at the right place and let the market move. Let the market do its thing. Let it create the market structure. Let it go up. Let it go down. Whatever you're doing with it, and that's when you make the money. every single time you enter a position, you're adding more risk to Your account, which in turn can end up to you losing. Yes, it
could also mean that you can make money, but nowhere near as if you were to enter one solid position and you let it run. If this doesn't make sense right now, don't worry. It's all going to click throughout this video. Right now, I just want you to have a deep understanding of the different types of traders that there is out there. My personal favorite is going to be a day trader or a swing Trader and then the happy medium right in the middle. Everybody starts off as a scalp trader because they want to enter a
bunch of positions thinking they're going to make more money, but then they end up developing and growing as a person and become a day trader. These are the main types of traders that go and execute on either the foreign exchange market, the stock market, or the crypto market. Okay. So, now that you understand that what type of markets You're going to be trading, the type of trader that you can be on this market, let's actually start breaking down the exact markets that you are going to be trading. We'll figure out what type of trader you
are later in this journey and see which one makes the most sense for you. But the most important thing that you understand is what type of markets you're going to be trading. So, we're going to be breaking down the foreign exchange markets. This is the most Volatile markets, the markets with the most amount of opportunity and gives you the most possibility to make the most amount of money. So, we're going to be breaking down a forex pair, a currency pair, a market that is consisted of currency, right? So, as you can tell, all of these
markets here to my right hand side, they're all different types of currency markets. The USD versus the CAD, the pound versus the Canadian, the Australian versus the Canadian. And Don't worry, I'm going to teach you how to set up this whole trading view, all of this Chinese that you think this is this is a new language to you. Don't worry, I'm going to help you set all of this up. But, we're going to first start off by breaking down what is a currency pair and how does this even work? Well, in order for you to
trade the foreign exchange market, you have to trade one currency against the other. You're basically betting that one is going to Get stronger than the other or that that one's going to get weaker than the other, which enhances the same exact thing. If something gets stronger, that means the other gets weaker. It's very simple. So, all we are doing when we are trading a currency market is we are betting that something is either going to go up or betting that something is going to go down. At no given point, if I'm trading the EuroUSD, for
example, which is this market that we have here, At no point am I ever actually owning any actual euro, or am I actually ever selling the dollar against the euro or buying the euro against the dollar? If I'm trading the Canadian dollar versus the pound, at no point do I actually own any physical Canadian dollars or do I have any British pounds at no given point. All I am doing is I am betting that one is going to get stronger than the other. So how does this betting work you may ask? Well, it's very simple.
This is a currency pair. It's made up of two different currencies. The first currency is going to be the base. So this is the base currency of the pair. Then we have the quote currency which is the other currency pair. These two markets are constantly in a battle. Who is stronger than the other? If this market decides to continue to go to the upside and it starts creating market structure like this to the upside that means that the euro is stronger than the Dollar. If this market is then moving to the downside like this then
that means that the dollar is stronger than the euro. Now how would I know that? How does that make sense? Well, it's very simple because this base currency is what's going to drive the price up. If we are currently at a with a very strong euro market and the euro is very very very strong that is going to mean that it's stronger than the dollar and it's going to push price to the upside. If The dollar is going to become strong then that means that it's going to be stronger than the euro and it's going
to push price to the downside. So this quote currency the best way to understand it is if it's getting strong you want the market to go down. If this base currency is getting strong, you want this market to then go up. Now, I wanted to be very clear. When you want this market to be strong, when you want the euro to go to the upside, you want To buy this market. You're going to buy eurousd. Once again, you're not buying any euros. You're essentially just betting that the euro is going to get stronger than the
dollar for a period of time, whether that be a couple of hours, a day, a week, a month, whatever the case is. But then if you want to sell EuroUSD, at no given point are you actually selling the dollar? You're just betting that the dollar is going to get stronger than the euro. So are they both Equally as important? Can they both have equally the same amount of moves? Absolutely. Just because a market is going up doesn't mean that that's going to be more probable or stronger than a market that is going down. Remember this
market going down doesn't mean that the dollar is getting weak. it actually means that it's going to be getting stronger against the euro. So whenever you are selling EuroUSD or selling any market, you're basically betting that This market is indeed getting stronger than this one. It really comes down to the way it represents in this battle well or in any battle. If somebody is winning, that means that they are standing up and fighting and if somebody is losing, they fall down to the floor. Well, in this market, it's actually the complete opposite because this fight
never ends. This fight is a forevergoing market between the dollar and the euro. Markets going up, markets going down. And whenever the markets are going up, that means that the euro is winning the fight. Whenever the markets are going down, that means that the dollar is winning the fight. But at no point does a fight ever end, the fight is always going to go on as long as we have both of these currencies. So whenever the fight is going down, that means that the dollar is getting strong, the euro is getting weak. Whenever the fight
decides to continue to go back up, that means That then the euro is going to be getting stronger against the euro. That's really what it comes down to. These are two fighters fighting up and down. And then whenever they're going in one direction, that means they're getting strong. Now, what are these numbers right here, right? What is this numbers that keep going up and down? Well, this is actually probably the most important thing that you need to understand what it is, but you're never Going to actually use it because you don't really care what the
actual exchange rate. So these numbers right here are the exchange rate of the actual currency pair. And as you can see it right here on the live market. That's why it's 1.17. So $17 is going to equal 1o. That is really all that this is right here. So this just lets you know where the market is in terms of price. And these numbers going Up and down is what's going to lead you to determine whether okay, I want to buy or I want to sell. But at no point are you ever actually going to be
looking at these numbers. These numbers just reflect what the actual charts are going to be doing. When we go to the candlestick charts, these charts will just reflect on this price right here. This price is going to reflect on these charts. So, this right here is what a currency pair is. It's a battle of both Of these markets 245 for the rest of history. And whenever one is going up, that one's winning. And whenever this one's going down, this one is winning. There is endless amounts of currency pairs out there. I personally trade myself 15
to 20 different ones because there's just more opportunity on the more markets that you trade. And there is more volatile currency pairs. And then there is less volatile currency pairs. Obviously currency pairs that are Less commonly known. Let's say like the noggin, the Mexican peso that don't tend to have as much volume compared to the US dollar, to the euro, or to the British pound. They're going to be a lot less volatile. Can you still trade them? Can there still be loads of opportunities? Of course. But the odds of you making big moves on those
markets are very unlikely. Can you still do it? Yes. And I'm going to be educating you how to properly do that as we continue To go on throughout this video. I just first want to teach you exactly what a currency pair is and how it works because this right here is what you will be trading 245. And you need to understand exactly what you are doing whenever you are trading these type of markets. And these right here are going to be known as the major currency pairs. You're going to have your euro versus the dollar,
the pound versus the dollar, the dollar versus the Japanese yen, the Dollar versus the Swiss Frank, the dollar versus the Canadian dollar, the Australian versus the dollar, and the New Zealand versus the dollar. If you can see a pattern here, they're always going to have the dollar in it. The dollar is obviously the one that is the most respected, the most valued currency in the market. It is the simple fact and it is always going to be used against the next main currency pair. Now, some people sometimes ask, why isn't it USD Versus euro? And
this is just the way the market's set up. I don't have the answer to that question. Is there any point where they're actually flipped over? I'm going to be completely honest. No, I have never even considered that. But even if it were to get flipped over, let's say it's the USD versus the euro, it's still the exact same thing. It's just this time instead of the dollar reflecting its strength while going down, it's going to reflect its strength While going up. Same thing for the euro. So, everything remains exactly the same. This is just the
way that the currency market has set it up. So these are the main currency pairs that you should be trading. And the reason why you should be trading these currency pairs is because one, there's a lot of volatility in it. Meaning that it is indeed going to give you lots of opportunities. Two, since there is a lot of volatility, that means that there the cost to operate in These markets are going to be very low because people are moving constant funds inside of these pairs. So the cost to get involved is not that high. And
on top of that, these tend to also be the trades that have the best moves in the right sessions. And three, these are the markets that tend to have the best moves. Now, when I mean the best moves, I mean that they actually have proper moves because other currency markets that aren't as volatile or aren't as Respected in the market. They tend to have the most random moves, moves that cost people a lot of money and it tends them to lose. Now, I'm not saying you shouldn't trade uh any other markets that are not these,
but I'm saying that these markets tend to have the most respected moves. They don't tend to have these major spikes. They don't tend to have these unnecessary fees which end up potentially taking you out of your stop loss when price didn't really make it There. These are all a bit more advanced stuff and we'll get to that throughout this whole entire video. And I trade these other markets all the time. I trade the most random markets. You know, I'll trade the Canadian dollar versus the Japanese yen and find great opportunities there. But I just have
to understand it a risk associated with trading in those currency pairs. This right here are going to be the major currency pairs and the ones that tend to Have the best price to actually trade cost less and have the best moves. So we'll break these down with the actual strategy and how to actually trade it later into this video. Okay, so now moving on to the next subject. Now that you understand what a actual currency pair is and you understand that they're in a constant battle up and down and that there is a neverending on
this fight and there's never a winner. There's just some streaks where one Currency is winning and there's another streak where another currency pair is winning. Now you now you have to understand that this battle this fight has to be reflected based off of something like we have to see the trail of this fight. When a currency pair is going up, it leaves a trail. When a currency pair is going down, it leaves a trail. Now we need somewhere to show us this fight. Now this fight could be shown in many different formats. You can See
this fight either in a line chart formation. You can see that the euro for example is getting stronger then the dollar gets stronger then the euro gets stronger again. So this is the line chart that is representing how this fight is going. You can also have this famous bar chart which the bar chart shows whenever it's green that the euro is getting strong. Whenever the red bar comes out that means the dollar is getting strong. So on and so forth. Then We have the candlestick chart which is the most commonly known in the trading industry
which is where you have the green and red candles and that is the representation of the fight. So there's many different types of charts and all of these charts are representing the exact same price. This right here is Euro USD. This is Euro USD and this is Euro USD. It's just representing the fights in a different format. The best analogy that I can give you for this is For example, let's say Mike Tyson and Floyd Mayweather are going to be fighting. Now, you can either watch the fight in person or you can watch the fight
on TV or you can hear the fight over the radio or you can simply hear the fight over a headphone. Right? You're hearing, watching, you're getting the exact same feedback on the exact same fight at the exact same point. every single point, whether it's on TV, whether it's in person, whether it's in Radio, whether you're just listening to it, you're going to be hearing the same exact thing. Oh, Mike Tyson at this point was beating and knocked down Floyd Mayweather. Floyd Mayweather came back up, hit him with an uppercut, but then Mike Tyson knocked him
out. Whether you are hearing that, whether you are seeing that, whether you are just listening to it, all of these are the exact same information of the battle of the currency pair up and down just being Represented in different ways. That's really all it is. And the most commonly known one is going to be the actual candlestick chart. The candlestick chart is where you're going to actually be able to trade off of the famous Japanese candlesticks and actually see patterns that constantly repeat themselves in a very effective way. These are going to be the markets
that I'm going to be educating you guys on on how to properly execute these trades and actually trade In these markets. The bar chart is not mainly commonly known for traders. This is used for a different type of style which I'm not entirely sure how it works. So, I can explain something I'm not simply educated on. And if up to this point right now in my trading journey, I have literally not used it one single time. I feel like it's not necessary. I saw maybe 15 videos of this when I got started in my trading
journey. None of them ever made sense. And I just simply wasted time and clouded my mind with information that I was simply never going to use and was not going to be effective in my trading style at all. So then I wasted time and not giving focus on to what actually mattered, which was the candlestick chart. That's what I'm going to do for you guys in this video. Tell you guys a little bit of what everything is. literally only focus on what matters and can remove the noise of what doesn't Matter. Next, we have the
line chart, which is equally important because this is going to lead you to understand the proper market structure on the time frame or on the market that you're going to be interested in. Have an understanding that this right here is like watching the real fight in real time. These candlesticks, these wicks, these moves down, this is like you're watching the fight in person. and you're getting the sweat that is falling on You. If you're sitting first row, you're hearing the roar of the audience. Like, you're getting everything as real, as raw as it gets. No
commercials. Everything is on the spot. Think of the line chart as if you were to be watching the fight on TV. And you might be asking why. Well, it's because this only creates these structure points once the market has actually closed. Once a candlestick has closed, the next one has opened. Like, this doesn't really Represent a move until it is completely done. I'm going to be breaking all that down in just a second, but think of this as the next step. So, first you have the live, which is real raw fight. This is happening in
real time. And then this you get commercials. Maybe you have maybe it might have a 15 20 second delay just because of the way it gets transmitted. But then after that, there is nothing else that is going to be important. We're not going to be using No bar charts and we're not going to be using the scatter plot. Neither one of these are going to be useful. They're just a different way on how to represent the fight. I am not educated on it at all. I just wanted to show you different representations of how the
candlestick chart looks compared to the line chart. So, now that you understand that the only two types of charts that you're going to be focusing on is going to be the line chart and the candlestick Chart, let me actually just show you guys how this looks like in real time, right? So, let me just remove this right here and let's actually go to the real markets. So, right now, for example, let's say we go to EuroUSD. So, we're going to type EuroUSD here on Trading View, and we're just going to go to a random EuroUSD
market. Now, don't worry if you don't know how to use Trading View just yet. I'm going to help you set all that up, but I first want to educate You on how the charts work. So, we were to click this section up here, you can tell that we have our bar charts, we have our candlestick line charts, we have our hollows. There's many different ways on how you can determine whether this market is going to get stronger or weaker with all of these different types of formations. So, now that you understand that, basically the difference
between the line chart, the bar chart, and the candlestick chart is Really just how the fight in between the currency pair is represented. Let me show you this in a realtime chart. Right? So, for now, we're just going to move this down, and we're going to head over to the top section over here of Trading View, and I'm going to show you the multiple different ways on how you can actually look at this fight. Now, don't worry. Later into the video, I'm going to show you how to set up Trading View, which one of these
options should You actually be looking at, cuz I get it. This can almost seem like information overload, but I'd tell you that maybe 50% of the buttons on this website you're never going to use, and the other half of it are very simple to use, right? So, let's start off with the bar chart. So right now we are looking at BTC or we can be looking at EuroUSD or we can looking at any single chart right. So for us right now since we're using Euro USD as the example let's go To EuroUSD and as you
can tell there's many different Eurusds. You have some on FXCM on GBEN Forex.com Kraken. Probably wondering what's the difference between this EuroUSD and this one. And the only difference between this EuroUSD and this one is that it's on a different server. So this is the FXEM server. So this is a broker and this broker gets certain data feeds and it offers Euro USD at a different price. It's the exact same Market. It's just offered maybe a couple of points higher, couple of points lower. It's really the only difference. But for example purposes, we're going to
go to this one, right? It's all going to be the same thing. So right now, this is what EuroUSD looks like on the actual bar chart. So, if you notice, whether it's on a bar chart, whether it's on a line chart, whether it's on a candlestick chart, you're always going to have the price be at the exact same Point, 1.17301. Now, that is on the ICE server. If we were to go to a different server, which let me just type it in right here. So, we have 1.1301. Let's say we go to capital.com, we have
it at 1.1303. The exact same chart. It's just points are minorly up or down. And the chart might look slightly different. Something that you probably like barely even notice. Just going to have little more Structure points here, less structure points here. The one that I personally use is always going to be the server. So for me, the server is the most accurate. It's based off of one of the main US regulated brokers in the US and it's the one that I personally use for simple I guess you can almost call it like a superstition reason,
but I've never really used any other one. I'm sure I can use any other one. They are all pretty much the same. The points are off Not much. So, back to the line charts, back to how these different type of markets work. We'll get into all of this different broker stuff, different markets, liquidities, and and how this stuff works once we get to that point. Right now I just want to explain to you the basic points charts, right? So this is a line chart. So this line chart right here is exactly what the fight looks
like in between euro and the US dollar on the line chart. This is what The fight looks like on the euro versus the US dollar on the bar chart. This is what the fight looks like on the euro versus the US dollar on the line chart with markers. If you were to look at the area, if you were to look at the columns, if you were to look at the high low, you were to look at the volume footprint. I guess I don't have this option, but if you were to look at any other one,
that is exactly how it looks. This right here is literally the exact Same market movement. It's just the fight is being represented in different ways. the most accurate way and the cleanest way to look at the market and actually be able to develop a actual strategy and be able to predict patterns based off of how I've been doing it for the last 7 years and I've been teaching people to do it is based off of the candlestick. So we come over here to the trading view and the candlestick is going to be the next one,
the Candlestick chart. Now, I have a specific indicator which is called a no gap candlesticks which is very easy to apply and I'll show you guys how to apply it right now just so you can do it once we get to that point. But it'll be very easy. All you have to do is just go to indicators, type in no gap candlesticks, and I'm kind of getting a little bit ahead of myself here, but we'll we'll just do it for now. You click on the no gap candlesticks, and Then once you click on it, it
basically pops up. And that's how you would implement the no gap candlesticks. Aside from that, I'll teach you how to actually adjust it because right now you're probably having an overlap with your actual candlesticks. And you know, I'll teach you how to do that just a second later into the video cuz I want to get into the indicators and I also want to explain to you how this EMA works, why I use this EMA, which one is My EMA, so on and so forth. So the candlestick charts are basically consisted of multiple different time frames
based off of these candlesticks. As you can tell over here next to the type of candlesticks that I have, these candlesticks are being represented in different time frames. For example, right now we are on the 4hour time frame, meaning this candle right here closes every 4 hours. So this candlestick right here, the way it's Being closed right now, has about 38 minutes left. Meaning it has been open for 3 hours and 20 minutes nearly. This candlestick closed 4 hours ago, 4 hours ago, and 4 hours ago. This is what this market looks like based off
of this 4hour time frame. If we were to go to the two-hour time frame for example, this happens to be a candlestick once again that is closes every 2 hours. So every single one of these candlesticks is 2 hours. This candlestick right here Is the 1 hour closes as well in 38 minutes. All because the market closes in the next 40 minutes. So a lot of these candlesticks are going to be closing at the same time. Next on the 30 minute, this candlestick has 12 minutes left before this one closes. Every single one of these
candlesticks is a 30 minute candle. Then we have the 15-minut time frame, which this candle closes in the next 12 minutes as well. All we have just done here from the 4 hour or if we Go up to the daily or we go up to the weekly is we are just looking at the fight from different points in the arena. So let's say you're actually in the fight, right? So, we understand that there's different ways for you to watch the fight. You have watching the fight in person, which would be the candlestick chart. You have
the line chart, which is like watching it on TV. And then you have the bar chart, which is like listening to it on the radio or Having some headphones on. Right? These are all the different formats for you to actually watch the fight. Now, we've decided that we're going to watch the fight in person because it's obviously the best one. You're there in real time. You get real updates and you're there live. There's nothing like being at a live fight. Now, where are you sitting in that live fight? Are you right there front row? Are
you in the middle? Are you a bit higher on the stands? Or are You in the nosebleleeds? Which one are you? That's exactly what these time frames are right here. The higher the time frame, the higher you're going to be in the arena. The lower the time frame, the closer you are going to be to the ring. And you can get all the way as low to 1 second. Meaning you can go to the one second time frame and you can literally see every single candlestick that closes every second. I don't have that feature unlocked
here on Trading View simply because I don't use that feature. The lowest time frame I go is the 15. But with the feature that I have, you can go all the way up to the one minute, meaning every single minute a candlestick closes and you're going to be seeing every single one of those details. Believe me, you're never going to want to be this low into the time frames. It's just way too detailed. You can never actually see anything. And this right here is just a quick Representation to give you a visual of what I'm
talking about. So, we've decided that we're going to go watch the fight in person. Now, there's many different places we could be sitting. We could be at the skyscrapers, which is going to be like the weekly time frame. We could be here in this middle area, which this is going to be the daily time frame. Then, we can have this outer area, which this could be the 4 hour. This area could be the 2hour. This area Could be the 1 hour. And then this area up over here can be the 30 minutes. And this can
be the 15 minutes. Speaking from personal experience, the best area to actually be sitting on these fights is going to be the weekly time frame. Now, you may be asking, Alex, why that's super far? Well, because from up here, you can actually see the fight. You're actually looking from the top down. The closer you actually get to the arena, you're looking at it more of a Horizontal way. And I don't know about you guys, but I wasn't blessed to be the tallest guy in the room, right? I'm not super short. I'm 5'9, 510. At these
fights, everybody happens to be giants and everybody likes to stand in this area here. So, if everybody's standing and they're taller than me, I can't see the fight. And the fight is on a platform. And since the fight's on a platform, guess what? Not only can I not see because there's somebody big on top Of like right in front of me, but then the fight is also elevated. So, you're almost looking up. And if the people were to fall, for example, on this side, I can't see them at all. Like, you're just not seeing them.
you have to be looking up directly to the screen to see what's happening. So, the point that I want to get to this is don't think the more detailed you can see stuff and because something closes every single minute or every single second that it's Better because you get to see more details. That's actually completely false. You want to make sure that you can be watching in from above and you can see everything from a higher standpoint and you can almost see stuff coming because you're watching everything as it unfolds. So, this is how going
through the candlestick formats is right. So, we're looking at the exact same price, right? So, if you notice right here, this is EuroUSD. On The daily time frame, it's 1.1314. If we go down to the 4 hour, it's the same 1.1314. Obviously, the market's moving right now, so it's going to fluctuate one of these two points. But if I go down to the 2 hour, 1 hour, and the 30 minute quickly, you can see that it's all the exact same price feed. You're just looking at it in a much more detailed format. It's just being
represented in a more detailed. So this 4hour candlestick Right here that we are looking at, it's being broken down into two candlesticks when we go to the 2-hour time frame. So now it's going to be these two candlesticks right here. Now these two candlesticks are going to be broken down into another candlesticks once we go down to the 1 hour. Now these candlesticks right here, this 1 hour candlestick is going to be broken down to then another 30 minute candlestick once we go down to the 30 minute. So on And so forth. So, what I'm
trying to get you to understand here is that when you're looking at the candlesticks, because you go from this time frame to this time frame, doesn't mean you're looking at a completely different market. You're looking at a completely different format. No, you're looking at the exact same fight. You're looking at the exact same market, just in a much more detailed way. And sometimes having those details is good. Sometimes having Those details is bad. All that unfolds and it kind of comes together when you're actually executing a strategy and doing proper top- down analysis and executing
on the market. And I'm going to teach you guys how to do all that later into this video. Right now, I've just taught you what type of markets, how to break it down, and then the importance of understanding why these time frames are a thing. Right? So, that's only the beginning of these time Frames. Now, a lot of you guys may be asking, Alex, okay, cool. I get it. But how does the candlestick actually work? Like, what is this line up here? What is this line down here? Very simple. Picture, we can go down to
the one minute time frame to see this as real as it gets. Picture this market right here as this candlestick right now is about to close in the next two seconds. It's going to close right there. And now another one is going to open from where This one closed. As soon as this next candlestick opens from this one that closed, it's either going to go up or down, right? It's really not going to do anything else. Now, this market, as soon as it opened, it went up. Now, if this market in the next 42 seconds,
it decides to not move at all, it will close like that. and then another candlestick will open right next to it and it will either continue to go up or go down. But let's say right now that This market decides to have a push to the downside. There's going to be what is called a wick, which is that exactly right there once it actually had a little bit of a retracement, which will look like this. It's going to be a wick. That wick is basically representing where price has been. So, for example, right there, you
can tell price has been to that high point. So, if I were just to get a line right here, that is the highest point the body of that move has Been. And if this market decides to now have a reversal down and close to the downside, it will close with that wick. So, in the next 2 seconds, we're about to find out if it's going to close with that wick or not. And I believe it has closed with the wick. Right now, since we're headed towards the closure of market, market tends to move, you know,
pretty slow. There's just simply not a lot of volatility. But this next candlestick should be opening right now. And as soon as it opens, it's either going to continue going up or come down. And this candlestick will officially have been closed with that wick. And you can see that this next candlestick just opened super quick. Had a push to the downside. And now at one point it was down here. I just literally didn't manage to grab it because I was going back and forth on the time frames, but came down here. Then it went back
up. Now this next candlestick, this one has Closed here. This one opened, wicked up. Now it's wicking back down, wicking back up. So what this line is, what this tail is, what this hair wick, whatever, what the proper name is a wick. This right here is a wick, but many people have a lot of creative names for it. All this right here is just the history of where price has been. So right now this candlestick is currently creating that wick right now. It's currently creating that high created up to that point. And If it closes
right here, that is where the trail of the candlestick has been. This is the market showing us how the market is moving. Is it moving very aggressively to the upside? Is it rejecting this area? Because this wick right here is shown as a sign of a rejection. Clearly price was bullish or this candlestick was completely filled all the way up to this point. But something happened in the market that it pushed it down. In turn, that should Then mean that it should continue to be pushed down. For example, that closed with a small wick at
this area. So that means that the sellers aren't as strong, but now we have very strong sellers coming into this area. Now, for example, so let's say this market closes with the wick all the way down here and out. And you can see how this market can wow this is you know moving very aggressively but this is showing you guys how the markets can move how fast it can move even Though we are in the last couple of hours of the markets. This right here if it somehow reverses and it has a push to the
upside then this would have a very big wick right it could look something like this. But see this right here is continuously pushing down this market. And if wherever it closes this wick is doing the trail of where that market has been. Now that wick is equally as respected when it comes to the 1 minute time frame, 15-minut time frame, 1 hour Time frame, daily, 4 hour. These are all different types of wicks that are being created. So, as you can tell on the 1 minute time frame, that might have looked like a massive bearish
candlestick, but you look at it right here in the 4 hour and this 4 hour looks pretty much exactly the same from when we started talking about this subject a couple of minutes ago. So that's why the lower time frames it might seem like a very big wow move but in reality it Doesn't affect any of the higher time frames. Are the lower time frame used in order to determine a trade and do they go in sync with the higher time frames? Absolutely. But there's a way there's a time and a place to actually execute
that correctly. But if you can tell that one minute big bearish candlestick looks like it might have had this fall off a cliff. But then when you go look at it back to the 4 hour time frame, this literally looks exactly the same from When we actually started trading. But I just want you guys to understand what these wicks are. That means that the market at one point it was a completely bullish candlestick into this area and then something drove price all the way down and then it ended up closing here. Once it closed here,
this candlestick opened, had its move up and down, created that history. This is where this market closed. Then this one opened up, had its history, it closed, and then This is where this one opened up, had this push up, and as of right now, it's right here. And then next 24 minutes, this candlestick will close. And then another one will open and either have its push up or down or however it ends up closing. But once one candlestick closes, another one opens right next to it. And this will be the neverending battle of the market.
And our job as traders is to determine what that next move is going to be and let's us Capitalize off of that move because these market opportunities and these this battle is a never-ending battle. All right. So now moving on to the next subject. Now that you understand that the candlestick chart is like watching a fight. That is the way that it's being represented. And the closer you are to the arena which is the lower the time frame you are means the more precise you're watching the fight. The higher the time frame you are, the
higher you Are actually watching the time frame, but you're watching the exact same trade. You're watching the exact same market. You're watching the exact same fight. It's just being represented in a much more detailed format. Your USD, you could be watching on a daily, 1 hour, 30 minute. You're just looking at in a much more detailed format. And now you know what those wicks are and how the candlestick leaves those trails, so on and so forth, right? But I want to Explain to you now the actual trading sessions when it comes to the strength of
the time to actually be watching that fight. When is the right time to actually be there and be involved? Because if not cuz you know to be honest you can't really be involved 24/7 even if you wanted to because you're going to be there at times where there will simply be absolutely no volume where you're just going to waste your time and the people are going to be tired. Right? So, the best way I could put the analogy, and I love my analogy sometimes, but I feel like they're just too precise that I I I
forget to go back to trading. If people are fighting, there's going to get a point where they're going to get tired, right? And if they're tired and, you know, they're drinking water, they're stretching, they're eating food, you know, that's pretty boring, right? You want to see blood, you want to see somebody get Knocked out, you want to see somebody lose a tooth. That only happens at specific times. That's after they rested. That's after they're well eaten and they're actually ready to fight. And that only happens at specific times, right? That's that that's exactly what I'm
talking about in the market. Yes, you want the market to have these big massive moves to the upside, these big swings, and you want to catch these big trades, but that doesn't happen all the Time. Like the market gets tired. The market has movements at only specific times. So, these are the highest volume sessions and then these are the slowest volume sessions. So, we're going to start off with the Sydney session. So, we have Sydney session and Tokyo session. So this tends to happen around 5 to 6 7 8 9 10 11 12 EST. So
this is basically the afternoon. This is when people finish their 9 to5. This is all of the afternoon. And as you can tell, The lighter the color, the less the volume session. The darker the color, the more session there is. This right here is exactly when the fighters are taking a break. They're stretching. They're eating. They're cleaning up their sweat. They're closing up their wounds. They're taking a break. So, if you are in front of the arena at this time, you are simply watching nothing. Yeah, they're going to be there, you know, cleaning up one
another. They Might be talking smack back and forth, but they're not fighting. You're not going to see blood, right? Cuz there's no volume. You can be in front of the markets at this time. Yes, it's going to be moving. It's going to be creating little moves up and down like this, exactly how I just showed you, but you're not going to have those big swings. Why? Because there is no volume. There's no volume in Sydney session or Tokyo session. There is absolutely no Volatility there. Is there a oneoff moment where there could be a a
quick pump that happens there? Yes, that can be one in every 20 trading days. But are you going to be in front of the arena knowing that one out of 20 trading days one guy might just get up and sucker punch the other guy? Probably not, right? You don't want to bet your money on that. The odds of that happening are unlikely. Just whenever it happens, you'll watch the video and it pops up And then usually they'll go back to fighting in just a couple of hours. Is there going to be a time where you're
not looking at the markets in the session and it has a moves? Yeah, sure. But that's not that wasn't your time to be watching the market anyways. So, Sydney and Tokyo session are going to be the sessions that you are not going to be trading. You're not going to be interested at executing any trades. I use these time frames right here to go Do stuff with my life. I go and work out. I go and try and have a life that's not just staring at the charts. Beginning of pre-London session and then we have all
of London session. This is when the battle begins. This is where things start getting very, very, very, very rough. Now, I would argue that this chart is a bit inaccurate. I'd say this could be a little bit darker, maybe a little bit more this way. But this right here begins from 1 in the morning. So, At 1:00 in the morning, I start doing my pre-London analysis session because London session opens right at 3:00 in the morning. And pre-London, which is 1:00 a.m. to 2:00 a.m., there already starts to be some volatility and the market starts
to move very well. Then you obviously have all of London session, which lasts from 3:00 in the morning all the way up to around 12:00 p.m. EST. Now, there's something beautiful that happens inside of the Currency market at this point right here, and that is that the New York session happens to open up in the same time that the London session is ongoing. So, London session opens up at 8:00 in the morning, and it overlaps the London session, creating this extremely volatile point in the market. So I like to enter my trades either pre-London session
or during London session. So then the trade has good volatility. It starts going in my direction and then Once New York session kicks in, it just adds more fuel to the fire which ignites it even more and gives it more of a movement. And then typically right around the ending of London session, halfway through New York session, the market starts to slow down again and then things start to just not get any volatility. The market takes a break for a couple of hours and then the pattern repeats itself. This will repeat itself from Monday to
Friday every single day. Now the key point here that you need to understand is that there is realistically only a window that you need to be involved into the market. You can only get involved in the market from 1 in the morning all the way up to around 10:30 in the morning. And some of you guys may be asking, "But wait, Alex, there's still some volatility over here where the New York session and the London session overlap." It's like, yes, correct. Yes, there's still going to be Some fights going down here. It's still going to
be aggressive, but it's it's headed towards the end of that. And you don't want to enter a trade while it's being extremely volatile and then what ends up happening is that it slows down for the next 10 hours because at let's say you enter a trade at around noon, right? You're not going to be having any volatility for the next nearly 10 hours. 1 2 3 4 we have 10 11 12 11 hours. You're going to have absolutely no Volatility in your trade. Does it make sense to enter a trade that is not going to
have any movement for the next 11 hours? Not really. And you're going to pay an unnecessary fee once the market closes and then opens up again because every single day at 5:00 p.m. EST the market closes, it opens up literally for like 1 minute. And then what ends up happening is you have to pay a swap, you have to pay commission fees for holding trades overnight. And it just come not Only does it cost more money to do that, but then you just have trades that are going to be in the same point for the
next 11 hours. And there's nothing more that I hate than looking at my money do nothing, right? I either want my trade to hit my stop loss or hit my takeprofit right away. I don't want to be in the same exact point of the market just being still for the next 11 hours. So, you want to enter the trade either right before the session starts to kick in, Either right in the middle of London session, right before the real batter starts to kick in inside of that battle or right before it starts to drop off.
You can enter a trade anywhere 9 10 in the morning and then you can catch the ending of the overlap of London and New York session. Anything after 10 in the morning I have not taken a trade after that time. I can't even remember. I think it's been 4 years since I have taken a trade past 10:30 in the morning. Now once again is there going to be an example? is going to be a 1 out of 20, one out of 30 probability that the trade that you would have taken at, let's say, 12:00, it
actually ends up hitting your takerit by 8:00 p.m. Sure, of course, there's always going to be these one-off opportunities. But that is not how you build a sustainable, profitable strategy. That is a strategy that you follow time and time and time and time and time again. This is something that Is proven system that it simply just works. You get involved before the session kicks in either right in the the middle of it in the middle of the peak over the overlap or right before the ending session of that. This has led me to have my
biggest trade. I think I my biggest trade is like half a million dollars. This is what led me to be able to have that trade. This also led me to be able to avoid many losses. Because if you are only focused in trading about, Let's say, six to seven hours out of the whole entire trading day, you're really only focused on a very specific time right here. And I know this tends to be an issue because a lot of people tend to be at jobs anywhere from or either at jobs or sleeping from 1:00 in
the morning to about 10:00 in the morning. Like this is a crucial time right here. But I will tell you this, the sacrifice is definitely worth it to be involved in between these time frames right here. From 1 in the morning to 10 in the morning, EST is the most accurate times for you to be trading. Anything outside of this time frames right here, I could guarantee you, you will not have anywhere near as much volatility. It just simply does not happen. The two big banks are going to be closed and you're just not going
to have enough volume. And this is goes especially to the markets that have the US in it. any markets that have the dollar for example Let's trade let's say you're trading euro USD if the euro if the dollar is asleep and the banks are closed how do you expect for that to have any movement in this session over here so this goes specifically to those markets like GBPUSD eurousd anything that bols that involves the USD if the USD market is asleep or it is not open it's not going to have any volatility can you still
trade USD markets in the London session cuz technically the London session Hasn't opened. Yes, actually it's even better cuz let's say you trade EuroUSD or GBPUSD. You're trading the pound right when the market opens over there and then when New York session opens, you get double the volatility with the same exact currency pair. That right there is the golden ticket to having the perfect moves. Now, you obviously need to align that up with a strategy. You need to know what you're looking at in the charts. Just because it's 1 in the Morning, you can't just
click buy or click sell and expect to make money. Can you get lucky? Sure. But that's not once again how you have a sustainable income while you're trading. So to sum things up, yes, the markets are open 245 and technically you could go and execute a trade at any one at those hours. You can literally go and hit the buy or sell button at any time you want. But there is going to be a high chance that if you are not in the correct session that you One are going to pay unnecessary fees, and two,
you're going to be stuck in a volume that is going to simply have no movement. I want to make sure that I can enter a trade when there's going to be a lot of movement and the odds of my trade winning are going to be a lot higher. So, this right here is the currency market trading session. And this works for every single currency per hour there. Whether it is AUD, JPY, USD, JPY, Euro AUD, everything is always going to Fall inside of this trading session right here. That is going to be the session that
is going to create the best movements at any given point. And the key of it is so you know how to put that together with a profitable strategy. And I'm going to be teaching you that in the next couple of hours. All right. So now moving on to the next subject. Now that you understand that you actually need to be trading in a proper session and where you need to be in that fight, you got to Make sure you're there at the right times. But now you're probably asking, "All right, Alex, I get it. But
what do I need in order for me to actually go and execute a trade in these markets? What do I have to actually do so I place a bet on the fight? I think I got the potential fighter that I think is going to win for the next couple of rounds. What is the actual platforms that I can go and execute that buy position or that sell position? Well, it's actually very Simple. You realistically just need these three platforms right here. So, the first platform that you're going to need is going to be Trading View.
So, Trading View is what we've been on pretty much this whole entire time. Trading View is where the actual charts are going to be represented. Trading View is where you're going to analyze the charts and determine if you want to either buy or sell the market. Trading View is where you're going to do your Top down analysis, where you're going to mark up your charts. This is where you see all these traders with these fancy lines with you see them with these boxes. You see them with these wins and all of these losses. This is
where you're going to see traders with drawings and where they analyze their trades and have notes based off of what type of trade they're executing and where it meets their strategy. So once you've analyzed here on your actual Charts that you want to determine that you want to buy or sell a market, you then need to go to a broker. So, let's say right here you've been watching the fight for the last 5 minutes, 10 minutes, and you're like, you know what? I see Mike Tyson that he's strong. I see Floyd May that he's weak
or vice versa. And for you to go ahead and place that bet, you have to literally get up from the fight and you have to go to the betting station at these fights, you go Ahead and place your bet, and then you go back down and then you watch the fight. This is pretty much the exact same thing. So, on Trading View, you're analyzing your charts. you determine that you want to bet that the euro is going to get stronger than the dollar or that the dollar is going to get stronger than the euro. So,
you get out of trading view and then you are going to go to a broker. So, a broker is where you're going to go ahead and give them The money and then you're going to execute your trade uh based off of what you want to do. So, I recommend many different brokers. One of the brokers that I recommend is going to be LQ Markets. This broker accepts traders. They have a 1 to500 leverage. You can start off with small $10 deposit. They have many different types of accounts that you can go ahead and use with
them. And another just in case if you don't like LQ Markets for whatever reason. I Also recommend OneX Trade. This is another platform or another broker that I would recommend. Also, pretty cool features of them is that they have these lotsiz calculators. You can pre-calculate your risk on your positions here. And I'll explain all of that in just a second. But basically, once you were to deposit your funds into the broker, now can you actually go and execute the trade on the broker? The answer is no. You cannot. for you to go Ahead and execute
the position. The broker is going to then take that position into a marketplace. So this right here, what the broker does is like the middleman from the real marketplace. So there's a real marketplace slash liquidity and us as retail traders as we are, even including myself, whether it's my experience or how good of a trader I am, I am still a very small fish inside of this industry. So, what the broker is going to do is the broker is going to Take your funds and whenever you place a position, then they're going to go ahead
and then feed it to the real market because then the real market is going to then feed it back into the broker. So, what the broker is, it's like the middleman of the real markets. So, whatever you're seeing here in the markets, which is, let's say, 1.17312, they get that offered at a different price. Let's say they get it offered at 1.730. So, what the broker is going to do is they're going to charge you a spread. They're going to charge you a fee for them entering that position into the real market for you. And
that's the broker game. Some brokers charge you higher fees than others. That's why I have two of them cuz sometimes these fees range. Some of them charge fees for holding positions every single day because they are the ones that are going to go ahead and actually execute your Trade into the real market. And then based off of your results, whenever you decide to close your position, whether you win or lose, the market feeds it back to the broker. and then the broker feeds it right back to you. The broker is the middleman for you to
get access to the real markets. You cannot get access to the real markets without a broker unless you're a bank. And I right now have no possibility to be a bank. You need tens of millions of dollars for That. You need proper licensing. And truthfully, I rather pay the broker the couple bucks that it takes for them to connect my trade into the market. It makes things far easier. Now, you can't go ahead and execute the trade on the broker itself. The broker is like the bank. So, picture this right here as if it were
to be Chase Bank or as if it were to be Wells Fargo. Now, when you go send money from Chase Bank or whenever you go pay somebody from Chase Bank to Wells Fargo, you're not going to be paying them via Chase Bank. You're going to be paying them either PayPal or Zel or Stripe. It's going to be a payment processor that's going to process your payment to somebody else. Can you do a wire transfer? Can you do all of these other stuff? Yes. But we're going to use the example of using these third-party merchants that
actually send money back and forth. So when you go to the broker, the broker accepts your funds and then When you're going to go ahead and execute a trade, which is going to be like sending money, you're then going to use a platform called MetaTrader 5. So MetaTrader 5 is going to be the platform that you are going to actually execute your position on. So you first go to Trading View, you determine if you want to enter a trade or not. You deposit funds into the broker. The broker is like a bank. You can just
have funds in there just chilling. And then whenever You're ready to go ahead and execute the trade, you go to MetaTrader. So once you deposit money into the broker, you pretty much skip the broker every single time because you just go from the charts straight to the platform to go ahead and execute the trade. Once you are in Trading View to execute the trade, simply click buy or sell. That's pretty much it. So here, based off of your analysis that you did on Trading View, you're going to go ahead and then Execute the trade at
this point. So, simplest analogy that I can put is you're watching the fight. After the fight, you go to the little betting station at the arena. And then from that betting station, they're going to give you a little piece of paper. The little piece of paper is your slip that you've just betted on. And this is basically what your slip is going to be. So, this is where you're going to be able to see if your trade is in profit, if your Trade is in loss, and whatever directly is reflected off of MetaTrader 5, then
it's going to go right back into the broker. So, no money is ever inside of MetaTrader 5. MetaTrader 5 is just a platform that represents the positions that you've actually executed on the broker. Some brokers offer MetaTrader 5, some brokers don't. Doesn't really matter if they do or if they don't. This is just simply one of the actual ways for you to execute the trades into the Market. There is hundreds of difference of platforms for you to execute trades in the markets. There's hundreds of difference of brokers out there. And all this platform really does
is just the most commonly known one and the one that I personally use. This is just the main known one for you to be able to go ahead and execute those positions on there. So this MetaTrader 5 is never like this is not a broker. This is just one of those payment processors. If you go ahead and Try and pay somebody with PayPal, you can go ahead and then use Stripe. If you Stripe doesn't work, you'll use Zel. If Zel doesn't use your try something else, right? It's just it's a different platform to just execute
the trades on. But the money will always be inside of the broker. It's just reflected on this platform right here. Basically, win or lose money then you know goes back into the broker and then there you can decide to withdraw. Take it to your bank, take It to an exchange, take it to wherever and then you simply just withdraw your funds. So these are the only tools you are going to need for you to actually be able to be ready to take a trade. You analyze the markets on Trading View. Then you go ahead and
have your broker of choice. I recommend both of these brokers. Is there hundreds of other different brokers out there? Yes. I personally like these two brokers simply because they offer higher leverages and For the type of account flips that I personally do. You know, I've taken very small amounts of money to very large amounts of money. It's very hard to do that on heavily regulated brokers simply because if something is heavily regulated, they will not allow that high leverage and I would much rather have my funds on a broker that lets me have more access
to my funds and I'm able to actually leverage it more. So that's what these two brokers offers. trusted Brokers in my opinion. I've been using them for a very long time and they're not the best ones. I'm sure there's others out there that offer different fee structures, um, different commission structures and I leave you go to go ahead and do your own due diligence on it. But these are the both brokers that I recommend and I have been using for some very long time. And then same thing with MetaTrader 5. Is MetaTrader 5 the end
all beall platform where you can go Ahead and execute your trades? No. There's hundreds of different trading platforms out there that you can go ahead and execute your positions on. Metatrader 5 is just the most commonly known one that everybody's probably seen it. This is like a PayPal. You're going to send money from one friend to another. You're going to do it through PayPal. And if not, it's a different one. At the end of the day, what matters is that the money is sent through. At The end of the day, what matters is that the
trade is actually executed. That's pretty much it. Now, if you want to withdraw your funds in crypto and then you want to take it from crypto to your bank account, there's many different exchanges. You know, you have the biggest ones which are Coinbase, you have Binance, you have Kraken. There's many different exchanges that you can go ahead and send those funds to and then from there you take it to your bank. Now, how can you deposit into the brokers? You, you know, these brokers take credit, debit card or they can send them a BTC, crypto,
however you want. So, it's however you want to deposit the funds into the broker. But these are the only trading platforms you are going to need for you to be able to execute a trade successfully. There is hundreds of different other platforms out there, right? There's hundreds of different other, you know, web links, hooks that You can add, but I guarantee you, you do not need anything else aside from this right here. This is my window of trading. And these are the only tabs that I will ever have open. My trading view, the brokers that
I use, my checklist for my strategy, my community, and last but not least, Forex Fac. Forex Factory, as you can tell, is the last one on my list. Not because it is the least important, but because it is the one that I potentially use the least. And that is because this right here is a fundamentals tab. So Forex Factory is mainly driven by fundamentals. So as you can tell here, if we were to click on the calendar section of Forex Factory, we're going to have all of these potential impact news that are going to pop
up. And as you can tell, what we have is if I were to just go back one time, this lets us know the exact date and time when news are going to come out for a specific currency. And the color Of this folder is the importance of it. So something that is a red folder is far more important than something that's an orange folder. And obviously we have yellow folders and then gray folders, but I simply just don't use them because they obviously are very slightly like they don't impact the market at all. So, I
always like to focus on the red folders, but this is the only other platform if it causes any possible curiosity for you to understand the Fundamentals. And I'm going to break down the difference between fundamental trading and actual technical trading later on into this video. But this is the only other platform that is going to be needed. Here you can literally see what the forecast of the fundamentals are going to be, what it was previously, and then what it actually was. And as you can tell, for the majority of the part, it really is never
that much off. And these doesn't really create any big Impacts into the market. These are all very minimal. Even the big red folders don't really have a big impact on the market. It happens occasionally, but it's not a way for you to actually create a profitable strategy. So, these are the main trading tools, the main trading platforms that you're going to need. The last but not least will be forexfactory.com. That is just for you to understand the actual fundamentals of the trade. Aside from that, you do not Need any other trading platforms. You do not
need any other tools. You don't need anything else. All you need is just your trading view. You need your broker and then you need the platform for you to actually execute the trade. And that is it. So now taking this a step further, I'm going to actually show you guys how to create an account on a broker and how easy it is to deposit into it. So right now we're watching the fight. Euro USD is going up and I see that Euro is going To get stronger. Let me go ahead and buy the euro. So
we're going to put the example on 1xtrade.com. So go to 1 onxtrade.com. I created a random demo account. Just used a random email and this is the portal inside. So, some people sometimes get tempted or some people get skeptical by this, but it's very easy process. It's very seamless process, right? So, right here, as you can tell, it's a brand new account. There's no real transactions. There Really isn't anything. Dashboards are super simple because everything is straight to the point. All this is right here is like a bank. The money is going to reflect here
how much you deposited, how much you've profit, and how much you've withdrawn. Very simple. and where you see the actual trades, where you see the actual P&L, all of that is going to reflect on MetaTrader. So, we're going to go one step at a time. So, right here we have 1xtrade.com. This is the Dashboard. And let's say we want to go ahead and deposit some funds. For us to deposit some funds, we need to go ahead and create an account. Once we create one of these accounts, we can pick from either a standard, a commission
free, or an expert account. For this example, we'll just go with a standard. The difference usually tends to be minimal. And we're going to go with a 1 to 500 leverage, right? Very easy, very simple. This is the max leverage that they Offer. I'm going to explain what leverage is later on into this video. So, I want to go one thing at a time. So, right here, as you can tell, we have created a account. So, now we have 1 to500 leverage. We have $0 balance and we have zero equity into our account. So, for
us to go ahead and actually deposit it, we click quick deposit up at this top section over here. Now, we have the option to deposit in crypto or we can go ahead and deposit in credit card. So, this is a much faster process and it can be done in the next couple of seconds. I'm just going to use crypto and we're going to go ahead and click on this account. Make sure that we have crypto as our option. We don't have a promo code, but we are just going to place a basic $100 deposit into
this broker. Minimum is 10 bucks, but I'll do a 100 bucks. Promo codes. If this is if you have any actual, you know, credits like, you know, use promo code Alex, for Example, you get an extra 100 bucks. Not saying that's a real thing, but sometimes they offer promos for that stuff. So, let's say we click deposit into the trading account. I can deposit in Bitcoin, Litecoin, Ethereum, Tether, or USDC coin. We're going to use USDT ERC20 for this example. And this is the actual wallet address. So, I'm going to head over to my phone
and just send a quick 100 bucks just to show you guys how simple this is. So, right now, I'm Sending the funds from my cold wallet into this platform. So, just waiting for this to load. Some people don't have a code wallet. You guys can use credit debit. Usually takes a little bit longer because, you know, the processing has to go through. Crypto tends to be pretty quick. So, I've already sent it over. Should pretty much reflect into my P&L here. Pretty simple. Once payment is confirmed, they will be reflected on your account. Cool. So,
we can just go Back over to our dashboard here and pretty much just give it a couple of seconds and it should pop up pretty quick. And as soon as it pops up, I'm basically going to log in over here to my MT5 account on my phone. And then we're going to see how that is going to be reflected then. So let's give it a couple seconds until the balance pops up. All right, so quick update about 7 minutes later 100 bucks got here. This is probably like the part where a lot of People get
sketched out. Sometimes you just have to let the crypto do its thing. It takes time. It's part of the process. Usually it takes, you know, 1 to two minutes. This time it took 7 minutes. I guess it's because it's a near market closure. I don't know what the case is, but the funds are now here. Quick 100 bucks. So picture this as if this were to be like the bank, right? So the funds are now in the bank. Now in the bank, you can't actually go and send Any funds out. You have to connect it
to PayPal, which is going to be MetaTrader. And then you connect your funds to MetaTrader and you can go ahead and execute your trades and send the trades out to the markets. You want to send these funds out to anybody. Now it goes from this bank. You connect to PayPal and then you can send it to whoever. So we come here, we click on view. You can tell we have the MetaTrader 5 account. We have a standard account. This is my Account number. All I have to do now is go to MetaTrader. And when I
go to MetaTrader, I search up the server. So, it's 1x trade server. I click on the server. I then put on the account number, put my password, and I'm pretty much logged in. As you can tell, this is a brand new account. There's literally no history on it. There's no anything, right? We can go to transactions. We can go to everything. You can tell the 100 bucks just got completed literally 7 Minutes ago. And I'm going to log in now to Trading View. I mean, I'm going to log in now to MetaTrader so you guys
can go ahead and see how that looks in that option right now. So, the money is in the bank. Let's now go to the actual platform where we're going to execute the trade on. All right. So, now that we have officially logged into our MetaTrader on the phone, this is what it's going to look like. So, I'm just going to screen record here on my phone. They probably put half the screen the MetaTrader half the screen myself. So, basically over here once we are actually inside of MetaTrader. So, we're going to have 1 2 3
4 and then five buttons all the way over here at the bottom. As you can tell, this is the server that we are in, 1x trade. And you can tell this is the exact same account number as you can see over here on the actual backend or the dashboard of your account. You can tell it's 820838. So once you go to the dashboard area of this area and then you create a new account, it automatically creates a brand new MetaTrader account for you. They send you the the login password directly to your email and all
you have to do is log in. Once you log in, the money gets deposited into here and then it's going to reflect onto here, which is going to be the balance area of the MetaTrader 5. So, the middle section is where you can actually see your balance. You can see the equity, the free margin, which is where the trades are going to be fluctuating up and down. The button next to that is going to be the history button. Here, you're going to be able to see how much money you've deposited into the platform. You can
see the pending orders, deals, everything, right? So, this is basically the history of the account. Obviously, we've only deposited 100 bucks. It's all we're going to see in this account. Settings option. Everything here is pretty self-explanatory. This is just kind of the settings of the Metatrader 5. You can never realistically use this unless you're going to create a brand new account or log into a different one. The chart area, this is where you can actually see the chart of the price that you are going to be trading or the the market you're going to be
trading. For example, let's say we were looking at EuroUSD. We go over here to the quote Section, which is going to be the last button all the way to the left. And let's say right now we're trying to trade EuroUSD for example and it's not reflecting. All we have to do is just type it. Search up EuroUSD. Once we click on it, we can just click answer. So after and it's going to add it all the way at the bottom over here. Now if you want to see the chart of EuroUSD, we just click on
it, click on the chart option, and then it'll take us to that Second button once again. And then we're going to then be able to see Trading View. So if you notice this trading view chart right here is the exact same trading view chart that we are going to be looking at over here. As you can tell price feed is nearly the same right here. The market closed at 1.17312. And right here on the actual 1x trade server the price feed is going to be 1.7370 and 1.7340. So on trading view we get the real
raw price. Now, here on 1x trade server, we get the markedup price. So, this is where the broker is just charging a bit of a spread for executing us into the markets. It's part of the game. It's inevitable. You have to pay the fees. Whenever you send money through PayPal, whenever you pay for anything, there's a very small fee involved. It's part of the game. You want to get access to whatever it is that you're purchasing, You have to pay the fee. So, here's where you're going to be able to see all of the markets
that you are actually executing in the market. So, you can add as many markets as you want. You can go ahead and delete as many markets as you want. Pretty easy, pretty userfriendly. Everything is pretty self-explanatory. You should realistically only be spending maybe 5% of your time on MetaTrader because all that you do on MetaTrader is simply just execute the Trade. You're not ever actually analyzing the markets in this chart section as you would be doing on Trading View, for example. Trading View is where you actually break down the chart, make the trade make sense,
and if you're interested in entering the trade. Now on back to MetaTrader. This is where you actually go ahead and execute the trade. After you execute the trade, there's no reason why you should just be looking at the money going up and down. What you Should be doing as a trader is looking at the charts, seeing if the trade makes sense, if the market is moving in your favor. And then obviously whatever the charts are doing is going to reflect on your profit and loss right here on MetaTrader. So over here all the way at
the far left section once again where we have the quote section we have the option to go ahead and enter the trade which would be the first option once you click on that market you have the option To go look at the charts you can look at the trade details or you could look at the statistics I'm going to be completely honest I've never clicked on this details option I don't know how to use any of these options right here these are just some details of the currency pair I don't know what any of this
is I've never used it but it has that feature and then you also have the statistics which it shows all of this right here. Once again, I have Absolutely no idea what any of this means. I've never used it in my life. All I know is that I use the one option here, which is to go ahead and enter the trade into this market. Now, this button to enter the trade into this market is going to have multiple different options in here, right? So, you can go ahead either tap on that button and hold trade
or you can go ahead and swipe it to the right and then click plus. And that is also going to give you the option to go Ahead and execute this trade. So all the way at the top you can tell that we are trading EuroUSD. If you want to swap it for whichever currency, you can go ahead and swap it for Euro CHF. You can swap it for Euro CAD, but we're going to be using EuroUSD. Back here at the Euro USD, the button under the market that we're going to be trading, you have the
option to do either a buy limit, a sell limit, a buy stop, a sell stop, a buy stop limit, and a sell stop limit. All Of these are different limit orders that you're going to place on the markets. And I'm going to explain to you what those limit orders when we actually get into the charts. But I personally, myself, I have never used neither one of these limits. I've never used a buy limit, a sell limit, a buy stop, a sell stop, a buy stop limit, or a sell stop limit. These are all just orders
that you place in the market. So, let's say, for example, I want to set a buy limit On the market. I want to buy this market once it gets to X price. I want my stop loss to be at X area, and I want my takerit to be at X area. That's basically what it is. It's like you're going to set a price into the market and whenever the price gets there, it automatically enters that trade for you. That is a style of trading. I am not against it. I just personally don't believe in it
simply because you're entering a trade without confirmation. You need to enter a trade once you actually have a kind like a proper entry signal once it meets your actual trading plan. And I'm going to teach you how to do that later that that into the video. These are multiple different ways on how to actually execute this trade. Now, the simplest one is market execution, which is going to be the one that you're going to use 99.99% of the time, which is you just simply place your stop loss. I mean, excuse me. You simply place your
lot size and on this lot size here, you can make it one lot, you can make it two lots. And a lot of people get confused on this whole lot size position calculating. And it's actually very easy. So, this lot size here has to be directly predetermined before you enter the trade. So, you know exactly how much you're risking. That goes based off of your stop loss and how much you're going to have on your stop loss. So, let's say, for example, you're Interested in entering this trade as a sell, right? Just for an example.
Or, you know what, we'll do a buy. it's a lot easier to understand a buy. So, we have a buy example on this market. Our stop loss is going to be, let's say, 20 pips. I'll explain what pips are and how all this works in just a second, but let's just say it's 20 pips. And our goal right here is to figure out what our lot size is, right? So, we're going to for now for us to determine our lot Size, we need to first determine how big our stop loss is. So, we're going to
go to 1x trade, LQ Markets, whichever one, they both have this lot size calculator. You're going to put the balance amounts that you have on your account. Then, how much you want to risk of your account. Let's say we want to risk 1%. Right? And then our stop loss is or say we want to risk 10% of our account. And our stop loss is 20 pips and the currency pair that we're trading is EuroUSD. All we Have to do is just click calculate lot size. And this lets us know that we have to put a
0.05 lot which is risking a total of 10 bucks. So we know that if we were to go back over here to the actual MetaTrader where we're going to execute the trade, we have to place a 0.05 lot size and then our stop-loss number needs to be exactly what it is right here on the chart. So our stop loss number would be 1.17096. So it' be 1.17096. And then our take profit would be where we set our takeprofit up here. It's going to be 1.17 going be 1.1715. So now at this point we are pretty
much ready to buy this market. We could go ahead and then click on that buy button and we know if we are completely wrong on this market. Okay, so we know that this is our stop loss 1.17096 and this is our take-profit 1.17715. If the market goes straight into our stop loss, we are not going to blow our account. We have a stop loss which is going to minimize our loss which is at our predetermined risk what we have just calculated on this lot size calculator. So now at this point, the fear of people thinking
that I'm going to lose all of my money when I put money into a broker or whenever I go trade is gone because you're only risking $10 from your actual trading balance. So this can go to your Stop-loss right away. You've predetermined you're only okay with losing on this position, 10 bucks. So obviously, if we would want to enter this trade, we would go ahead and then click buy. But obviously, the market is closed. The market just closed nearly 30 minutes ago. But as soon as we would enter this trade, it would be reflected right
here on this actual area. And right here, you're going to be able to see your trade fluctuate up and down. And then you can go over here to this area and you're going to be able to see your stop loss. You're going to be able to see your takerit. You're going to be able to see the trade be reflected in real time. And you're going to notice as soon as you enter the trade, you're going to be an immediate draw down, right? So you're probably going to be in a loss, maybe a couple bucks, right?
Five bucks, six bucks. And that's because the broker, as soon as it enters You into the market, they don't care if you're going to be in a winning or lose or losing position. They're going to charge their fee. They don't care if you're going to be on the right or wrong side. They have to get their profit first for them to go ahead and execute your trade into the market. So, they get your trade, they're going to put into the market, they're going to take a small fee from it, and then your trade happens, whatever
happens with it. Win Or lose, the broker is always going to make their money. That's just the name and the game of the business and how it works. So once again, you have your Trading View account, which is your where you're going to analyze a trade, determine if you're going to buy or sell a market. Once you're ready to enter this trade, you need to go ahead and deposit some funds into the broker. Once you have your funds inside of the broker, you need to then actually go to Then MetaTrader, which is then going to
be this right here. On MetaTrader, you're then going to go ahead and then place that buy or sell button. That's pretty much it. Now, whenever you win your trades, you come back over here to the dashboard area of 1x trade. And then you're going to head and then click withdraw your funds. Now, you can withdraw your funds to whatever wallet or however format you choose to withdraw your funds. And the funds go back from The broker into your bank account. That's it. Very simple, very seamless process. These are the three platforms that you're going to
need to actually to go ahead and be able to execute a trade into the market and be able to successfully have a profitable strategy. So now coming back to the charts, now that you understand exactly that you only need three platforms to actually trade into the market. You need the trading view, you need the broker which Is like the bank and then MetaTrader is where you actually execute the trades. Let's take a step back to actual trading view, right? Trading View is going to be once again like where the fight where everything goes down. So,
I'm going to explain to you how trading works, all of the different options within Trading View. So, right now we are on Trading View. As you can tell, we are on tradingview.com. This is basically where you're going to analyze every single one Of the markets that you are going to be interested in trading. This is the most common known website for you to analyze your markets. I've been using this only website and I've never heard of any other trader really using another different website, but this is where you're going to be able to actually identify
if you're interested in buying or selling a market. Right? So for example, let's say we're going to go trade EuroUSD for example, right? And We're going to go to a different server just for examples purposes. So for this different server, you can tell here that EuroUSD, this is what it looks like, right? So this right here on the chart, as you can tell, is the candlestick option. So we're going to take it a step back. And I know I was going to tell you guys how to use the no gap candlesticks. So right now, if
I were to hypothetically actually, you know, input my actual candlesticks. One second. It Should pop up something like this. Let me get them to pop up. We come to settings. We go to symbol body borders and wicks. Okay. So, as you can tell right here on EuroUSD on the weekly time frame for example and then on the ICE server, this has many gaps. So, as you can tell, this market has a gap here, has a gap here, has a gap here, gaps throughout all here, which make the market look weird. We were to look at
it on the daily time frame. You can see More of these big gaps right here, these weird fills in the market. Just looks very weird, and it personally just throws off my trading as a whole. So, what I like to do is I like to use this indicator named the no gap candlesticks indicator. So, all you have to do is go to this indicator section over here. So, just pause the video right now or open up your Trading View real quick. Log in, create an account. It's going to be very basic. Once you log in,
create your Account. You're going to get the candlesticks that are going to be popped up. And down over here, you're also going to get the volume section, which is going to be popped up probably something like this. Should be somewhere over here. You're probably going to get some bars down over here, which are going to be like some big blue, no, some big green and red bars. And all you really have to do, they're going to be a bunch of bars like this. All you have to Do is just click on those bars. Right click
on it or double click on it. And then just once you click on it, there's going to be a popup and then it's going to say volumes. Just unmark the volume. So you're going to double click on it. It's going to say volumes up over here. Just click on it and then it's going to remove this section down over here. All that does really just clutter the chart. Just creates extra noise. You're never going to use that option. It's very Unnecessary, right? So once you have that, you're then going to have your candlesticks. most likely
with these gaps. So, the easiest way to get these gaps removed, it's actually very easy. All you have to do is come over here, click on the indicator section and then search up no gap candles and then you're going to get this first one. The second one works well. I personally use the first one. Once you click on it, as you can notice immediately, right away, the Markets look different. There's already a difference inside of the market. But you can't just automatically click on it and expect for it to work, right? What you have to
do is once you click on it, so let me just remove this one because I don't want to have two of them. Once you click on it, what you actually have to do is doubleclick the actual market. And then this right here is going to give you the current candles. And all you have to do is click off the body, the Borders, and then the wicks. And if you notice there, you're going to be left with the actual no gap candlesticks candles on the ice server. So basically somebody created an an indicator that fills in
the gap for those candlesticks that have gaps, right? This is just a very simple indicator and this is not really an indicator. This is more of just an actual tool that's going to help you have the markets be as clean as mine. So once again, if I were to take a Couple steps back, this is without the no gap candlesticks indicator. As you can see, there's gaps right here. I then turn on the gap candlestick indicator and then it has a fill but it still looks a little off. So all you have to do is
just doubleclick those candlesticks. Once you double click them, you uncheck the body. As you can tell, look at the difference it makes here in between that body and that wick. So you check off the body, check off the Borders, and then you check off the wicks. And then you have a real market movement for how the market should look without the actual gaps. So this right here is a little bit of a hack. This I learned pretty late into my journey. And uh once I learned it, it did clear a lot of things up, right?
I just wanted to get that to be the first thing that I teach you when it comes to Trading View because I know it probably cause a lot of curiosity, right? We're going to get Into the EMA, what setting my EMA is, and how to use it in just a second. I just want to give you an overall training on how Trading View works. It can be very overwhelming at times. Depends on how much you look at it, what should you look at, what should you not look at. So, we're just going to break down
the most important things and the things that matter and don't matter, right? So, we're going to start off right over here at the top left, right? So, over here at the top left, as you can tell, we have the market. So, this is Euro USD. This is the market that we are currently looking at right now. If you want to change the market, all you have to do is click on that search bar right there and then you can type in whatever other market. This is basically for you to search up any market that you
can possibly imagine of. You can literally just search it up here and it will pop up. Or you can just simply type It on the keyboard and then it will also pop up. It's equivalent to the same exact thing. You click the plus sign, it's going to create pretty much the same exact thing. Next to that, you're going to have the time frames, but you might only have one time frame pop up. Might be the daily, the weekly, or the 4 hour. You click this little arrow down here, and once you click this popup, you're
going to get all of these different time frames that are going to Pop up. You have the 3 month, 1 month, 1 week, day, 4 hour, 1 hour, 30 minute, all of these different time frames, right? All the way up to the 1 second, which you're never going to be using. As I've mentioned before, I only use the weekly, the daily, the 4 hour, the 2 hour, the 1 hour, the 30, and the 15 minute. Now, if I were to uncheck these stars right here, what ends up happening, as you can tell, is it removes
them from this top section over Here. This is basically just a little bit of a hack that makes these time frames just pop up over here and stay there saved. So, whenever I want to go from one time frame to another, it's a lot easier and I don't have to go into this section over here and add it or manually look for the time frame. These are all the time frames that I use. I don't use any other time frames. And whenever I'm going to be going in and out of a time frame, this is
how I am Going to be looking for that. The section next to that is all the different types of candlesticks that you can potentially use. As we've already broken down, all of these are just information overload. You don't need to know what any of these candlesticks are. The only ones you need to focus on is the line chart and the candlestick chart. Now, don't worry. In just a second, I'm going to be teaching you guys how to properly use the line chart, What it's used for, and all that stuff. Don't worry, one thing at a
time. Once we get to there, I'm going to break it down, and you're going to see how simple it will be. But this section here is just for you to identify the actual type of bars that you want to pick. This is the style. Indicators is pretty self-explanatory. You can pretty much search up any type of indicator that you can possibly imagine. Here, there's going to be endless indicators that Trading View offers you. And I think the only indicator I have ever searched up is the EMA. I've never really gone into this indicator section. I
know this is a never- ending journey or world in here. Inside of the indicators, there's a bunch of different types of indicator traders and I don't know anything about it. All I know is that inside of this indicator section is where I find my EMA and my no gap candlesticks. That's it. I've never used this area for anything Else. This is for an indicator tempo. Once again, this is another thing when it comes to the indicator. I have actually never even gone into here or saved anything. not sure what it's used for. So, I can't
really educate you on something that I've never used and I've never found any use for it. Next to that, we have the alert section. So, this is if I want to place an alarm on the market. So, right now we are on EuroUSD, for example, and I want to be Notified once price crosses through a certain point. So, right now we are at 1.17331. Price right now is at 1.17331. So, let's say we want to get notified once price goes to 1.74 0 and it lets me know I get a notification on my phone. I
get a notification on my computer one time when it does that or every single time it does that. So, it can happen more than one time per minute or it will only Be letting me know one time and it won't be repeated. And I can put an expiration date and I can make this pretty much indefinitely, right? I can click create. Soon as you click create, you can tell how the alarm or the alert pops up right here on Trading View. So let's say for whatever reason I want to enter this trade when the market
gets here, but I have to run to the gym. I have some groceries to do. I have to step out of the house. I have to step out of the Office. I don't have to be glued and stuck in front of the computer. This alarm here will let me know once and if price ever does that. If I want to move it up, all I have to really do is just drag it up and then the alarm gets dragged up. If I want to move it down, just grab it and drag it up and down.
I can pretty much also squeeze price in here. And another way to how you can add an alarm is over here to the right hand section. You can just click this plus Sign and then you can click add alert. So that's when price gets to this area right here. If I were to click on this as well, I can add an alert when price gets to the EMA. For example, if I want to delete it, I just rightclick on the alarm. If I once again click this right here, I will be notified once it hits
this area. It's pretty much neverending different types of ways on how you can set up the alert. The only way I ever use it is I click this button right Here. I add the alert at that point. And once the market gets to the point that I needed to get to, I do whatever I've been interested in entering in the market. If I want to delete it, hover over it, click right here, and click delete. It's very clean, very seamless, and very simple. I get very creative with my alarms. What I tend to do is
I trap price. So, I'll put an alarm up here. I'll put an alarm very tight into this area right here and I'll know when Price breaks below or breaks above. And sometimes I get even more creative and I right click on the alarm or double click on it and I'll place a message or I'll be like your USD is crossing this area, enter now, bro. Or you got stopped out. So whenever the alarm hits, all you really have to do is look at your phone and you're going to know what the alarm is going to
be about, right? So, this is a little bit of a message that you can leave yourself whenever you place the Alarms at whatever the area is going to be. That's pretty much all it comes when it comes to the alarm sections. These are all of the notifications and how you can set it up. You can get an email, web link, sound, just however you want to set up your alarms. The way this is the way I have it set up and it's been working perfectly for me up to this point right now. But you can
get as creative as you want. This little arrow is basically the back. So, let's say, For example, I had some drawings set up into the markets and after these drawings, I ended up just accidentally deleting them. All I have to do is just click back and it comes right back. If I want to go to where I was, I just click forward. Pretty self-explanatory. This little bar right here, don't worry, we're going to get into that just a second. Just kind of going along the order of how everything is placed. This right here is basically
the area that Reflects the actual price of the market and where the market is. And these are the numbers that are reflecting it. You may see me sometimes grab this and it basically all it does is that it moves price up, moves price downs. All you have to do is just left click on it and then squeeze it, hold it up and down and then you're going to be able to either look at the market in a much wider format or in a much tighter format. Really depends on how close or how Zoomed in you're
trying to get to the market. Continuing up over here to this top section, we have the square button which is a layout setup. So this is different types of ways how you can look at the market. Or if you want to split it in between two markets like this, you want to split it into neverending different styles, you can pretty much go free with that. I personally always just have it in the standard one market layout. This unnamed I don't even know What this is to be honest. Maybe this is just a settings area that
you can do something about saving your charts. I always have it set up like this. I've actually never even changed this right here. I have no idea what this is. But the button next to that is the quick search. I have no idea what this is either. I have never used it. This right here is just the settings on Trading View as a whole. So the settings is once again about the candlesticks. Obviously, I don't have my candlesticks checked because I have the no gap candlestick setting option on the trading view. This is what I
have for the status scales. Oh, this is the volume button right here. So, as you can tell, okay, never mind. I thought that was going to pop up the volume down over here, but yeah, I guess that's not it. Is it somewhere here? It's not. But this is how I have my settings. I I don't really mess with this right here. I've never really have I don't really understand how to modify or do anything when it comes to any of this stuff. This is pretty much how I've had it for years. It pretty much stays
the same every single time. And this is how I have everything set up. So, I guess you can pause it, look at yours, and make it look exactly like mine. This is what I do to set up my charts every single day, right? So moving along with that, we have this button right here. So this is basically to make the market Pretty much full screen. So the whole entire screen, as you can tell, is just the chart right now. This is a very clean format on how you can look at the chart if you just
want to focus on the actual price and not get distracted by any of the other buttons that you may have. And then you can just click the exit button on your keyboard, the ESC button, and then it returns back to where it was. But it's a pretty cool feature in order for you to just see the Chart to not get distracted with all of these different buttons. Little camera button is so you take a screenshot or take a snapshot. Screenshots basically this page saves it for you and then you can go ahead and save that
to your desktop, to your trading journal, wherever you want to save it. Moving on, next to that we have the publish button. I've actually never published anything inside of Trading View. I guess Trading View has communities of other traders That post stuff in there. I have no idea what that is, but I've never really used it. Moving on over here, we have the blue list. So you probably have a red list which is a standard when it creates your first account. But inside of this blue list is where I have the markets that I am
currently trading. So as you can tell all of my markets are currently tagged with a blue tag because this is the markets that I trade. I pretty much picked this color blue when I started Years ago and I've just stayed with this blue list and I've stayed very superstitious to this list. These are my profitable pairs. These are the pairs that I tend to find the best market opportunities in. And I don't plan to modify them for anything. Now, you guys probably can't see them because my face is in the way, but these are all
of the markets that I personally trade. And I don't plan to change the color blue. I don't plan to change these markets or Add any of the markets. This is more than enough markets for me personally. I'm very superstitious with them and I like them the way that they are. So, I know here when it comes to the blue list, you can add stuff here. I've never even clicked on this option, so I don't even know what it is. I believe this plus sign is if I want to add a symbol, but another way that
I can go about adding a symbol is by simply just searching it up. Let's say I want to add A UD NZD, for example. All I have to do is just click on this little flag button over here. And once I click on it, I can pick the color that I want to pick. And as you can tell, the default color is going to be blue. and then AUD NZD will pop up as the last option all the way down over here. Now, I actually don't like trading NZDUSD. So, for now, I'm just going to
click on that flag and then it will automatically get removed and then I no longer have AUD NZD there. This little pie area is advanced view. I'm actually going to be clicking this for the first time ever. Okay. Well, I guess this is what it does. And I have no idea what that does. So, we're not going to I can't break something down that I have no idea. here on the settings option. This pops up the volume, the change, and all these different stuff over here. Honestly, let me see. What is What is this? Okay,
there you go. That that takes away the Price. This takes away the the change. And then this takes away the change percentage. Honestly, I might just leave it like that. That looks a lot cleaner. And when I go like this, I guess. Yeah, actually, I like that a lot better. I mean, honestly, it looks kind of cool when I had all of these, right? Cuz it it looks like I looks like I'm on to something. But basically, right there, that's just the options that this can pop up. I don't even know what this Change percentage
is. I don't know anything about this. All I know is that this is the price. So, Bitcoin is at 115,000. XRP is at this. Ethereum is at this. And this is the price of these markets. That's pretty much it. That's all I really know when it comes to them. I don't really know anything else inside of here. This right here is going to be the the watch list and the details. So, if we were to click that and thenclick that, it just hides them and removes Them so we can have a little bit more of
some space. Or you can just simply drag it left or drag it all the way to the right so you don't have to see them. I always like having it pretty much like this where I just see the first base currency. I don't really need to see the quote. I know the order of my pairs and I'm very well in connection with them. The button under that is going to be the alert. So this is every single time your alarm gets hit. This is pretty much like The the history of all of the alarms that
you can have. Get tells you all the details about it. I mean I've had I don't know. I'm curious on how many alarms I've had. But I've had hundreds of different alarms that have been triggered. And yeah, this is like the history of all the alarms that I've used. Let me see when I place my first alarm. It's pretty interesting. I placed my first alarm 2020. Is that is that what it is? December 20th. Is that is That the day? Yeah, December 4. So, I guess the first one is down here. Oh, you guys can't
see it, but right here you can see December 13th, 2020. It's when I placed my first alarm. And right now it is September 13, 2025. Dude, I've been doing this [ __ ] a long time. Five years I've been just following these alarm. I didn't find out about these alarms until like a year and a half into my journey cuz I was just trying to predict this [ __ ] if it was Going to go up or down, honestly. So, as soon as I figured the alarms is when I realized I didn't have to be
in front of the markets all day. This area over here is the object tree and data window. I have no idea what this is. I guess this says all the different objects I have inside of the actual chart, but I don't use this. And then this is more of like a community section. I have never engaged with anybody in that community, and I do not plan to either. Down over Here, I don't know what this is. I don't know what this is. I don't know what this is. I don't know what this is. Or this,
or this. Oh, you guys can't even see it. So, it's even better. All the three options that are going to be at the bottom right corner. Actually, let me see if I can move myself. Oh, I hope I didn't mess this up. Yeah, let's just leave it like that. Okay, there you go. I hope you guys are seeing that right there. So, these little icons over here, This one right here, this one right here, this one right here, and this one, this one, this one. I don't know what any of these icons are used for,
to be completely honest. I have never used them myself. Let me actually just move myself to the middle for now. But yeah, I I don't use any of these options right here. I have never used them. All I use sometimes is this right here just to block out some of the markets that I'm not going to be trading for the week. So Let's say I break down my 10 different markets for the week and I'm only interested in trading these for example. I'll just use this right here as a form to just block out all
the other markets just so I don't get distracted. But this tab here as well, I don't use any of the information in here at all. This is [ __ ] Letting you know that this more of a buying market than a selling market. This uh seasonal is [ __ ] This performance is [ __ ] This is All just an information overload that you don't need to use it at all. The only thing that I personally recommend to be using here is this note section. So in here you can actually write a note to yourself.
So hey I'm waiting for a shift to structure or hey I'm waiting for my entry signal. And then all you would simply do is just add that and it's going to be a note that will be saved inside of your Euro USD section. For example, on my AUDCHF example, this Is a note that I wrote to myself in 2022. So, about to be a little over three years ago, I wrote this note to myself. Um, these are the confluences that I had to sell, for example. And these are just notes that I can just write
to myself in here. But yeah, this in here, I don't use this at all. I don't use this right here at all. This is just a bunch of information overload that you don't need to have. Once again, I just have it here because I think it Looks cool and I personally like it. you know, whenever I post videos on Instagram or here on YouTube. Looks like I'm a more of an expert than what I really am, but this really does absolutely nothing, right? So, now that we understand that, I'm going to move myself back to
that right hand corner. There we go. So, coming back over here down to this section of the trading view. I don't know what this little option over here is. I guess this is the Time zone that I'm in. Whatever time zone the market was like, whatever trading view was created on, this is what it is. This is the time zone that I have. I've never really modified this. This down here is going to be the actual calendar of the chart. So you can tell this is September 3rd, 5th, 9. So these are more of the
days and the further you go back, you can just see the months continue to go back. Even the years, we have 2025. We go even further back, we Have 2024, 2023, pretty much so on and so forth. So down here is the dates of the markets. And once again, you've probably seen me grab this just to use the markets left and right. Hold on to the screen and move it up or move it down. You can also move it to the left. You can also move it to the right. Just a different way of you
adjusting the charts. This area right here does pretty much the same thing. You right click on it, you move it to that area, you click This area, you move left. This, you click this right here, you move right. Or you click on the reset the chart, and it just resets it back to how it should originally have been. Moving on down here, you have this area over here, which is going to be the one day, 5day, 1 month, 3 month, six month. I don't really know what this is. I'm sure if I click on it,
it's probably going to take me to something like that. I don't know. I've never clicked on it. I've never Clicked on this button either. I have I did I did do this once one time by accident and I brought this up. I'm like, whoa, what the hell is this? And I guess this is just a different way for you to pretty much just set up, I guess, your bar replay. And I just realized that I did skip a button which is going to be the bar replay. So the bar replay is actually something that you
use to back test. So I just clicked on that button and let's say I want to back Test. I can just start back testing. Let's say from this point right here. I right click it and then all I would have to do is just start. I click the play button and then it's like if I were to be back back testing. I can pause it. I can speed up the time of the candlesticks. I can change from a certain time frame to another. This is basically the back testing tool that Trading View has to offer.
It's a very cool feature and personally I don't Recommend back testing. I actually hate back testing. I think it's one of the biggest mistakes that traders do when it comes to back testing because it creates a false expectation of what trading is really going to be like. I have my personal opinions on it and you know once my students join the community I explained to them that live testing is the best thing that you can possibly do because when you go back test you pretty much just saw what ended up happening Here, right? Even whether
whether you try and forget the or whether you get a friend to come pick the market and select the bar replay button, this still is not the same because right now we're on the four 4 hour time frame and this market just had all of this move right here and that just happened in literally 2 seconds and in real life this took nearly 36 hours to happen. So there's a big patience factor that back testing does not take into account and I feel Like it gives a false perception of what trading really is like. That's
why I'm personally very against back testing. And I'll give you guys, you know, more details on my thoughts on that later as we go through the actual strategy part and how you should actually be trading and what you should be looking for and what you shouldn't be not. But yeah, I just realized that I overwent that bar replay button. But continuing down here, yeah, I've never really used this area Down here. I think about a year ago I accidentally moved this up and then I realized something down here even existed. I don't know what this
open panel or maximize panel even is. Moving down over here to the left hand side, you're going to have this little star. So this little star is actually this toolkit right here. So this toolkit, if I were to click the star, it pops up. If I don't click it, it won't pop up. Once I have my toolkit pop up, these are all Of the tools that I actually use to analyze the market that I use to determine whether this is a good trade to buy or whether this is a good trade to sell. Now, these
are all of the tools that I personally use. These are all of the tools that Trading View has to offer. If you were to rightclick on the trend line and tools, you're going to get many different formats of trend lines and many different ways that you can identify the market. You can get This type of tool. You can get this different type of trend line here. For example, you can get a trend diagonal. I have never used this in my life and I have no idea what they are used for. I only use inside of
this line section. I use the trend line, the horizontal line, and the horizontal ray. For you to get access to it, all you have to do is just put the star. Click the star. Click the star. And you're going to notice that it's going to automatically pop up on Your own custom toolkit bar. All of these other different types of trend lines. I don't know what this is. Like the [ __ ] is this? This is a pitchfork. Like how? Like it's literally named pitchfork. Then this is a shift pitchfork. Like what the [ __
] is I don't know. This in my opinion is just too much information. And believe me, when I was learning how to trade, I was here breaking my head, literally trying to figure out, first of all, what is a Pitchfork? Like, what is an inside pitchfork? Like, what the [ __ ] Like, looking at this now after I've been trading for such a long time, just makes me feel extremely happy that I actually was able to become a profitable trader with this amount of information overload that, you know, these different platforms have to offer. You
know, they they don't do it in a malicious way. They just do it because, you know, their their business is to offer all of these Different types of tools just so anybody and anybody can use it. But what nobody teaches you is that you don't need to know or learn every single thing inside of this platform for you to determine if a trade makes sense to buy or sell. You really don't. But all of these tools that I have here, the trend line, the horizontal ray, and the horizontal line are the only lines that you're
going to be needing inside of this section. Moving on to the section below, you have The Fibonacci. So once again, there is a quantillion different amounts of Fibonacci tools and different formats that you can use. I don't use any diff I don't use any type of Fibonacci. I don't use any type of can or what I don't even know like I think this is the biggest I don't even want to say anything but I don't know. I just I'm telling you, I just looked back and I really tried to figure out how to make something
work with this right here. And you guys don't Understand how much time I wasted by doing this. This really this really messed me up, guys. I I I mean this in the most humbling way. Like this really made me lose a lot of time. So, you won't need to be learning any of the stuff here. They can pretty much nuke this whole entire tab right here of the Fibonacci and that will change absolutely nothing in my trading. Next, we have the pattern section. In this pattern section, you have the all of These different types of
patterns. The holy pattern. Let me see what this one looks like. What is this? The cloud. Like how does this even make out I don't like what what does this do? I don't I don't know. Oh my god. What is this? The Sline. Y this looks like a heartbeat. This is like Bro, this was my heartbeat trying to learn this whole trading [ __ ] Trying to figure out if I should be interested in buying or selling. Like this right Here is not a trending. This I don't even know what this is. Oh my god,
I just I'm so passionate about trading that sometimes this type of stuff drive me crazy because it can just completely mess up somebody's journey. The only pattern you're going to be needing, ladies and gentlemen, is going to be the head and shoulders. So, just put a little star on the head and shoulders pattern and then it should pop up right there into your toolbox. Below that, You're going to have the projection. You're going to put a star on the long position and the short position. These are very self-explanatory. Whenever you're going to buy a trade,
this is the long position you're going to pop up. So whenever you buy a trade, you expect for you to pre-calculate your risk. So in here, let's say you're only willing on losing a 100 bucks. And then if you were to then have a one:2 risk-to-reward, for example, which is what this is set up Right now. So your risk-to-reward ratio is a 1:2. So you're risking $100 here to then making $200 here. So this area is where then you're going to be making $200 in this area right here. So you're risking 100 right here. And
if you win, you win 200. If you notice, it is literally the exact double size. And that's what makes it a perfect one to two risk-to-reward. So, you're risking one to gain two. Or you can risk one to gain three. Just simply triple that. And Then there you go. So, you risk one to gain three. You could do gain four, five, six, seven. It's all based off of this number right here. So, this right here is a one to five. So you're risking one to gain five. Right here we have four and then we have
five for example. So this risk-to-reward tool works for buys and then it also works for sales. So here you're risking one to gain two. And I'm going to be explaining to you how to properly place this where it Should be your minimum risk-to-reward tool why it should be and the whole entire philosophy behind that. So that's what the risk-to-reward tool are going to be. And I feel like I didn't really mention these other tools over here, but uh trend line is very simple. It's just a trend line. We don't really use it as a trend
line. We use it more for to create our structure points. And I'll explain all of that later once we get into that. Our horizontal line is just So we can identify a line that goes pretty much across the chart. And a horizontal ray is pretty much the same exact thing as the horizontal line. It's just from a certain point. So instead of it being the whole entire market, we could just place it based off of this point. Makes it very simple so the market and the charts don't get too cluttered up with an abundance of
information. So the head and shoulders pattern is used as a reversal pattern And this is so you can determine where the left, the head, and the right shoulders. If you guys have been following me for some time, you're probably going to notice that I repeat this pattern time and time and time again. That's because this is simply one of the most powerful patterns in the market to date. and it's the one that has led me to have the majority of my success. But there's a very specific way on how to use it. And don't worry,
I'm Going to be breaking down how to use this pattern accurately later into this video. For now, I'm just showing you what Trading View is and what you should be focusing on and what you should not be focusing on. This is pretty self-explanatory. You might have it full of different colors. It might be pretty ugly when you have it. All you have to do is double click it or right click the head and shoulders, go to style, and you can pretty much style it however you Want. You can put it available on whichever time frame
you want. Change the colors. Put the borders however. And you can make the background however you want. I'm sure pretty much I'm sure it comes ugly. Probably does. Probably comes with a bunch of different colors and ugly like this. I just have it as simple and as clean as it can possibly be. But I'm going to be showing you how this works later inside of the video. Next, we have the long and short Positions. We won't be needing anything else down from over here. This is crazy. This is basically saying that it's going to predict
the next move. It's pretty cool. I'm not going to lie. It's for like a tattoo or something, but not to make money in trading. Honestly, that makes no sense. Next is the brush. The brush is just used for my educational purposes. Whenever I want to mark up structure points or whenever I want to mark anything off and show people or Just set a reminder of something, I'll just circle it and I'll know to come back to it whenever is needed just to pretty much note things down. The rectangle is going to be used as a
box. This is where you're going to place your zones of support and resistance. And I'll be breaking down support and resistance later. So, make sure you have this box. It's going to be very crucial and essential that you have it. Once again, if you don't like your colors, Double click it, rightclick it, and you can pretty much change the colors however you want. Or you can just do it based off of this other tab right here that pops up. And then here, you can go based off of the custom colors that you want to go
ahead and make your box. I always like making it as light as possible so you can actually see price. Some people like having it super dark and if you have it super dark, you literally cannot see price. The box is Blocking price. I like making it around a four to 5% just so it's very light tint so you can identify if you're in or out of the box, but you can also see it. Next is going to be the rotated rectangle. And this one I'm actually going toclick. I accidentally had that one in my favorites.
Next is going to be the path. This one is something that I use to identify market structure and I follow where the price is going to move or when I have a prediction from the Market. For example, like let's say I want the market to have a retest of this area right here to then buy. I do this whenever I analyze the markets every single Sunday with my students and I give them my top markets. I will do something like this. So throughout the week, they know exactly what they should be looking for and wait
for the market to do something like that. Basically, this is just me setting up the the path that the market should follow in order For me to be interested in the trade. Next to that, you have the eclipse. The eclipse is just another form of you placing a circle. If you want to go ahead and zoom into a market, for example, let's say I want to go to the lower time frame on this area right here. I just put the eclipse. I put a circle over here. And we go down to the 30 minute time
frame. And on the 30-minut time frame, I know that that's where on the 4our time frame I had it Circled. And I'm going to be looking for whatever market structure or whatever learning lesson that I need to look for it here. If I want to see how this specific market looks like on the weekly, I know that all I have to do is go to the weekly, find that circle, which will obviously be a lot smaller because you know that the higher the time frame, the tighter it's going to be. This is what that circle
will look like on the weekly. If I want to see it On the daily, this is what it's going to look like on the daily. just an area for you to be able to identify the market and you can tell where you are in that market and then you can go and look at the details. Then that's going to be the final tool that you're going to add inside of this section. Next to that you have the text and notes. If you want to make sure you can add the text tool. So this right here
is so you can write down your actual confluences onto the chart. So whenever I want to write down a note to myself I can either use this option over here. So I can use this notes option in this area of the trade or I can actually do it right on the chart which is where I like it a lot because I'm literally placing it right on top of the market. So for example here I am waiting for the market to come back to my area of interest or area of interest. Now if I want to
make it longer just go like this. If I want to make the text Smaller I click this button right here making it smaller. These are all just custom, you know, curious creature features that you can pretty much play with it, but it's just just a note thing pretty much. Under that, we have the call out. Call out is pretty self-explanatory. Let's say you're going to get on a call with me or you're going to get a call with my team and you want to review a trade. You simply get this call out pointed to this
point and it's Ask this, ask team this. So, for example, it's just so you have the specific spot that you want to actually write it down or review it. Or if you take a trade and you took a loss, for example, let's say, for example, this week I took a loss here on NDUSD. I'm going to use the call out option. And here's where I'm going to I took a loss, but I want to come back in one week and see how it reacted, for Example, or how it reached this area, so on and so
forth. Just a different way on how you can actually write down a note onto the market. Continuing from that, you have the emojis. We're not texting anybody. We're not, you know, putting emojis here. We're here to make money, not to put little hearts on our trading view. Ladies, if you're on here, you're going to put hearts on your charts. Sorry, not that guy. Guys, if you're going to put a heart on your charts, I Think you should not be here. Totally a joke. If you want to put hearts, you can do whatever you want, but
I've never done that in my life. This tool right here is going to be the measurement tool. So this tool is actually very useful when it comes to either measuring the size or the time of a market. So for example, let's say we want to know how long the market took from get to get from this point right here to this point right here. This market took a total of 93 bars, which on the 4hour time frame is a total of 21 days and 12 hours. So you can just click the actual candle or anywhere
in the chart and drag it left. And you can see how you continuously dragging it left. This is going to continuously move and it's going to measure how much time or the length of that move. Now, that is the time wise. Now, if you want to measure it in pips, which I'm going to get into pips right now, all you have to do is just go up And down. So, let's say you want to see how big a zone is. For example, let's say you want to measure this zone. You go to the top of
the zone and then you go to the bottom of the zone. And you can tell that this zone is a total of 20 pips. 20.3 pips. If you want to measure the size of this candlestick, you go from the top of the candlestick to the bottom of the candlestick and you can tell it is a total of 52 pips. And now if you want to measure it to the upside From this zone to this zone, you can tell that that is a total of 40 pips. Now what are these pips? What is a pip? Pip
means point in percentage. Point in percentage. Percentage. So this is how you measure the market and the the length of it. So let's say this right now is uh two fighters, right? So these are two fighters. This is the pound versus the Swiss Frank. And this is when Mike Tyson or this is when The Swiss Frank beats up the pound. So this if this movement goes down that means that the Swiss Frank is getting stronger than the British pound. This move is happening right here. And you want to measure how strong that move was, you
just measure it. You get this right here and then you measure it from the bottom up, from the top down, it's going to be the exact same pip amount. Pip is the point in percentage. So you measure that move in pips. In fighters, If they were to be fighting, oh, he knocked them down and he stayed down for, for example, if you were to measure this, he stayed down for 50 seconds. But in trading, this move went down 50 points. Now, this is not correlated with time, but this is just how you measure the length
of the move. In fighting, you measure the length of the knockdown based off of how long he was down for, for example. And I'm sure there's many different analogies that I can put to It, but it's just the first one that comes to mind. PIP is the point of percentage. It is the measurement that the market has. So, let's say a market goes, let's say you want to buy this market from this point right here to this point. You're aiming for 40 points. This 40 points is what the market is going to do. Now you
risk behind like the you base your trade based off of these points. So let's say you want to risk $100. So if you risk $100 per Point, you just do 100 times 40 and then you can go ahead and see how much profits you're going to be making. So for example, let's say we're going to have this buy position, right? So this buy position and I know I I can get this lit later into the actual technical parts when we get to the market, but let's say right here our stop loss is 20 points, right?
20 pips. If we want to risk $500, we then go to our position size calculator. We can go to on 1xtrade.com. We can go to lq.com. They all have these cool position size calculators where you can pretty much base your account balance. And then from there, you can actually tell your lots, the lot size, and all that, which I'll get into that later into the actual video. But here, basically, you would tell, okay, so this has 20 pips down, and then this has 36 pips to the upside. That's how you measure how long your stop
loss is going to be. and how long Your takerit is going to be. Pretty much the tool actually measures it for you, but this tool also measures it for you for whatever reason you want to measure this zoom in option. Uh I I don't really know what it is. I'm going to click on it right now for the first time. Oh, I guess it's whenever you want to Oh, okay. So, I guess whenever you want to really like zoom into a piece of market, you can just get that tool. It's a pretty cool tool. And
then I guess this Is whenever you want to zoom out of it pretty much, but I've never really used it. Not really interested. This magnet. I have no idea what it's used for. This I have no idea what it's used for. This is for whenever you want to lock your drawings. I never really use this option, but I do use this option sometimes, which is where you want to hide all the drawings because sometimes when you're looking at the market, for example, let's say like my NZDUSD, like I have a lot of notes sometimes placed
on the markets. And if I want to just remove all of these different noise that I have from my notes, I just look at the market for what it is. And don't worry, all those notes that I have there, I'm going to be educating you guys on what they are throughout the video. So, don't try and pause it and sneak in and zoom into it. Trust me, if you try and take the short way, you're going to you're going to confuse yourself because you're Not going to be educated on that information. Correct. So, this tool
right here is just to pretty much hide all of the options for however long you want it. This is going to be the I don't even know what this is. This is the sync drawing options. I've never used it. And then this is the the delete button if you want to go ahead and delete your drawings. And then after you favored every single one of these tools that I've just explained right now, all you Have to do is put a star and then this tool kit pops up and down. Moving on to this top section
over here is where we have the actual currency market that we're interested in trading. Once again, this is just another time frame that is telling you whether it's reflecting from here. This is the server that you are in. So you can either be in the end the server how I am now or whatever server you decide to pick. This is the color of the symbol that you have, the flag that You have on it. And these are just more settings that you can have and curious features on it, which I never really use. This area
up here, I have no idea what this is. I guess this is the measurement of the path or the tool whenever it goes on Trading View, but I never ever look at these numbers. I just think it looks cool whenever I move it fast, how fast it also moves alongside with it. This option right here is the exact same thing. As you can tell, it Just moves whenever I move the the path tool, but I don't really ever use it. This right here is if you want to demo sell or demo buy into the market,
which you could do that, but I've already explained that it's best to go ahead and do that on Trading View just because it's a lot easier. Uh, I mean, you can go ahead and do that within the broker and Metatrader because you can take it with you on your phone. It's pretty self-explanatory. And then this option Right here is where you can hide your indicators that you're going to be using, which the only two indicators you need to be using is going to be the EMA and the no gap candlesticks. So, everything I just educated
you guys on right now is going to be Trading View, right? I get it. There's a lot of buttons. There's a lot of volume. But now that you look at it and you understand it, it really isn't that complicated. All you really need are These tools that you have up here. And that's pretty much it. You don't even need to click this button right here for the alert. You can just click right here on the right hand side. Whenever you want to search up a market, you just simply type it on the keyboard. And whenever
you type it, it should just pop right up and then it comes over here to the side. All of this other information is literally just information overload and you don't need to know any of that Stuff. So, this right here is Trading View. This is where you're going to spend 90% of your time, if not 95% of your time when it comes to actually executing the analysis of the market, and you're going to determine if you're interested in buying or selling. But at no point are you actually going to buy and sell off of this
market. You're never going to deposit into this platform right here. This is just where you look at the market. Then you have The broker where you deposit the funds and then the broker creates the MT5 account where you go and execute the trade. This everything right here are just simply the trading tools and platforms that you need to have when you are trading in the markets. Believe me, I wish I had these markets when I started trading because personally, I had so much unnecessary information on my charts that just simply cluttered my time and it
wasted me from actually Focusing on things that do matter and that's practicing a strategy, not trying to figure out what every single feature inside of Trading View was and if there was these different hidden secret websites that were going to lead me to understand if something was ready to buy or not. So, in this little zap right here, this is basically the latest update of the market. every single market will have that little lightning just shows you where the market is at That very moment. Obviously, this is where these markets are and it just gives
you like the latest updates on it, but I never click on that either at all. These are just cool little features that Trading View has to offer. And if I didn't show it, this little lightning right here, it's just the latest updates of the market pretty much. So, once again, all you need is Trading View to analyze the markets. You need a broker to deposit your funds. I recommend LQ Markets or I recommend 1xtrade.com. And then the only other platform that you're going to need from that is maybe and if anything Forex Factory for you
to understand if there is fundamentals that are going to be happening. Now later into this video I'm going to explain what fundamentals are good for and how you can actually leverage that into a profitable strategy. So we'll break all that down into the future. All right. So now that you understand how Trading View Works, we're going to go back to MetaTrader 5, but I'm going to show it to you here on the actual Trading View just because I can show you everything on one spot. So I know we're going back and forth. So bear with
me. have some patience because I'm trying to explain to you every single feature of trading all inside of the same section so you guys can know exactly how to use it all. So, this right here is probably when you were looking at Metatrader 5 on your Phone and you were probably a little bit confused whether you were ready to actually either place a market instant execution, you're probably curious on what's a buy limit, sell limit, buy stop, sell stop, and these other pending orders that are right here. So, this is once you are ready to
go ahead and execute the trade. So, let's say you're looking at NZD JPY, for example, and you're ready to go ahead and execute that trade and you're ready to place Either a buy or a sell. So, if you want to place a buy or a sell based off of where the market is exactly right now, you would just go ahead go to market execution. You would put your stop loss and then you would put your takeprofit and then you would immediately take the trade. So, if you were to put your takeprofit, it would look something
like this. And then if you would put your stop loss, it would look something like this. All you would have to do is come To the MetaTrader 4 or the MetaTrader 5 app and then all you would have to do is just place the stop-loss numbers and place the takerit numbers. So the stop loss number for example right here it would be on this trade for example you were to look at it on this section you could look at either on the right hand section or you could just double click on it. You go to
inputs and your stop loss is 87.670. So you would go over here, you would Bring up your MetaTrader 5, and then you would go ahead and implement right here in your stop loss the numbers that you see right here. So your stop-loss level is going to be 87.670. 87.670. And then you would go ahead and place your takerit. So your takerit is the green area. And then on this takerit area, you would go ahead and put 88736. So take profit, you would put 88736. So then this right here would be your Take profit positions. Then
after that you have the deviation which I have absolutely no idea what that is. I have never placed anything on that button right there. All I know is whenever I want to trade whenever I want to take a trade live based off of where the market is, I go ahead I place my stop loss. I place my takeprofit and then I click buy. Now before I click buy, I need to make sure that I can calculate my risk on the position. So if you notice here, This lot size is going to be 0.05. Now, you're
probably wondering, Alex, what does that mean? What is a lot size? How does that work? Well, it's actually very simple. Your lot size is what's going to determine the actual risk on the position that you're going to be taking. So, if you want to risk a $100 inside of this trade right here, right? So, for example, let's say you have a $1,000 trading account, right? Your balance on the account is $1,000. You Deposited $1,000 inside of 1x trade. So on your MetaTrader 5, it says $1,000, but out of those $1,000, you want to only risk
50 bucks, right? That is what you are okay with risking on this position right here. All right, cool. That's a great percentage based off of your account. And this trade, you're going to be risking $50 to potentially gain $100. That is a positive risk-to-reward ratio. Now, how do you calculate that lot size that you need to Go ahead and place into your position? Because once again, this lot size that you're going to be placing right into your MetaTrader 5, that needs to go directly before you click the buy or the sell button. You can't click
buy or sell into the market until you haven't pre-calculated your lot size. Now, determining your lot size is extremely easy. So, you can come over here to 1xtrade.com. You can go to their lots size calculator or you can go to LQ Markets and you can go to their position size calculator, whichever one you like best. And let's say right here you're going to put your account balance. So let's say your account balance is $1,000 for the example that we're using right now. And you want to risk 50 bucks. So 50 bucks is 5% of your
account. And let's say your stop loss in pips is going to be a total of 35 pips. For example, let's say we go back to this trade right here. And this is a 30 pip Stop loss. So as you can tell, this is a 30 point stop loss. This number right here amount 750. I have no idea what it is. This percentage, I have no idea what it is. And this stop 0307, I have no idea what it is. All I know is that this number right here, 30.7 is the amount of pips on this
actual position. So, let's say this trade is actually a total of 30 pips. All right, cool. Now, I know for the takerit, I'm targeting to have 61 pips. Now, I don't Know what this percentage is, and I don't know what this target is. All I know is that this is the pips for the takerit. This is the pips for my stop loss. And my risk-to-reward ratio is A2. I don't know what this quantity is. And I know this open P&L is going to tell me how many pips I am in draw down or how many
pips I am in profit. Is this fluctuates depending how price is moving. But I set the time of us taking this trade right at this point right There. This is going to be my pip count for the stop loss. All I have to do is come back to my lot size calculator. My pip size is going to be 30 amount, 30 pips. And then what currency pair are we going to be trading? So this currency pair that we're going to be trading is NZD JPY. The New Zealand dollar versus the Japanese yen. So all I
have to do is type here NZD JPY. NZD. One second. Oh, I guess we have to look through it like this. We type it in. Doesn't pop up. We could just look for it. Boom. Boom. Boom. And it's probably organized in order. There's so many different currency pairs right here. NZDJPY. And then all I have to click after that is just simply calculate risk. Now, my lot size in order for me to risk $50 with my $1,000 account and a 30 pip stop-loss is 0.17. Now this trade right here as soon as I Am going
to go enter the trade when I go place my stop loss all I have to do is put 0.17 on this lot size. I put the number of my actual stop-loss 87.650 right here and then I put my takeprofit which is going to be 88.570 at this point right here. And then I click buy at no matter what happens in this market. Trump could come out with the craziest tweets. another Corona virus, uh, another anything pandemic Could happen. This can have a massive candlestick to the downside like this or a massive candlestick to the upside
like this. The most I will ever lose on this position is going to be those $50. Why? Because I have a stop-loss and I have it calculated with the lot size. So, I know exactly how much I am risking on this position. As soon as I am entering this market, that is exactly what I am going to be risking. I will not lose any more than what I have pre-calculated here. And I will not gain more than what I have pre-calculated here. As soon as the market comes to this area, the market will automatically take
me out at my stop loss at this point right here. As soon as the market comes up to this area over here, the market will automatically take me out at this area right here. The beauty of this right here is that you know exactly how much you are risking to exactly how much you can potentially gain. There is no random outcome. There Is no uncertainty what can potentially happen. You know exactly what is going to happen. So MetaTrader 5 when you are going to go execute your position and an instant execution you have to just
make sure that you simply just click zero. You simply just place your stop loss you place your takeprofit and you calculate your risk. Then you click the buy or the sell button. Now the only difference in between instant execution, buy limit, sell limit, buy stop, sell stop, buy Stop limit and sell stop limit is that you pretty much predict or you place the area where you want for the market to enter you right away. So a buy stop is an order placed above a current price and you're basically going to be entered into the trade
as soon as the market gets to that point. So for example, let's say I place a buy stop order, right? So let's say we want to place a buy stop. I would place the market right here. So as soon as I click the buy stop Option, there's only one tab more that's going to open and that's the area where you want to place where where you want to place the price. So this is where you want to place the price. So this price is going to be at 88145. So you are telling Metatrader 5 that
whenever the market gets to this price 88145 the market is going to immediately enter you the position. So this is if you have to go to work or you have to go to the Gym or you have to go to sleep. Whenever the market breaks through this area it's going to automatically enter you into the position with your pre-calculated stop-loss with your pre-calculated take-profit. Everything is exactly the same. The only difference is that you are literally just placing price whenever and if price ever gets there, it's going to enter it automatically for you. That's pretty
much it. When it comes to a sell stop, it's the exact Same thing, but just to the downside. Let's say you want to sell this market, but you don't want to sell this market right here, and you see yourself that you're going to be having a long day at work or a long day outside of the office, but you know, once price breaks this area, you would be interested in executing the position. Okay, cool. So you just simply place a sell stop and as soon as price is below that current price and that's where you're
going to Be immediately entered into the position as if you were to be executing the market at that point. And then you have what is called a sell limit and a buy limit. So it's an order placed above the current market price anticipating that it's going to fall. And a buy limit is basically you're placing a limit below the current market price while the market and you're anticipating for it to rise. So let's say at this price right here, you want to go ahead and you want To place a sell limit. Now for you to
place this sell limit, let's say you want price to get to this point right here. Let's say you want market to get to 88.277. Once price gets to this area right here, you're going to enter the market as a sell. So let's say you identify this to be a very strong level of resistance. Whenever the market gets there, you want to be immediately entered into a sell. Once again, you predetermine your stop Loss. You predetermine your takeprofit. You just see yourself that you're going to be busy and you can't place the limit and it places
it for you. The buy limit is pretty much the same. It's just vice versa. So, let's say you don't want to buy right here because it is way too high and you want the market to buy at this point right here. You see price is going to have a reaction from this area from we're going to double click this area. It's going to be 87.723. Okay, cool. So, whenever price makes it to this area and if it has a dip down into this area, it's going to automatically enter you into the buy position. Let's say
the market continues to go down. Well, you entered the market at that position. That's why I don't like using these pending orders because the momentum coming into these zones could be very strong. And if you were just to be watching the market live, you could probably avoid a loss because Price can come very strong into this area and within the same candlestick or within the same minute go straight to your stop loss. And just because you entered it off of a specific zone, you simply got stopped out. But if you were probably watching the market
live as it was having that deep retracement, you'd probably be like, you know what, I'm going to wait for this momentum to slow down a little bit to see if I can get a better entry. and then there you can Potentially avoid a a loss or even get a better entry all the way down here. Instead of using these pending order limits that basically execute the trade for you, I would much rather use my alarms. So, I put an alarm at these specific areas and once price gets there, I will then be looking at the
market to see if I'm interested in executing the trade. Now, I did this while I was working at Dunkin Donuts. I worked at Dunkin Donuts for a couple of Years and I had multiple different jobs and at no point did I put these limit orders as the decision maker to enter the trade for me. I wanted to make sure that I am entering the trade based off of a real confluence that I am actually having. At no point did I want to enter the trade just based off of momentum. And if that doesn't make sense
right now, don't worry. I'm going to be explaining all that later when we actually get into the actual strategy. But that is exactly what these limit orders are and pretty much how they work. And then the only difference in between a buy stop limits and then a sell stop limit is that you can pretty much just place it limits at these types of orders. So you can either place a sell limit or a buy limit or you can place a limit on these orders as well. Pretty much the same thing. You're just setting different limits.
But I can guarantee you if you want to use my Profitable strategy and everything I'm going to be teaching you inside of this video and every other video that I've created, at no point do I ever use any of these right here. But I do have to educate you on it because sometimes temptation might be there just in case if you are busy and you want to just place a limit in the event that you know you're not going to be in front of the markets. I think it's just a lot. Okay, so now that
you guys understand exactly How a buy stop and a sell stop works. You guys understand a buy stop was when it breaks through, sell stop when it breaks through, and how these limit orders work, let me actually just go ahead and show you over here back on Metatrigger 5 once again. Right? So here we have our 100 bucks that we just deposited. We're going to go back over to the currency market. So let's say for example, we want to go ahead and trade EuroUSD. Right? So we click on this Trade button for us to actually
execute the trade. Now once again just taking a quick step back on this EuroUSD trade. If you click on chart the chart will pop up. If on the EuroUSD trade we click details details will pop up. And then if you were to click on statistics statistics will pop up. The only button that we will ever really be using is just going to be the trade button. So we can go ahead and click the trade button. So we want to make sure that we are Going to do a instant execution on this market. So we can
execute the trade right now where the market is at this point. So if I were to go ahead and take you to the EuroUSD chart. So from the last time that we spoke, the market has moved a bit. So this market right now on EuroUSD is for example, let's say at this area right around over here. So if we would have actually entered the trade where I placed it last week when I was recording this video, we would have Actually won this trade. This would have been a beautiful win from the market where we were
actually executing the trade. But we're up over here now, right? So, this trade is having some pretty pretty clean momentum and say you want to buy this market. So, we're going to go ahead and go to MetaTrader 5. We're just going to put a 0.01, which is the smallest lot size that you can possibly put. And we're just going to put market execution. Let's say we want To buy this trade at this point right here. Let's put our stop loss very tight at this point. And let's put our takerit very tight to this point right
here. So, our stop loss is 1.18001. But our stop loss 1.18001 [Music] and our takerit is going to be 1.18 1.18308 and we simply just click buy and that's it. We're into the market now. As you can see as soon as we enter the market We are in some draw down in this position. Now this position is once again is in draw down because we are obviously having a cost to enter this trade which we are having some fee some spread and as you can tell that fee in that spread it pretty much was already
gone because the trade is in momentum and we're going into profit and once you start making profit those fees are pretty much you don't even see them anymore right so this trade right here If you were to want to close it you can just tap on it and you can click close position you can modify position go to chart or click on bulk operations. Right here, you can see your exact stop-loss once again to the bottom left corner of this pop-up tab. You can then see your takerit, the time, and the swap. The swap is
the cost for you holding the position overnight or over the weekend. And the fee of that would just pop up there. So, you have an idea on how much Actual profit you are in this position. So, at this very moment, once you enter a trade, you pretty much just have to set and forget and let the trade do its thing. You either let the trade hit your stop loss or let the trade hit your takeprofit. Now, later on into this video when I'm I'm going to actually teach you a strategy on how you actually exe
execute these trades at the right areas. You're going to know when exactly to enter and how to manage your trade Because a lot of traders, they maybe know how to analyze the markets. But the reason why they're not profitable is because they don't know how to properly manage a trade. And I want to educate you guys on different ways of actual trading first before you actually know how to manage a trade. because you first need to learn how to trade before you can learn how to manage it. And while me, I was just talking and
explaining that, you can just see how we went from Being negative 20 cents to pretty much now being break even or positive 2 to 3 cents. Now, if I were to want to close this position, all I would have to do once again is just click on that close. Click on the tab of the actual trade. I could go ahead and click close. And at this point, I would just click close, that orange bar that has just popped up there, and it would say you would close with 13 cents in a loss. Now, if you
don't want to close in a loss, you can Just wait. And if you want to modify your position, you can just click on modify. And let's say for whatever reason, you want to open your stop loss and make it a little bit bigger, you can just simply modify your stop loss. So, let's say you want your stop loss to be 1.17966. All you have to do is click modify and you come here modify 1.17966 and then you just click modify and then you stay in the exact same position. You Just simply modify your take profit.
Let's say once again you want to modify your your stop loss. Let's say you want to modify your takeprofit to this area over here. Cool. Not a problem. You simply get this and now your new take profit is 1.1413. It's always good to double triple check because these numbers literally determine your profits. Click modify and now your trade is modified. You don't get moved into the position. You don't Get entered into a new position. You are just simply modifying your position after you have entered it. So this right here is every single button that you're
really going to be using when it comes to the MetaTrader 5. Once you're in the position, once you click on trade, it could just give you the option to add another position. If you were to click chart, it's going to take you to the actual chart on MetaTrader 5. Just so you can actually see where your stop Loss is on the chart, which would be at this area right here. Gives you a real representation of where it is. And then where your takerit is, it gives you a real representation of where it is. If you
were to click bulk operations, if let's say you were to have many positions available, this would enter you in all of these positions at the same time. So let's say I agree to the terms and conditions. I click on bulk operations. I can close all positions. Close all losing positions, close all buys in position, close. It just depends how many positions you have open. You can customize the execution that you want to do at this point. Personally, myself, whenever I actually go close a position, I usually tend to have multiple lots open simply because I
have a lot of trades at the same time, I just click close all positions and it'll close them all at the exact same time. I don't have to go manually one by one and Then click close. It just saves me about 10 seconds. That's really it. So that's pretty much every single feature when it comes to this MetaTrader 5. The last one and most creative one is I say you want to not close the whole entire position. Let's say you want to close partial. Now this would only work if we were to be in this
position for more than 0.01 lots. For example, let's say we would be in this position 0.10 and you want to close half of your Position. You can simply come into here and close 0.05 05 and then you click close and then you would be closing 50% of your position. So this is every single feature that it comes to actually executing a trade with straight market execution. Let's say you want to enter a trade and then you actually have a buy limit for example. So let's say we we want to have a buy limit on this
market and we want the limit to be based off of this area right here. So for now let's Get rid of this risk-to-reward tool. We want to enter the market once the market hits this price point right here. So that's going to be the entry price is 1.18120. So price will be 1.18120. Stop loss is going to be 1.1 7879. And then your takerit is going to be 1.8 28 361. All you have to do is just simply click Place. And that is it. So now, as you can tell, you're not in profit or in
draw down. What you have placed is a market execution. So once the market comes into this area, it will automatically enter the position while you're anticipating for it to go up. It could come into this area and then keep continue going to the downside, but just depends on the type of order that you have placed, it will execute you into that market. This right here is great For people once again that aren't available to be in front of the markets all of the time. And if for whatever reason after you place the limit, it's been
hours and the trade hasn't been executed, all you simply have to do is click it and you can delete the order that you have placed or you can modify. You can either change your stop-loss, you can change your entry price, change your takerit or you can just delete it as a whole. So if you were to delete it, You just click on the delete button. It's going to give you the confirmation and then you go to the history tab and on the history tab it should pop up like an order that you had in in
the past or no since it was in a position it won't pop up when you actually close a position like this one. Let's say we close it right now at 50 cents in a loss. We can see it over here how this was a position that we entered and how it has actually closed. So this right Here is pretty much every single feature inside of MetaTrader 5. And when you go withdraw your funds from MetaTrader 5, you don't actually withdraw your funds from MetaTrader 5. You withdraw it from the broker that you are going to
be trading. And then that broker will reflect that price on the actual MetaTrader 5. And now, for example, let's say that we want to go ahead and withdraw our $99, right? Because we lost the position, we're not happy about it, And we just want to get the money back. You can't withdraw Metatrader 5. Metatrader 5 is not the broker. You need to make sure that you go to the broker so you can go ahead and actually withdraw your funds. So remember MetaTrader 5 is the platform where you are going to execute the position. Anything related
to the money in or out of the actual platform is going to be on the broker. So the money is reflected on MetaTrader 5 for you to actually place The trades. But when you want to withdraw the money, you have to go back to the broker and request the withdraw from the broker. Once you withdraw the funds, it's going to reflect on MetaTrader 5. And then from there, you're going to go ahead and do whatever with the funds once you have withdrawn them. But MetaTrader 5 never has your funds. They don't get access to your
funds. They're just a a platform that just shows the trades and shows the Profit and loss pretty much. But where the funds actually are are within the broker that you're going to be using, whether it be 1x trade or it be LQ Markets. So, with that being said, that is pretty much everything when it comes to market orders, uh, and how to actually take a trade, how to place these orders, every single feature inside of MetaTrader 4, Metatrader 5. Now, I want to get into actual types of trading. I want to educate you guys on
Fundamental trading. I want to educate you guys on technical trading and how I personally do it. So, within this video, you guys can go ahead and actually start to begin executing trades by the end of it. Now, if you guys aren't subscribed, make sure you guys hit that subscribe button. This is one of the many videos that I'm being created for you guys. So, if you guys aren't subscribed to the channel, you're going to be missing out on a bunch of videos, including other Valuable ones like this one. So, hit that subscribe button. It doesn't
cost you anything. And personally, I believe this is going to be one of the best videos that you're going to have in order for you to learn trading from zero to 100. So, with that being said, let's continue. So, now that you understand all that, let's move on to our next subject, which is going to be fundamental analysis. Now, before I get into fundamental analysis, we already Know what technical analysis is. This is when for you to determine if you want to buy or sell the market. You're going to focus your analysis on the candlesticks,
on price action, which you're going to be reading the candles. You're you're going to be reading the candlesticks going to the upside or to the downside. That's where you're going to make a decision whether you want to buy or sell the market. It's all going to be based off of reading the charts, reading the Candlesticks, reading technical analysis, price action. It's all the same thing for you to determine if you want to buy or sell the market based off of technical analysis, price action, or candlesticks. This is what it's going to be. Now, let's say
you want to base your trade, if you want to buy or sell the market off of fundamental analysis. This is focused on when you read the underlying articles of either a company that can directly reflect the price of a Currency, the underlying writing of a economy on a country, a news event or just the economy as a whole of the country that directly reflects on the currency. So fundamental analysis trading is exactly what it is. You are reading the fundamentals in order for you to determine if you are interested in entering a buy or entering
a sell. You're basically going to go out there and find different articles of a certain country and see the previous times that Articles similar to this reflected the price. And then there you're going to determine if it's a good time to buy or if a good time to sell. At no point do you ever go to the actual technical charts for you to determine if you want to buy or sell the market. That's what technical trading is for. So fundamental analysis traders are a bit more on the higher time frames because they're just using the
overall direction of where the economy should be going and then they Make the decision based off of that. For example, if they cut interest rates, the dollar should get stronger or weaker. Or if they start printing more money, the dollar gets stronger or weaker and then they base their trade off of that. Now, this is a lot more long-term way of trading. But some traders have gotten very creative and they've combined both of these as a whole. So they will do their main technical analysis off of price action and then as they're going To go
into the trade, they go and check out if there is certain fundamental analysis or certain fundamentals coming out to see if it can add a certain confluence to the trade. For example, let's say we would be using Forex Factory as one of these examples. Right now it's Wednesday, September 17th. And at the time of us trading today at 2:00 in the morning, there was going to be well, tomorrow at 2:00 in the morning, there's going to be GBP news. And let's Say, for example, that I'm interested in trading the Great British pound. I can go
ahead and look into this news article. And this is going to have everything is this is basically everything that the forecast is going to potentially be. These are the other dates that it's had a very similar news event to this day. This is what they forecasted. This is what it was previously and this is what actually happened. If you notice it was Forecasted to be one point up. It was actually two points up from the previous one. I'm sure that had a very minimal impact in the market. If you want to go and verify that
you can just go to this date on any great British pound market and then you can see if it actually had some type of effect. The CPI news sometimes work. So they they sometimes do this, sometimes don't. Personally, in my opinion, from my last four years of really like doubling down and becoming a Better trader, I'd say 80% of the time, the actual fundamentals, follow the technical analysis. So, whatever you properly understand with price action, right? Cuz this is the big thing like you need to properly know how to read price action. Now, I'm not
saying you need to properly have a strategy for you to deter for you to have accuracy with the news. No, that's that's not what I'm saying. I'm saying if you know how to read price action, you can be a scalper, A day trader, swing trader, you can be whatever type of trader, but as long as you know how to read price action correctly, you can determine if something is bullish or bearish. The news 70% of the time will follow the trend of where the price action dictates. That is a simple fact right now. I'm not
saying if you have my strategy or if you trade with my strategy that the fundamentals will follow that strategy. No, no, no. I'm Not saying that. I'm just saying that the fundamentals will follow the overall trend of price action. And some people wrongfully analyze the trend. So fundamentals are just simply news events that come out every single day on each currency. You have some news events like CPI. You have some new news events like BOC rate, overnight rates, press conferences, FOMC, which tends to be one of the biggest ones. Then we also have unemployment. We
have NFP, official bank Rates. These are all different types of news events that affect the currency of that country. So for example, let's say that I am interested in taking a trade on USDCHF or let's say US Euro USD for example on Wednesday like okay we do have minor news events at 3:30 in the morning on the euro. H does it make sense to take the trade? Sure. Or you know what I want to sit on the side because I don't know what the president is going to say and it might affect the Currency very
significantly. And let's say I'm interested in taking the trade at on, you know, Euro USD and I don't find the trade in the morning, in the afternoon. I say, okay, you know what? I'm going to use these news events in my favor. I'm going to use it to actually get out of the trade. Personally, in my experience from trading, I tried so hard to figure this out and try to find a potential edge on reading the market. And the truth of the matter is that There is no real edge. The news are going to have
their news event flashes no matter what. There's some events where they're going to have major moves to the upside, major moves to the downside, and some like it's it just it's going to do what it's going to do. Whenever news events come out, the brokers mark up their spreads and their fees just because that's what goes down in those news events. A lot of money gets moved because the big banks and the Big institutions, they get scared. They don't know if the federal funds rates are going to get cut in their favor or against them.
And then based off of that, they're going to move the money around, which in turn affects the liquidity that the brokers get, which then they have to change and modify the spread. So then they aren't negative on the business. It's just the news events are a whole mess, right? And so many different things get moved around when These news events are happening. that is so much that is out of your control that in my opinion it just logically makes more sense to just focus on something that matters something that you can actually look at and
you can see patterns in the past and that's simply going to be the charts. If a news event comes out and it does this move, so be it. It's not going to be every single day or every single week that you're going to have a news event like this go In your favor or against your trade. There's going to be weeks where it's going to be like this, a pretty big wick, and then it's going to go in your favor or against your favor. It can happen once or two times a month. It is what
it is. It's part of the process. There's no way that I am going to modify my trading approach simply because of a news event that actually has an impact one or two times a month. The best way that I can put the analogies based off Of my experience and the way that I trade and how I'm going to teach you right now is almost like if a real estate investor would were to be investing into real estate, but occasionally he cannot see certain pieces of real estate and it's just a big mystery box. Now, as
a real estate investor, will you sometimes take the risk and buy this random mystery box? Sure. But sometimes these mystery boxes have good deals. Sometimes they have Terrible deals. But you're not going to make your whole entire real estate investment based off of something that is blind, something that you can't see. You want to make sure that you can actually look at the patterns. You can see the same thing over and over again so you can actually make a strategy based off of your approach. Now, is there some times where what's inside of this mystery
box could be a great thing? Yes. But I don't know about you, but if I were to be a real estate investor, I want to make sure that I can see my property before I buy it. I want to make sure that I can go walk inside of it and I can at least have an idea of what I'm putting my money into. Now, if I were to go ahead and actually buy this real estate property, but one of the rooms inside of them happens to be a mystery door and I don't know what's inside
of that door. It could either be really good or really bad for the property. At Least I have some type of context that the overall property is good. I have an idea that 70% 80% of the investment actually makes sense. And then the other percentage just simply is an add-on. If it's good, it's okay. And if it's not, it's still okay because I know that the actual core base of the foundation of the decision towards that investment was great. That's exactly what trading with fundamentals is. If you want to go ahead and take a decision
just based off of The fundamentals, it's almost like a mystery box because you never really know how these news events are go like you never know what they're going to say and then nonetheless how the market is going to react to it. I've had many many times where I have had a lot of analysis on a fundamentals and I have read it and I personally believe that the market was going to like I would have reacted a certain way to those fundamentals but then the market reacted a completely Different way. So, one thing is what
I personally would do with that information. Another thing is what the market would do. Or the other thing that you can do is potentially have your whole entire technical analysis, have your price action, and then just have a piece of it be a bit of a mystery. So, like let's say I enter the trade at 1:00 in the afternoon, for example, and then the news events are going to come out at 2. Okay, that can add to my trade or it Can potentially make it worse. But what I guarantee you is that if you're making
a logical trade decision based off of price action and you're following the strategy and you're actually executing the trade with proper price action analysis, the fundamentals the majority of the time is going to go in your favor. And trading the fundamentals alone is simply going to be a neverending journey of you attempting to predict what is going to happen next and How the market is going to react. Two very, very, very big variables that are completely out of your control and you cannot see any patterns. And truthfully, in my opinion, I just think it's a
lot easier to actually have a very clear vision of the type of investment that you're making with whatever type of trade that you're going to be taking. So fundamental trading to me is just simply a mystery box. And if you make a logical trade analysis decision, this is just Simply going to be an added confluence to it. But if you want to go ahead and dive into a rabbit hole when it comes to fundamentals, please go to f4 forexfactory.com. They've been around for tens of years and they give you as accurate as it's going to
get to the information. They give you what they potentially believe it's going to be, what it was previously, and then after the event actually happens, what it actually was. But after it happens, it's No good because the move has already happened in the market. You can't obviously go back into the past to enter your trade. Now, with that being said, you understand how the fundamentals work and that it's just really a mystery box. But you're probably asking me, "Okay, Alex, so how does price action work? How do I actually know if something is bullish or
bearish? How can I actually read and understand the market? So, I'm going to be teaching you guys right now How to read the candlesticks, how to read these patterns, how to identify if something is bullish or bearish, how to do a proper top down analysis, what is market structure, just everything when it comes to this market that I'm going to be showing you guys right now. So, this is where things are going to start getting serious because once I actually teach you how market structure works, then I'm going to teach you the strategy on how
you can actually execute the Trades on this market. So, if there's a moment to pay attention and to be locked in and to actually be focused and be ready to write down notes is going to be this. If you're driving, if you're at work, if you're at an social event, if you're anywhere but in your office or wherever it is that you had and focus on learning, stop this video and come back when you're ready. It's just going to make more sense for you to rewatch the video once you've already understood it Properly the first
time rather than you just hearing it in the background and then you go ahead and hear it again and then you have to go ahead and hear it again. It's better if you pay attention the first time so everything connects right from the start and you use your time efficiently while you're learning. You don't want to just be having this in the background for no reason, right? So, let's first start off with what is price action, right? So, price action is Literally what you're looking at right here. Price action is all of these candlesticks going
up and down. Price action is these points where the market hits, it bounces from, and it bounces up and down. All of this right here is price action. Price action is when the market goes up and down. Now, price action can be reflected either in these candlestick formats or in the line chart as you guys already know. Now, price action is what's going to tell you if This market is bullish or bearish. So price action pretty much equals the chart which equals the history which equals almost the heartbeat or the fight. These are all the
same exact thing. Price action is everything. Literally the whole entire market is based off of price action. Price action is the candlesticks. It's price. It's the trail. It's the history. It's just like the market. It's almost like saying like the road for you to get To one spot to the next area. Like what gets you there is the road. What connects one place to another is the road. The pavement, the concrete, the the signs, the the highways, all of that is just at the end of the day the road. This is exactly what this is.
This is the road to the market. This is the market leaving its trail. Price action is just literally everything. Now, price action can be seen in two different ways. One, the line chart, or two, the Candlestick chart. Now, I know we already know that we're going to be using both of these with one another. And I'm almost going to teach you something to then go ahead and unteach it to you. Right? So price action is needed to determine if the market is bullish or bearish. The only way for you to understand, and you guys can
go ahead and write this down. There's a lot of things that I'm going to say that I Might not type, but you guys should definitely be writing it down. Is the only way for you to determine if price action or the market or the chart or the trend or whatever is bullish or bearish is with the candlestick and the line chart is with price action. The only way for you to determine if the market is either in a bearish market or in a bullish market is going to be with price action. There is no other
way that you can tell if the market is bullish or Bearish without price action. The fundamentals will never tell you if the market is bullish or bearish. The indicators will never tell you if the market is bullish or bearish. No crossover, no Ballinger bands, all these stuff I'm going to teach you later into the future. But no indicator, no pattern, nothing will ever teach you if something is bullish or bearish like price action. Price action is going to be the end all be all area section where It's going to tell you if something is bullish
or bearish. Everything that is out there in the market that is added on top of price action, it's exactly that. It's an add-on to price action. Indicators are an add-on to price action. Tools are an add-on to price action. Um, any possible EMA is an add-on to price action. Any reversal pattern is an add-on to price action. Price action is the core. And I'm repeating this because I need you guys To really understand and get this because once you get this, you get everything. As soon as you understand the proper market structure based off of
price action, it is everything. Right? So now that you understand that price action is everything and price action is needed to determine if the market is bullish or bearish. The market determines if it's bullish or bearish based off of market structure. So market structure is What's going to let you know if this market is actually indeed bullish or if it's going to be bearish. Market structure is everything. Market structure is every single elbow that you see in this market. every single triangle, every single reversal point, every single pointy section, every single point where the market
had a move to the opposite direction. This is going to be considered market structure. So this is almost like the red lights. This Is almost like the turns in the street lights. This these are the curves. These are the entry and exit points of the highways. These are all of the stop signs. These are all of the turning lanes. This is all of the mergings. This is basically every single point that connects the road with one road to another from one destination to another. The middle point is just the road. This is just the road
to get you to this point right here. Once you are at this Point right here, this is let's call it first street. Now this first street, it only has a turn to the left or to the right. And this turn to the right. This is just the full road to then second street and then back up and down. Now, this is the road. This road is just a straight road. Straight one shot to get to this street. Once you get to this stop, then you turn to the next stop. This is just a road to
then the next stop. Once you get to the next stop, Then it's just a road to the next stop. So, every single one of these structure points, look at it almost like a stop sign. Look at it like a turning light. look at it like an entry point to the next entry or getting off at the next exit. These are literally just points where the road needs to stop in order for you to then be able like let's say you want to get from this point over here to this point over here. You can't just
cross over because there's Buildings in the way. There's a lake in the middle. There's a lot of stuff going on in the middle. In order for you to get to this destination, you first need to then hit First Street. After you go to then First Street, there's a stop sign and then you need to go back up to then Second Street. And then on Second Street South, then you need to turn back into First Street North. And then on North Street first, then you actually make it to then third street. So for you To go
from this street to this street, you need to follow the ways of the road. There's no difference in between that example and then this market structure. this market structure in order for get in order from it to get let's say to this point to this point you need to follow the road in order for the market to get there. Now this is going to be crucial for you to understand how the market actually works how to determine if it's bullish or bearish. Now I'm not Saying for example right now that the live price needs to
in order for it to get to down here that it needs to break this road and stuff like this. That's not that's not what I'm saying. I'm just saying in order for you to understand how the market got from this point to this point, just follow the road and follow the structure points. The structure points are going to tell you how it actually made it to that point. So the structure points are these points Over here once again are going to be these stop signs, these turning signals, these reversal areas. These are going to be
market structure points. So market structure points, just we're just going to write this down, right? One thing at a time. Market structure points are the elbows in the market, the turning points in the market. These market structure points are where it's going to determine is bullish or bearish. So market Structure points are the elbows in the market. These are the turning points in the market and these market structure points are going to determine if the market is bullish or bearish. If you properly read every single one of these elbows, you're going to be able to
tell if the market is bullish. Right? So, I'm going to do a quick quiz on you guys right now. Right? And I expect for you guys to get this wrong. I don't expect for you to get this right. Right? Just Going to do this right here. Is this market right here bullish or is it bearish? So we understand bullish equals up, bearish equals down. Right? So the market is heading up when it's bullish. The market is heading down when it's bearish. Go ahead, pause this video and just take a wild guess. Right? Cool. So I
can almost guarantee you you're wrong. And even if you're right of the direction whether this market is up or whether this market is down, you Probably don't know exactly why, right? For example, let's say if I were to give you a very complex equation, right? Let's say I already give you this plus this for example, and then I give you multiplechoice option. Oh, for example, let's say we didn't know that, but let's say I just gave you a multiplechoice option and I give you choice number A or I give you choice number B, right? You
only have two options and you happen to just click on the right option and You're right. Now, that doesn't mean you're right because you know the solution or you know the way on how to solve the problem. You just happen to pick the right one because it's really is a 50/50. Like, it's pretty hard to get it wrong. It really the odds are split down the middle. So, that doesn't mean that you know math. method doesn't mean that you're good at it or that you should be advancing to the next point. That's exactly what this
is right here. Just because let's say you pick the right one because you know obviously there's only two option like the odds of you getting it right or wrong is pretty fair. Let's say you do get it right, you're probably not getting it right for the right reason. And that is the big problem with traders. A lot of traders happen to just guess that the market is in the right trend, but they are actually executing it wrongfully because they don't know where it's bullish or Bearish based off of. Now, let me explain what I mean
by that, right? And and we're going to leave this right here and we're going to come back to it and I'm going to educate you if and we're going to find out if you were right or wrong. So, once again, pause the video, take a screenshot, and just write it down. Bullish or bearish and then where why or where do you think it is? And if you don't even know where you identify this market that it's bullish from, then That even shows even more that you don't know anything just yet. But don't worry, I'm going
to teach you right now. It's very easy, right? So, I'm going to educate you guys right now on market structure, which is everything in the market. Right now, this market is bullish, right? This is a very clear bullish market. Now this market is bullish because it is consisted of higher highs and higher lows or also known as HH or HL. Right? Higher high is HH. HL is a higher low. So this right here is the higher high. Right? This is the highest point in the market. And this is all based off of market structure. So
if I double click this line, I go to text. just going to put hh. So we've identified this as the higher low. Now this right here is now going to be the higher low. So this higher low point from this point right here is going to be what took this from point A to point B. Right here you were At Second Street. You had to turn right, make it to First Street. Now, in order for you to make it to Third Street, from Second Street, you have to go through First Street and then you make
it to Third Street because obviously there was some trees here in the middle. There was a lake. There's a big building here. You can't just go from Second Street straight to Third Street. You need to go around the buildings and then you make it to Third Street. Cool, right? Pretty Easy, pretty self-explanatory. Now this market is bullish because of this higher high and because of this higher low. As long as we remain inside of this market structure, inside of this higher low and this higher high, this market will remain bullish. This market is bullish no
matter what as long as we are inside of this higher high and this higher low. The simplest way that I can put it is this is going to be third street and this is going to be first street. Right? We understand that. And this middle point right here is second street. Right? Very easy, very self-explanatory. As long as we are inside of first street and as long as we are inside of third street, this market is inside of first street and it's inside of third street. Right? Pretty self-explanatory. It's almost like obvious, right? Like, duh,
Alex, no [ __ ] Like, what are you talking about? Well, you'll be surprised because some people would say that right Now we are on Fifth Street. It's like, well, brother, how are we on Fifth Street if we haven't even broken through First or broken through third street? Now, this doesn't make sense. Don't worry, it's all going to start clicking in just a second, right? And I'm not going to I'm going to try and avoid the analogies too much back and forth so it doesn't confuse you guys, but we will double down on them later
into the video because it's all going to connect Perfectly, right? So, we'll put this in the back burner for now. But all we know is as long as the market is in between this higher high and this higher low, we are bullish. This right here could create a potential retracement into this area right here. And this is just a retracement. Now, once we have body candlestick closed above this previous higher high, this has now officially broken above the higher high, meaning we need to modify our higher high. So, the Rules are very simple. Once we
body close above the higher high or the higher low the market has shifted. So once I mean with the body don't worry for right now we we'll come back to that but once we have closed above the higher high or the higher low the market has shifted and you need to modify the higher high and the higher low. So once the market has broken above this higher high, you have now shifted in the market and you need to modify this higher high And this higher low. Cool. So where does the new higher high go? Where
the higher high goes to the highest high point which is going to be right here. And where does the higher low go? Does the higher low change? Yes, the higher low changes every single time the higher low changes. So the higher low is going to go to this point right here. Now this is another side note. If we have a new higher high, we will always have a new higher low. So if this market once again It creates this retracement right here and it creates this break above. If we have a new higher high, we
will always have a new higher low. So if this market has created this new higher high, it's very obvious we will always have a new higher low. Cool. So the higher low gets moved to this point right here. Now I like to use to identify the new higher low as just the previous structure point. And I'm going to get to all that in just a second. But as long as this Market continues to be inside of this higher high and this higher low, this market will remain bullish. Right? So for example, once we broke out
to this area, this over here went to then Fourth Street and this over here was at Second Street, right? Pretty self-explanatory. We broke above Fourth Street and now we are at Fifth Street, right? So this is fifth street and this over here is going to then be third street. Right? So we are using one street to get to the other Street. So for now let's remove this one cuz we're already pretty far away from over here and we don't need to be aware of that. So right now we understand that this is fifth street. This
is third street. And as long as we are in between fifth and third street we are in between fifth and third street. This right here is just Fourth Street right in the middle. Or we're at fifth. Or we're at third. We're at third and a half. We're at fourth and a half. Fourth and a Quarter. But at no points are we ever at Sixth Street or Second Street. As long as, once again, as long as we are inside of this higher high and inside of this higher low, we are bullish. Write this down as well.
As long as we are inside, we are bullish. Right? Very easy, very very self-explanatory. Now, once we have body candlestick closed above, what happens? Once we have closed above the higher high or the higher low, the market has shifted. You need to modify The higher high. Okay, cool. So, this turns into the new higher high. This will then be Sixth Street. And then where does the higher low go? It goes to this point right here, which was the last point, which is now Fourth Street. Right? Pretty easy, right? We're just kind of following the market
and we understand as long as we are inside of the higher high and higher low, we are bullish. If we make a new higher high, we will always have a new higher low. We Modify the higher low. Very easy. Now, what if I told you, you see that? There's an alarm from a market that I'm currently trading right now. And uh we're going to do this live here right now. We're just going to see how my market is moving. So, I'm actually in this position here in a major loss right now. So, this is getting
super sidetracked here and we'll go back to the market structure in just a second. But, as I am educating you guys live, I Am also trading live and this trade is into major draw down right now. Not looking good. Not looking good. And this other trade is looking good, but I need to wait for this next candlestick to close in the next 30 minutes. So, I will wait for that. So, we'll come back to the SPX500 now. Little distraction there, but it's okay. It's good, right? To show you guys how we're executing everything live, right?
So, back into this area over here, right? Let's just Move this a little bit more up. We understand that as long as we are inside of these structure points, we are going to be bullish. Now, the moment that this market structure breaks below this higher low, guess what happens? Now, this market is no longer bullish. this market is now going to be bearish. So we went from creating higher highs and higher lows to now lower highs and lower lows. So this market went from being bullish to now being bearish. So now That this market has
broken below this higher low structure point, it means that this market is now bearish. So once we break below the higher low structure point, this market is now bearish. So this goes from actually being bullish once it closes below the higher low we are now bearish. Now bearish means we are selling and a bearish market is equivalent to lower low and lower high or also known as LL or LH. Now they're Both basically exactly the same. A higher high is the highest high and a higher low is a low that is higher than the previous
low. When a market goes bearish, we have a lower low. So this right here will turn into the lower low. And then the lower high is going to be the low. That is the last high, which is going to be this point right here. Now, don't worry if this doesn't click right away. It's all going to click in just a second. Just give it some time for me to Educate you guys into this. Believe me, what I am teaching you guys right now took me months to understand. And my goal is for you to understand
in just one single video. And I'm going to do that to the best of my ability. How I have been doing this for the last 3 years on educating people. So now that we have a lower low and a lower high, this market is officially bearish. Now the same exact principle applies right here. Once we have closed above the Lower high or the lower low, the market has shifted and you need to modify this into the lower low and the lower high. If we have a new lower low, we will always have a new lower
high. As long as we are inside of the lower high, the lower low and the lower high, we are bearish. Once we break below the lower high, the structure point is now bullish. Very easy. Everything is just changing the letters. So what does it mean? Once we have closed below, so this Is going to be below instead of above. Once we have closed below the lower low, the market has shifted and you need to modify the lower low and the lower high. If we have a new lower low, we will always have a new lower
high. All right, we have a new lower low. It's very obvious it's the new lowest low. And then where is the lower high? Well, the lower high is going to be the next lower high. And I'm going to teach you a way on how to identify this market structure Point literally seamlessly and it's going to be absolutely perfect in just 1 second. I just want you guys to be able to understand the difference in between lower highs and lower lows, higher highs and higher lows. So, as long as we are inside of the lower high
and the lower low, we are bearish. Once we break below once we break above the lower high structure point this market is now bullish. So for right now as long as we remain inside of this lower high and Lower low we're going to be bearish. So this is now going to be a lower low. This is now going to be a lower high. This market can simply have a smaller retracement and then we have a new lower low and then this point right here becomes the lower high. Right? The lower high is always going to
get moved every single time we have a new lower low. Now let's say for whatever reason this market decides to now do this. Well once we break above the lower high structure Point this market is now bullish. So this market right here goes from being bearish to being bullish. So this market is now bullish. So this now gets shifted into a higher high and then this structure point over here gets shifted into a higher low. And this market once again it can have its retracement into like going like this. And now we have a new
higher high. If we have a new higher high, we have a new higher low. If we have a retracement, we have a new higher High. And then we have a new higher low. Right? So this is how the market works. Same exact thing applies if we now do this. If we break this structure point, guess what? We now have a new lower low. So this market now goes from being bullish to being bearish. So this goes and turns into the lower high and then this turns into the lower low, right? As long as this market
remains inside of this lower high and lower low, we are now bearish, right? We have a new lower Low and we have a new lower high. Very easy, very self-explanatory. So this way you can see how the market goes from being bullish to then being bearish to being back to bullish to now being back to bearish. The market is shifting constantly from bullish to now bearish. But I want to teach you guys on a trick that I like to call the snake trick. And this snake trick is a trick to identify the last structure point,
which is going to equal The higher low or lower high. Alex, what are you talking about, dude? You're talking Chinese to me. I just met you right now. I'm already 2 3 hours into this video and I still don't understand anything. Don't worry, trust me. This is all going to start slowly making sense. Right? So, we have something that is called the snake trick which is going to help you identify the last structure point which is equivalent to the higher low or the lower high. What does that Even mean? Very easy. Let's say this market
is bearish, right? And we have this retracement to this point, right? This is this right here considered a lower high? No. We can only have a lower high or a lower low once we have a new higher high or lower low. So at this point right here, this market we have yet to create a new lower low. So we have not created a new lower low in this market. So we can only have a new lower high once we have created a new lower Low. So this market right here, this is the lower high. This
is the lower low. What is this point right here that is being created into the market? What is this elbow? What is this stop sign? What is this red light? This turning point. What is this right here? This is literally just curb in the road. This is literally just a market structure point. This is literally nothing. three yet. This is just another point in the market, but it's not anything Significant because it has not broken above the lower high or below the lower low. So, we can only have a lower high or lower low once
we have broken above the higher high. And all right, lower high or higher low. Once we have broken above the higher high or lower low. Don't worry, it's all going to start clicking right now. Let's say this market actually ends up indeed breaking below. All right, cool. this market actually indeed breaks below. Guess What? Now we have a new lower low. So once we break the new lower low, if we have a new lower low, we will always have a new lower high. So if this becomes the new lower low, we always have a new
lower high. So how do you identify this lower high? Well, you identify this lower high with the snake trick. The snake trick is to be able to identify the last structure point, which is either the higher low if bullish or the lower high if bearish. So, we're Going to get the head of the snake right here. And once we get this head of the snake, we're going to start moving backwards. And this snake moving backwards is going to leave a trail, right? So, we start catching the snake. I don't know if you guys know, but
snakes pretty much just kind of move like this, right? Snakes don't really move like this if they're going to actually be moving somewhere. they actually just move straight. They try And move very seamless. And if they actually need to turn, then they will turn because there was something in their way or something was in the middle that they had to now go this way. So let's say a snake is trying to go from this point to this point over here. If there is a log in the middle or if there's an object in the middle,
the snake will simply just go around it and then continue going. But this snake is leaving a trail that obviously he had to Go around something in order to get to the destination where he was looking to go. The snake is leaving a trail of his footprint almost. It's like his trail of him leaving the leaves squashed down or whatever trails snakes leave. So a snake in this market structure right here which is the snake trick is you're following the trail of the market and as soon as the snake has to turn that is going
to be the lower high. Wherever the snake or the body turns that shows that There was something there there was something in the way and that the market had to go ahead and then turn. So the first turn of where the snake actually turns that becomes the previous structure point that becomes the lower high. So this is a trick for you to identify the previous structure point. If you cannot properly understand how to place the lower high or the higher low, we're going to use something that is called the snake trick. So once again, Right
now we are bearish. This is the lower high. This is the lower low. Let's say that this market breaks above. Let's say this becomes now bullish, right? This is now broken above the lower high. Now that we've broken above the lower high, this becomes the new higher high. So this higher high once you have a new higher high you mandatorily need to have a new higher low. So if we have a new higher high we will always have a new higher low. You guys should have this Written down somewhere. So if we have a new
higher high where is the higher low? Well I get my trusty snake trick and what I do is I create the head of the snake. And on the head of the snake I just start following the market back. And as soon as the market then turns, that right there shows me that the snake turned. There was something in the way. Now this becomes the higher low. Very easy, very, very self-explanatory, right? So this now becomes the higher Low. So we can only have a higher low once we have a new higher high. So let's say,
for example, this market does this retracement right here and then we have this push to the upside. Once if we have a new higher high, we will always have a new higher low. Cool. The higher high is always easy to put. But where is the higher low? Is it at this point or is it at this point? I don't know. Let's bring out our trusty snake trick. And our trusty snake trick as soon as it first Turns and it creates the first point. Boom. That right there is going to be the perfect higher low. And
it's the exact area where the market turned. So now this is going to be the higher low, right? Pretty easy, pretty self-explanatory. Now let's say that this market does this right here. What is this right here in the market? This right here in the market is technically nothing. This is just simply a structure point. This has not broken above or Below the higher low. So this is just structure. This is just market doing its thing. This is just a stock. This is just a little curb in the road. This is really nothing. Okay. What about
this? That right there is nothing. The market has not body candlestick close. And I'll get into the candlesticks in just a second. But the bodies or the the move the price has not closed below the higher low or above the higher high. Meaning this market right now at this Point is still nothing cuz we have not broken above this line right here or above this line right here. Cool. Cool. Cool. What about that right there? Nothing. We have not body candlestick below this line. We have not body candlestick closed above this line. What about now?
Okay, we have now officially broken below the higher low. So if we break below the higher low, this market will then turn bearish. So price will go to the lowest low. Now if we have a new Lower low, we will always have a new lower high. We can only have a lower high if we have a new lower low. So how do we identify that lower high or lower low? Well, we're going to use our trusty snake trick to be able to identify our previous structure point. So, if this right here is the new lower
low, we're going to get the head of the snake, start working our way backwards, and as soon as the market has had a turning point, boom, this turns into the lower High. The lower high is the last structure point where the market had a turning point from. So, this right here is going to turn to the lower high. Now once again, as long as we are inside of this lower high and lower low, we are going to remain bearish. And I'm going to repeat myself a lot cuz what is required here for you to understand
this market and for you to understand this new language is just repetition, repetition, and repetition. This going To have a major move like this. Cool. We've broken below the lower low. So this is now the new lower low. Where is the lower high? I don't know, but I do have my trusty snake trick. So I'm going to get the head of the snake. We start working our way backwards. Start working our way backwards and turn. Now this right here becomes the lower high. Understanding that that is now the lower high. The market could remain inside
of this lower high and this lower low. And We're going to remain bearish. This market can literally do all the structure point that it wants. As long as we are inside of this lower high and lower low, we are bearish. Right? Pretty simple, pretty self-explanatory. Now let's say this market does this. Oh [ __ ] Now what? No problem. No big deal. The market has now broken above the lower high. So guess what? We are now bullish. This becomes the higher high. And where is the higher low? Because if We have a new higher high,
we will always have a new higher low. Okay. So if we have a new higher high, where is the higher low? I don't know. Let's bring out our trusty snake trick. It's the head of the snake. We start just working our way back, working our way back and turning point. This right here is the higher low. So, our snake trick helps us identify where that higher low and where that lower high is going to be placed into the market. So, we have a Clear understanding of where the market is at this point right now. Now,
we use the line chart that we're using right now to be able to very clearly identify this structure point. So, right here, we are using the line chart to tell if something is bullish or bear. So we know that this is the higher low and that this is the higher high. As long as we remain inside of this right here, we are bullish. If we break above once again, this becomes the higher high. This Becomes the higher low. And from this point right here, we break below. This becomes the lower low. And then this becomes
a lower high. Right? Pretty self-explanatory. Just repeating the same thing in many different types of examples. Right? Cool. Now let's come back to this example right here. Right? Is this market bullish or is this market bearish? Right? Let's find out if you were right about this trade and if you were right, if you're right about the Correct point, right? Because if you have I'm going to write this down as another note. If you identify once you identify the market being bullish or bearish, you need to place the higher low, higher high, lower low. My computer
gets a little bit slow. You need to place the higher high, higher low, lower low and lower high. Want to identify the market being bullish or bearish. You could only identify that by being bullish or bearish by placing the higher High point and the higher low point. If not, the market cannot be bullish or bearish. So for examples purposes, let's begin from over here. Right? This market at this point when we are identifying this market, let's make this all the way to the left. This is the higher high and then this over here is the
higher low. Right? Do you guys agree this is the higher high in this market and that this is the higher low. Right? Very easy, very self-explanatory. As long as we are Inside of this higher high and higher low, we are bullish. Right? So, we start moving a little bit more to the right and boom, we now body candlestick close below or we just candlestick close below. This turns into the lower low. Now, if we have a new lower low, we must have a new lower high. So, where's the lower high? I don't know. Let's bring
out the trusty snake trick. This is the head of the snake. We start working our way backwards. Boom. We turn it. That Right there is our lower high. Pretty easy, pretty self-explanatory. Cool. We keep working our way down. This structure point right here, does that make us bullish or bearish? This point right here, 1 second. At the time of us looking at this market like this, is that still bullish or bearish? Bearish. Technically, this market is still bearish. This is still the lower high. This is still the lower low. We are yet to break above
or below this line, Making this market still bearish. Cool. All right. What about now? We have officially body candlestick closed below this lower high. I mean, excuse me, this lower low. So, this becomes the new lower low. Where is the new lower high? I don't know. bring out our trusty snake trick. Start working our way backwards. This is the first turning point. Boom. That right there is going to be the actual lower high. Beautiful. We now modify our lower high to that structure Point right there. As long as we remain in between this lower high
and lower low, we are going to be bearish. Cool. This structure point right there, is that a new higher high? Is that a new higher low? No. That is absolutely nothing. We have not. This is just another structure point. This has not broken above or below the lower high and lower low. It's nothing. What about this? Is this a new higher high? Is this a new higher low? No, we have not body Candlestick closed above or below the lower high and lower low. This market is still bearish, right? So, let's keep this going. Keep this
going like this. What about that? We got very close. That means we have to be bullish, right? Like we have to be bullish because it got that close to the actual lower high. Like it's it's got to be bullish. No. If we have not body candlestick closed above, if we have not structured closed above or below, we are still bearish. What about now? That's like three touches. It has to be it's almost there. Like come on. Like just count it. [ __ ] it. [ __ ] it. No. If we have not body closed above
or below, we are not shifting structure. Very simple. What about here? Exact same thing. We have absolutely nothing. This market structure is currently still below this right here. So, we are still bearish. We keep it going. And guess what? If you called this market bullish, you were Wrong. And if you called this market bearish, you were probably also wrong because you did not know from where this market structure was bearish. And this is the problem with 99% of traders. They cannot identify if something is properly bullish or bearish depending on the market structure. They just
simply don't know how to read market structure. That is a simple fact. they are uneducated or they just don't care to get educated and they don't know how to read market Structure. It is very simple. You can see a market that is trending like this, right? For example, and then you would probably think that this market is bullish, right? Let's say right now, take take a pause. Bullish or bearish. Go ahead. Okay, it's bullish. Where's the higher high and where's the higher low? A rookie trader or somebody that thinks that they know how to trade
like, "Yeah, that's the highest high and and then yeah, this is the higher low over Here." Buddy, you realize how many times this market has like you do you see how many other structure points? It's like saying it's like if you're calling this right here sixth street and you're calling this right here fifth street. Are you seeing how many times in between here? We have gone through so many different streets in order to get to this right here. This is not even sixth street. This is like 10th street. People are just confusing it because they
don't Know how to read market structure correctly. People are just confusing the roads because they don't know how to read the signs. They don't know their streets. It's why people use GPS's everywhere they go because they don't know the roads. This right here, people don't know how to read market structure, but there's no GPS's to read market structure. So, they get these [ __ ] indicators for them to actually read market structure thinking that that's The hack or the way to do it. This market right here, what if I told you is actually bearish. And
it's bearish based off of something extremely obvious, right? So, we'll just do it one more time, right? We have this right here. B for example, this is the higher high. This is the higher low. As long as we remain inside of these two structure points, we are bullish. Boom. We have body candlestick closed above. This turnins into the higher high. We get our Trusty snake trick. Start working our way back. This is the turning point. This is the higher low. Let's continue going in this markets. We are still bullish because this market is yet to
break above or below this structure point. So, this right here is absolutely nothing. We are still very much bullish. Okay, we continue to go. What about this point right here? Same exact thing. This is still between the higher high and between the higher low. So, we are still Bullish. What about now? Still bullish. This is still the higher high. This is still the higher low. We have not body candlestick closed above or below. What about now? We body candlestick closed above. Cool. That becomes now the higher high. Where is the higher low? I don't know.
All I know is if I bring out my trusty snake trick, I start working my my way backwards. The first turning point that is now going to be the higher low. That right there is going to now be Moved to my higher low. So this will be my higher low at this point right here. We keep moving to the right and then we have boom a little bit of a break above. This is officially broken above the higher high. That's the new higher high. Where's the higher low? I don't know. This is the head of
the snake. We then turn then this is officially going to be the higher low structure point in this market. We turn this into the higher low and if we continue going to this market We body candlestick or structure point close below that small break right there counts. Yes indeed this turns into the lower low. Where is the lower high? I don't know. I get the head of the snake. I then start working my way backwards. First turn that is going to be the lower high point at this point. right here. So now this market is
bearish because that is the lower high and that is the lower low. This right here has not body candlestick closed above this point. So Now we are still technically bearish. That right there is what 99% of traders cannot do correctly. And I wish I could just educate people on just that. I don't want to teach everybody my strategy. I don't want everybody to have my strategy. I really don't. I could give a [ __ ] I just want people to learn how to read the market. I feel as if people were just to be able
to understand if the market is bullish or bearish in the first hand, then they Would be able to actually be able to make a logical trade decision because right here, let's say you don't know how to identify if this market is bullish or bearish. You would see this market heading up. You're like, "Yep, buy." You're actually buying at the worst point because this market has just shifted bearish. This is having the retracements to then literally create the perfect lower low leg to the downside. This has hit the top of a Trend. We've had a reversal
pattern right here. This is the left head, right shoulder of this market. It's creating the perfect reversal pattern, retesting the neckline, and then we're selling. But you can't even tell the difference in between if it's bullish or bearish. And that's why you're losing. You're not losing because you don't have a strategy. You're just losing because you don't know how to read the market. Not knowing how to read the market. Not Having a strategy is already bad. But not knowing how to read the market and not having a strategy. It's just a combination for the worst
possible outcome ever. That's what I want to educate people on first. It's like learn how to read the market. And then you can think about how you can actually execute a strategy. Learn on how to read the streets. Learn how to read the stop sign, the red lights, the green lights, the turning signals, the highways. Then You can think about speeding and getting to places fast. But you can't speed and drift and and and and haul ass to places if you don't know where you're going and you don't know the roads. You cannot ident you
can't buy or sell a market if you don't know the difference between if it's going up or if it's going down. This right here is going to be the core foundation of everything else that I want to teach you. So I really really really really Want to break this down to the tea and get you guys to understand everything to perfection because once you understand this you get everything else right. So, what I've just taught you right now is how to identify if something is bullish or if something is bearish based off of the line
chart. Right now, let's say right now I'm going to grab this market right here. Right? So, for example, we're going to go to the most recent price. Right? This is S&P 500 right now In the live market. Right? So, we're going to switch from the candlestick chart to then the line chart. Now, if you were to go ahead and tell me if this market right here is bullish or is this market bearish, it would almost be extremely obvious, right? Because based off of everything that I have pretty much just showed you, you would be able
to identify that this market is obviously bullish, right? You can tell that this market right here, this is Going to be the highest high and that the higher low is going to be at this point right here. Right? You can tell that this market is bullish. You can tell that this market, if we were looking at it from over here, for example, you can tell that this was the higher high. This was the higher low. If we body candlestick closed above this line right here, this becomes the higher high. Where is the higher low? You
get the head of the snake. And then this Head of the snake, you start working it backwards. And then at the turning point, that is going to be the higher low. All right, very easy. I've taught you all this up to this point. Right? Now you know that this is going to be the higher low from this point right here. Cool. You know if we body candlestick close below it, we'll go bearish. So this then becomes the lower low and then this right here becomes then the lower high. You know if we body Candlestick above
this, we then go bullish. Oh, that right there did not body can well we'd have to go check if the bodies did and I'll explain that in just a second. But based off of the market structure, guess what? We did not break above that point. So we still remained bearish. We continue to go and then now we have officially broken above this structure point over here. So this became the higher high and then where was the higher low? I don't know. I get My trusty snake trick, start working my way down and boom, this is
a significant point where the market actually reversed. So then this right here is actually going to become the higher low. We break above and then we have higher high and higher low. Very clean, very obvious, very straight to the point. This right here is a very very very obvious market determining whether it's bullish or if this market is bearish. Wow. I have just hit stop loss on my Trade. I just uh I'm looking at it here right now live. Great. I just hit stop loss. Let me make sure. One second. Uh yep. I just hit
stop loss. I lost right now $153,000. Could have definitely been worse. Could have definitely been worse. I just took a trade that simply made absolutely no sense. And this trade right here that I was saying I was going to wait for the candlestick to close. Guess what happened? That's what happened. So, you Guys have seen this happen in real time. The market moves very fast and you know, I'm focused on educating you guys right now. It is what it is. I missed out on this trade, but just perfect example of the market moving to perfection
right here. So, this right here, hit my stop loss. I took this trade against the trend. And then I'll explain all this to you guys later. This trade, I would have taken this loss. And this trade, I missed out on this win. It is what it Is. It is part of the game. But for example, if we were to go ahead and go to a different market, for example, let's say we were And by by the way, ju just to show you guys, I'm not lying. So GBPC uh USDCHF, this market right here, let me
go back over here. I literally just took this loss right now. took this loss right now for $153,000. So you guys can see it right there for yourselves. $153,000. Now, I should have not taken the trade In the first place. It was a very high-risisk trade. But, you know, I personally accepted it and I even recorded me taking that trade live and I'll put the channel my other channel probably somewhere in the link below where I break these trades down live and why I'm interested in taking it, so on and so forth. But yeah, this
just happens to be a very degenerate trade, right? So, for example, let's say we're looking at this market right here and We're looking at it based off of the line chart. The exact same trade that I have taken. What can you tell based off of this market right here? Well, you can obviously tell that this market is bearish, right? This market at one point, this was the lower high over here. This market was this was the lower low. We broke below. So, this makes this the new lower low. And then if we were to do
our trusty snake trick, this would be the head of our snake. And if we Start working our way backwards, this would be the first turning point right here. This would be the lower high. So this market would have gone from bearish to then bearish, right? This would be the new lower low. This would then be the new lower high at this structure point, right? So we can tell that this would be bearish on this time frame. If we go down to the 4our, on the 4 hour, we can tell pretty much the same thing that
this is the lower low. And if we Start doing the little trusty move for me personally, if I were to be a snake, this right here is just another little bump on the road. This is just a little bump in the road. But this right here is a very significant turn. There was probably something very sharp, very important there. So I would put the lower high at that structure point right there. You always want to place your lower high and your lower low at the points where there's a significant move Just like this one. something
that is very obvious that the market had a reaction from from like this from this to this to this to this to this. These smaller points right here aren't really as significant as structure points for me. Neither are these very small ones. It needs to be a very sharp clean turning point. That is what's going to be considered a valid structure point. Now we for now we're going to be using the line chart to identify these very Sharp structure points. But we are going to be moving to the candlesticks soon. Now moving on to the
next subject which is the actual candlestick trading. It is actually very easy right because a lot of traders sometimes they get confused and what they end up doing is that they pretty much come here into the market and they'll be confused if this is a higher low if this is a higher high this is a higher low if this is a higher high. And what if I told you that it's Just extremely easy for you to be able to identify if something is bullish or bearish. just go to the line chart back into exactly what
I was just educating you guys on and just do the exact same thing that I was showing you right now to this point. Let's say we start breaking it down from this point right here for example, right? We're going to use the bar replay and we're going to go back this market right here. Why would you get lost in identifying if all this Over here is bullish or bearish when you can really just work from this structure point right here? You can tell that this structure point right here is obviously the highest high in this
market. So, we're going to count this as what it is, the highest high. Now, if we were get to get the head of our snake trick and we start working our way down, working our way down. Boom. This market has indeed reversed from this point. Right now, this is the first turn. So, then this Will turn into the higher high and then this will turn into the higher low. Now, this market turning into the higher low confirms that as long as we are inside of this higher high and higher low, this market will remain bullish.
Pretty easy, pretty self-explanatory. All we have to do now is go back to the candlestick chart. And would you look at that? We have our higher low placed perfectly at our higher low and placed perfectly at this higher high. All we really have to Do here is just adjust it slightly and put it to the bodies of the candlesticks. When it comes to identifying market structure on the actual candlestick chart, it really is no different than the line chart. You just want to make sure that you are doing it based off of the bodies of
the candlesticks. Do not take the wicks into account. Remember, the wicks are the trail of where the market has been, but it's not the actual structure of where The market has been. You want to make sure you are going based off of structure. So, a little bit of a of a hack if you would in order for you to have a bit more clarity on this if it's your first time identifying market structure. It's better if you do it with the actual candlesticks and not the wicks. So, double click on the charts and once you
double click on the charts, go to style. Make sure you have all of these un unchecked. And then make sure You go to the no gap candlesticks. Go to the settings of the no gap candlesticks. And then on the wicks, just put them to the color of your background. and my background is white. And if you notice, if I were to do that, I no longer have wicks. I'm only looking at the market structure for what it is, the market structure. I'm looking for it based off of every single elbow point. So, if I'm basing
the structure, it's very easy for me to play structure structure Throughout all of here. It's very easy for me to identify this structure exactly how the line chart would do it. So, I want to first practice on the line chart. So, first I can identify all of these structure points here as clear as I can. And then after I identify all these structure points, I then want to be able to just go ahead and do it on the candlestick chart for my own without actually using the line chart. So here for example, we have this
as the higher High. We have this as the higher low. As long as we are in between, we are still bullish. Now what has happened here? We have now body candlestick closed above. That is now the confirmed higher high. Where is the confirmed higher low? I don't know. We place the head of the snake. We start coming backwards and boom, we turn. That right there is indeed going to be the higher low. We just get the higher low. We move it up. And as of right now, that's the higher High. The higher high can obviously
move. So this higher high, if it continue to move a little bit more up, then that's the higher high. What gives us the indication that that high push is done is once we actually start to have some type of retracement, a candlestick like this that starts to have a pullback. That pullback is what creates that elbow. It's what creates that structure point, which creates that stop sign, that turning point. This Candlestick is what leads us to understand that this push has somewhat stopped and now this can potentially start coming back into a pullback. whether it's
going to continue going to the upside or go bearish. But this candlestick confirms that that body structure right there is indeed the higher high. And obviously a continuation push after that would just confirm that. So as of right now, we know that this is the higher low to this Structure point. And we know that this is the higher high. This market is very much bullish. If we go back out to the line chart for just some verification, we can tell that this is the higher low and that's the higher high. very clean, very obvious. There's
no if ends or buts, right? As long as we are above this higher low, we are bullish. Now, let's say something like that would happen. Something like that is now confirming that we have body candlestick Closed below the higher low and now we are bearish. So, as soon as this singular candlestick right here, body candlestick closed below this structure point, we are bearish. So, I know I I kind of sneaked it in there and I said it a lot throughout the whole entire part of us speaking about market structure, but this market could have been
creating a wick. This market could have wicked into this side. And let's say for example, right now we are on the 4hour time frame, right? It's the 4hour time frame. There's still 2 hours left in this candlestick. And this candlestick has is below this higher low, right? It hasn't closed below. It is below this higher low. And there's still two hours left for this candlestick to close. Is that a bearish confirmation? No. Because that candlestick has not closed. In those two hours, for all we know, this candlestick can come back up and then close above
This higher low and it was just creating a wick and then this continues to have the push to the upside. You only take the trade or excuse me, you only confirm that this market is bearish once we have body candlestick closed below after let's say we are here for 2 hours left to the candlestick and then the remaining 2 hours it just consolidates here and it closes below. Now we have a confirmed shift of structure. This market is no longer bullish. It is only Confirmed shifting structure once this candlestick has closed below. So then this
would turn into the lower low. And then let's go backwards. Let's pretend we don't know where the lower high is. This is the height of the snake. Start working our way backwards. This is the turn. Boom. That right there is the lower high. So we know that this is the lower high. And we know that that down there is the lower low. Now, this lower low can continue go down into who knows When. We don't know until that lower low is going to stop. But we know that lower low will stop once we start to
have a retracement. When we start to have some type of a pullback, that is our first indication that now we are stopping. Right? So, this move has stopped and now we can potentially create a new lower high to then create a new lower low. But as of right now, this is not the confirmed lower low. This is just the current low low. Like this is the lowest Point in this move. We only get a confirmation and you guys should be writing all of this down and you guys can go back if needed. But you only
get a confirmation once the candlestick has actually closed. And as of right now, this candlestick has closed, but it hasn't stopped. So you only get the confirmation once this candlestick has stopped. And as of right now, for all we know, this next candlestick can keep going down or it could stop and start to Have a retracement. So let's see what happens. So the next candlestick that we get from this market is going to be a reversal. Okay, cool. So this candlestick having this retracement to the upside let us know that this candlestick has officially stopped
here. So now we know that this is the confirmed lower high and that this is the confirmed lower low. The next candlestick can pretty much do something like this. And then guess what? This Will now be the new lower low. And then this will now be the new lower high. And you can see this very clearly in the market structure area. Market structure area. If you guys were to see it, you can tell that this is the lower high. This is the lower low. And this is now potentially having a reversal to continue going down.
We know that as long as we are inside of this lower high and this lower low, we are bearish. And by the way, I just switched over to this Camera because my other camera just ran out of battery, right? But let's continue to go with this example. Right? So now we know that this is the lower high. We know that this is the confirmed lower low and that this market is indeed bearish as long as we remain inside of this lower high and this lower low. We are then bearish. Cool. So right now this market
can do exactly right could do exactly what it's doing right now. Has this closed below? No. So that is Not indeed the bearish move. As you can tell took me way too long to pause it. But as you can tell this candlestick indeed did break below that structure point. So then that will go as the lower low. And if we were to then go ahead and do our trusty snake trick, this is the head of the snake. This is where the snake has to then turn. That will then be the lower high right then at
that structure point. Then, as you can tell, we body candlestick close below once Again. This turns into becoming the lower low. And then if we were to do the trusty snake trick, this becomes the lower high once again. And then we body candlestick close above this right here becomes the higher high. And then if we were to do our trusty snake trick head, the market turns, then that right there will turn into the actual higher low. Now all that right there shifted from bearish to bullish to bearish to bullish in just 12 hours cuz we
are currently on The 4hour time frame. Now you guys can see if we were to go to the line chart for example, you can see how this created lower high, lower low, lower high, lower low, and then we shifted bullish. So right now that this market has shifted bullish, we can simply wait for a retracement to then buy. But we don't know if this move has stopped. We don't know if this is the ultimate higher high or not. So let's see what this market brings. So right now it's Showing some type of a retracement. So
this is the confirmed higher high. And now right here we're having a retracement. And this can be the perfect higher low to then create a new higher high. So this market is yet to break above this higher high. And into that candlestick is not closed. It is not a confirmed closure above the higher high. If you notice that minor candlestick closing above the higher high, guess what gave it that confirmation push to The upside. Now, that is the confirmed higher high. Now, where is the higher low? Is the higher low at this point right here?
Or is it at this point right here? Now, just for examples purposes, since you guys watching this are beginners, the easiest way to do this is just go to the line chart and then check where is the structure point. If this is the head of the snake, start working our way back. This is the reversal point. That right there is going to be the Higher low point. So very clean for you to identify that reversal point and you'll be able to tell where the higher low is. So all you have to do is come place
that as your higher low and that is your higher high and that is it. Now you understand that this market is now bullish. Uh this market is bullish. You can identify this as the higher high and let's see if we can predict when it can potentially stop. So for right now there you go. It's showing some sign of a Pullback. So this is so far the confirmed higher high because if this next candlestick has a push to the upside then that would then be the new higher high and then new higher low. So for right
now this market just seems to be consolidating just a little bit. Shortly after that this market after having this retracement did exactly as I just said had this retracement then it comes to the upside. It breaks above this is the higher high. This becomes The higher low and after this becomes the higher low we just start chasing or continue pushing with price. And this was the higher high but then no pullback. Now as of right now this right now where this market is at this very moment is the ultimate and the newest highest high. And
this candlestick at this very moment has 1 hour and 22 minutes before closing. So as you can tell I'm literally placing it right at the live price right now. So this market Is currently bullish. That is the highest high. That is the higher low. So if I were just to bring back the the wicks really fast, we can see more or less where the trail of the market has been. And as you can tell, this market has been all the way up to this point over here. This was the highest high at one point. This
whole entire candlestick was full like this at one point, making that the higher high. But right now, we cannot confirm this higher high and Where it is until this candlestick does not close in the next hour and 20 minutes. This next hour and 20 minutes is going to be used to identify where this higher high officially closes. So right now we're kind of just moving this up and down until the market finishes closing it. Once that market finish closing it, we could identify to that point and the market can either do two things. Start to
have a retracement or continue pushing to the upside. And if It continues pushing to the upside, all we have to do is just keep moving that higher high with it. Very similar to how it did with this candlestick because once upon a time, this was the higher high at this point right here. And then after that higher high, the next candlestick after that just simply closed as a another bullish candle. And if it closes another bullish candle, you just move the higher high to that point. So on and so forth to the point where we
Are now. So right now this market is bullish. That is the higher high. And then this is the higher low. Now this is the simplest way to identify market structure. You can literally identify this on any market. And a lot of people make the mistake on not properly identifying structure correctly and they just simply don't know how to do it. For example, we can go to USDCHF and this market right here on USDCHF is pretty much very clear to the point where you Don't even have to go to the actual line chart. You can tell
that the lowest point that this market has ever been is this market right here. But if this market you would call it bullish, just say yes. or if you would call it bearish, just say no. What would you call this marker right here? Bullish or bearish? I'll let you take a second and decide. Go ahead and pause for the video. Okay. So, you probably either made a mistake or almost made a mistake On this market. This market, arguably speaking, depending on who you are talking to, would technically be bullish as of right now. You might
be asking, Alex, how this market is clearly going to the downside. This is clearly all the way at the lowest point it's ever been. It has to be bearish. No, not necessarily. This right here is technically could be considered the lower high. And then this right here could technically be the lower low at This point over here. So, this market is technically bearish, yes, but it's not bearish because of the lowest point that it's ever been. It's bearish because of this lower high and this lower low. Now, if I were to look at this quickly
on the line chart, you can see how this would actually be the lower high structure point. And then this would be the lower low structure point. At no point would I possibly call that an actual structure point cuz the snake, if we were to just Do the snake trick once again, the snake would just simply pass right on by there. No big deal. And then over here, it would actually run into some more structure points. So this market is actually bearish because of that lower high and that lower low not because of the current price
that is happening right now. Now if this market indeed does close where it is now in the next 5 hours and 17 minutes then yes then this would become the new lower low and then We just simply go back to the line chart and then we would be able to identify that the lower high would then be at this structure point right here. very clean, very easy, very straight. But a lot of traders make the mistake that they overlook a lot of market structure and they only focus on one thing and they're just looking at
this right here, right? Some traders, they get way too zoomed into the market and they go analyze or do a full top down analysis. They're just looking at the market like this. They're looking at the market for this move right here and they're looking at the market for just this move right here. So guys, you got to understand, you need to take a step back. You need to look at the market for what's going on. Now, some other traders make some very big mistakes also, and they do this when they go analyze the market. They're
like, "Yep, this market is uh bearish. Yep. You see how how it's been going Down for like the last 5 years." It's like, "Yeah, but you need you need to understand like where the market is right now. The market is all the way down here." Like, why are you looking at price all the way up here when it was here in 2022? It's like that's 3 years ago. Like, we are very far away from that. We want to trade the market today. So, we want to make sure we can zoom in an a healthy amount
to where we are right now to where we can actually Center the charts right in the middle. I don't know why, but I've seen whenever I get on calls with my students and I review the trades, like I literally see that they're analyzing the markets like this and they're like far away from the screen. I'm like, dude, are you scared of the market? Like, what's going on? And or they look at the market like this or they look at it like this, just like barely looking. It's like, bro, you need to get the market. You
need to control It and put it in the middle. You need to focus on what's going on right in front of you. Because if you can't see what you're trading, how are you actually going to trade? Like, you literally need to be looking at it. And if you're having the market like this, too skinny or way too flat, how are you going to be able to identify if you're ready to buy or sell? You need to be able to actually look at the market for what's going on and centering it right in front of you.
And that also goes hand inand when placing these structure points correctly. A lot of people will just overlook these things and they won't realize that this market is actually bearish. And I cannot count how many times I have seen a market like this one where 5 hours will still be in this candlestick closure and in those 5 hours this market will then do this and close as a bullish candle and then everybody counted it bearish wrongfully. Yes, you Are right that it's bearish but you're wrong from where it is bearish and then from wherever you're
wrong from it's bearish that's going to determine where you're going to be interested in selling or buying. And that is crucial to actually having the perfect entry for your trade, which we're going to getting we're going to be getting to all of that later into this video. I just want you guys to have a very clear understanding that there is so many different Potential examples and and scenarios that could be happening on these markets, right? For example, let's say we go to GBPCHF, right? GBPCHF for example, if we were to be looking at it on
this time frame, because again, remember every single time frame, the market structure is going to be different. The market structure on the 4 hour will not be same as the daily and the daily will not be same as the weekly. Every single market structure is Going to be different. Would you call this market right here bullish or bearish? Go ahead, take a second, pause the video, test yourself. Okay, perfect. This market structure very, very easily. We go and hop over to the line chart. And the line chart, you're going to be able to identify that
this market structure point right over here is the lower high. And that this market structure point over here is the lower low. Lower high, lower low. As you can Tell, this market is yet to break above or below that lower high or lower low even up to this point right here. And this, keep in mind, we are on the weekly time frame, meaning every single one of these candlesticks is a whole entire week. We have literally like for us to make one of these candlesticks, it takes five trading days, which is a very long time.
So the weekly time frame, for example, is bearish. So this would be the weekly lower high and this would be The weekly lower low. Pretty easy, pretty self-explanatory. Let's go look at the daily for example, the daily time frame. We take a step back as well and we can see everything that's going on. We can see our weekly lower high and lower low. But on the daily time frame, if we were to identify this for the daily structure, you can see how the daily actually goes lower low, lower high, lower low, and then we end
up shifting bullish. So now we we know that We can look for more recent price action to determine if something is bullish or bearish. We don't really have to look at the weekly structure point because we know that the weekly structure point is the weekly structure point and within that weekly structure point the daily time frame went bearish and had an additional structure point and then we went bullish. So for the daily, I would zoom into pretty much a price action like this. And then within within this Price action, I can very clearly identify that
this market was at one point creating very clean lower high, lower low. We pretty much broke through all this over here. Then at this point down over here, we created a lower low and then this was the lower high. Right? So I'm talking about this example right here. This lower high, this lower low. Obviously this market then then we broke above this structure point right there. So at this point we are very very much Bearish. We broke above that structure point making it now bullish. So we look at it on the candlestick time frames. We
can see how it is bullish. We can pretty much see how that time frame stopped. And if you notice look how precise it is when I'm telling you guys that it is based off of the body candlestick closing below the line. If you notice this broke above this structure point right here. it breaking above this structure point made it bullish. So now This turns into the higher high making this the higher high then turns this into the higher low because if we do our trusty snake trick this is the point where the market has a
turn and if for whatever reason you can't see it that clean. It's totally fine because you can go back out to the line chart and on the line chart you can see that that's the higher high that's the higher low and then we want to make sure that we can squeeze price to the bodies of the Candlesticks. And if you notice, guess what happens? Price comes all the way back down to this higher low because again, this is very, this is bullish as long as we don't break below this line. And then price never body
candlestick closes below that higher low. And then guess what happens? We then have a massive push to the upside. Look how precise placing these higher highs and higher lows is and the importance of it. You want to make sure that you can place This at an area that it is very clear and very obvious. Once again, you could go back out to the line chart and you can verify higher low, higher high. We have now body candlestick obviously above this area. So, we can go out to the daily time frame and place it on the
body. This right here is a very clean higher high. Now, I would argue that I would not count this as a higher low. This right here is something that I can see the head of the snake just simply Kind of just going right pass by. I see this as a much more sign significant turning point than that one. And the best way for me to confirm it is if I go out to the actual candlestick chart, which is what we're going to be trading. And I don't see any possible candlesticks creating an elbow. It's not
something clean like it's not something for example like this that it actually creates a structure point. Here it creates a structure point. Like there's Something here. It just looks like it's one whole move to the upside. So, not only does the actual line chart structure not look clear, but when I go out to the candlestick chart, I also confirm that it's not clear. So, for me, I would then make the higher low, this structure point right here, making this the higher high and making this the higher low. Now, keep in mind, this is not the
confirmed higher high from this market because this market could simply Continue going to the upside. We don't know. But as of right now, that is the higher high and this is the higher low. So, let's see what happens next. My point exactly. So, now this is the new higher high. And if you notice, there's no difference in the higher low structure point on this time frame. There's just still a whole entire move to the upside. The move just keeps going up. And now looks like we are stopping. So this looks like we are at the
Confirmed higher high. Now having this confirmed higher high is so important because you're going to be able to actually be ready to either enter a trade or set up the perfect trade to enter. I'm telling you, as soon as you understand this market structure, you understand everything. I'm going to be able to teach you how to actually use the inverted head and shoulders, the head and shoulders, entry time frame confirmation, shift of structure. I'm Just going to teach you how to do everything. Once you understand this, this is like me teaching you the ABCs to
a language. As soon as you get the ABCs, you can basically put it all together and then you're going to actually be able to go ahead and speak on it. But first, you need to learn the alphabet. So this right here, as you can tell, the market has actually shown a sign of stopping. And this market looks like it's ready to start having some type of Retracement before continue going to the upside. So that's what I thought. But then guess what? The market just simply created another higher low and kept going to the upside. It
doesn't look clean on the actual candlestick chart. You can just use the line chart to be able to identify. We have body candlestick closed above. Let's make sure of that first before anything. And yes, we did body candlestick close above this higher high. So now this is the new Higher high. I go back out to the line chart. And on the line chart, this now turns into the higher low, meaning we are still very much bullish on the daily time frame. Now the daily time frame, guess what ends up happening? We end up actually having
a break below that higher low. Okay, what happens once we break that higher low? First of all, let's just go out to the line chart just to confirm. So now on the line chart, we're going to make this the new lower Low. And then we are going to make this the lower high, right? Very clean, very simple. Now the daily time frame is bearish, quote unquote. And if we were to just continue following price action, this right now, as of right now, is the confirmed lower low, but it is not fully confirmed yet because we
don't know if this has stopped, right? We need to make sure and figure out where it's going to stop. So if we keep it going, perfect. Price has very much stopped there. So That is the confirmed lower low. We can look at it also on the line chart. As you can tell, lower high, lower low. Once again, I would not count that as the structure point. Feel like the snake would pass right by there exactly how it did here. And if we were to look at it on the candlestick chart, I don't see any elbows
being created. So right now, we have lower high, we have lower low. And this trade as of right now has not body candlestick closed below. No body Candlestick closure, no confirmation. And now that we have a body candlestick closure below, we can then confirm that this is actually indeed a proper lower low structure point. So I would go ahead and then count this as the lower low. You don't know where to place the lower high. Go to the line chart and find the cleanest structure point. So if I were to make this the head of
the snake, start working my way back, I would not count that one as the cleanest structure Point. I would count this one as the cleanest structure point. And that cleanest structure point is what's going to lead me to then make the lower high right at this area right here. Now, these potential examples are literally never ending. These things are just the market creates so many different unique types of structure points that it's a neverending different scenario. There's never always a perfect exact black or white structure point. And I want you Guys to understand that because
that is so important to having that mindset when it comes to trading the market. I wish I would have known that when I came into the market. I always tried to perfect and get the precise exact structure point every single time. And the truth of the matter is that the market doesn't move perfect. It's going to move however it wants. And sometimes it moving however it wants. It doesn't make things extremely clear for you to actually be Able to identify as a lower high or lower low or higher high and higher low. You have to
make it make sense. And if it makes sense, it makes sense. If it doesn't, it doesn't. But there's never going to be like a proper black or white textbook that's going to tell you, "Yep, that's exactly how it is." Exactly what I'm teaching you right now is as close as it's going to get. Everything is just based off of where it's the cleanest and where it makes the most sense because Every single move is so different. And that is this is a perfect example on how placing that as the lower high at the area where
it makes sense. Price had a pullback to that area, did not have a body candlestick closure above and then guess what? We had a massive push to the downside. This is what I'm saying. Everything is just textbook. You need to follow it as close to it as you can. And the patience is the most important thing. Next, this is obviously going to Break below. This is the lower low. And then I can almost guarantee you that the lower high will be right at that structure point right there. Once again, you go back to the line
chart and then you can identify that that right there is the lower high. That right there is the lower low. And if we just continue following price, this market right now is bearish. As long as we are inside of this move right here. And then let's see what happens next. As you can tell, we Come all the way back up very near that lower high. We do not body candlestick close above it. And guess what happens? Beautiful sells to the downside. Like this is just so easy because it's so predictable because you know exactly where
the market is. So this turns into the lower high. This turns into the lower low. If we go ahead and look back into the line chart, it's very obvious where it's at. For right now, this is not the confirmed lower low because we Don't know if that's where it stopped. And then that is exactly where it stopped. Right now we're having a retracement. As long as we remain inside of the lower high and lower low, we are bearish. And then would you look at that? This market as of right now did not break above the
lower high, lower low, and you could have caught a beautiful sell inside of this bearish move right here. I'm just showing you guys how easy it is to identify if Something is bullish or if something is bearish. And this right here, it is very obvious that that is the lower high and that this is the lower low based off of this structure point on how I am teaching you guys right now. So you use the line chart to determine if something is bullish or bearish. And then when you come to the candlestick charts, all you
simply do is just adjust it and make it to the bodies so you have a clear understanding of where it is. This right Here is how you identify if something is bullish or bearish and how market structure works. I cannot stress on how much I wished I knew how this is this is how things work because this would have made my life so much easier and I would have saved so much time on trying to figure out different ways on how to identify if something is properly bullish or if something is properly bearish. But right
now you can just tell that the weekly time frame is bearish. So this is the weekly lower high lower low. That is what the daily lower high and lower low looks like on the weekly. The daily time frame, this is the lower high and lower low. This is what the actual weekly lower high and lower low looks like on the daily. And now if we go to the 4our time frame, on the 4our time frame, we can do the exact same thing that we have just done right now. Go out to the line chart and
on the line chart you can identify that this 4hour Time frame is also very much bearish. This is a lower high and then this is the lower low. You can follow all this structure. lower high, lower low, higher high, higher low. D, higher high, higher low. We break the structure and now we are bearish. So this is the 4hour lower high. And as of right now, this is the 4hour lower low. So if you ask me a question and you know you have the weekly time frame bearish, the daily time frame bearish, and then the
4our Time frame bearish, h doesn't it make sense to sell? Of course, that's how you can kind of just start building a picture and then everything else just starts coming into play. So, without you even realizing, we have just done a top down analysis. We've gone from the top down. We've gone from the weekly time frame down. And that's how simple it is. But for right now, I just want to educate you guys exactly on how market structure works. We're going to be using The line charts to understand if market structure is bullish or bearish.
And then after we go to the candlestick chart. And on the candlestick chart, we just place it to the bodies. And the most important rule is that you make sure that you place these lower highs and lower low lines or if you're going to be using a bullish market that you are actually placing these higher highs and higher low points. You want to make sure that you actually place these lines So you know exactly where your higher lows and higher highs are so you aren't mistaken from where the market is bullish or bearish from. To
get your line, simply come here, place higher high, and then place the higher low at the point wherever the higher low is. This way, you have a clear understanding of where the market is. This way, you are actually having a perfect base to build your trade off of before you enter the trade and you know exactly the type Of trade that you're entering before you even enter it. This market right here arguably is going to be bullish. So, as you can tell, this is the lower high. This is the lower low. This is the lower
high. This is the lower low. Now, this is the higher high and this is the higher low. This right here is the weekly higher low at this point right here. And then right now, we are currently in the works of creating that weekly higher high. It's very simple, Very straightforward. This right here is how you read market structure in the markets. Everything is based off of the elbows. Everything is to this market structure. You do it on the line chart. It reflects on the candlesticks. And the only difference in between one or the other is
that the other one is just straight lines and this one is straight candlesticks. We want to make we want to make sure that we can focus on the bodies of the candlesticks and not the Wicks. The wicks are just a trail. We use that for the entries that is not any use literally all the way into the end. The wicks are pretty much the last thing that we use. But right now, you want to make sure that you can just read the market structure and be able to identify if something is bullish or bearish based
off of that structure. That being said, that is the candlestick charts and the line charts. All right, so at this point into the video, we are obviously very Deep into what trading is, how trading works, and truthfully the very very simple concepts on how to read market analysis. Right now, you just understand to determine if something is properly bullish or if something is properly bearish. Now, we're going to get into top that analysis. We're going to get into area of interest, support and resistance, entry signal, double tops, double bottoms, break and retest, indicators, trading plan,
strategy, Everything inside of this video. So, want to take a quick pause and make sure you subscribe to the channel. If you haven't subscribed, hit that subscribe button, hit that like button as well. Leave a comment on what has been your favorite section so far. And to do a quick recap. So, up to this point, we have talked about what a currency pair is. We have talked about different types of traders, day traders, swing traders, scalpers, intraday investors. We have Also talked about the types of technical trading. You have the line chart, the candlestick charts,
multiple different forms of bar charts. You guys now understand what platforms you need to actually execute a trade and which ones you should focus on. That's only going to be Trading View, a broker of your choice, and then MetaTrader 5 to actually execute the trade. and then maybe Forex Factory if you want to use the fundamentals. Now you guys Understand the actual trading sessions to be involved into the market because there yes the market is there to be available 245 to actually go ahead and execute a trade but that doesn't mean that you should actually
execute a trade at whatever time you want whenever it's at the best of your convenience. You need to make sure that you're trading within that proper window of you actually executing a trade. So now you guys understand the different types of Orders in the market. You guys understand what's an market instant execution? What's a buy stop, sell, stop, market order limits, and how you can actually place that on MetaTrader 5? You guys are educated exactly on how to identify the market structure. Now, if you need more practice and you need to see it all over
again, just simply go back before you continue watching this video forward because there is no other market structure education that is to be Done to determine if something is bullish or if something is bearish. All I can just really do is have a neverending amount of examples and then I would actually never get to the point when it comes to the strategy. Inside of my channel, I have many other videos like this one where I actually educate you on market structure alone and it's a full class on just that. But what I've just taught you
previously should be more than enough for you to be able to Go ahead go to any chart and determine if it's bullish or bearish. Now that after that you've learned and you've been able to identify that something is bullish or bearish. But what's next? Well, it's exactly what we're going to be getting into right now. Just want to do a quick pause quiz recap because that's a lot of information and that information has taken me a very long time to even remotely get near understanding it. And now the fact that I've just put it all
to you in one single video is pretty crazy. And I just wanted to make sure that you realize that before we continue going forward. And if you think that you need to just watch the market structure section a bit more before moving on because now things are going to get a little bit more advanced and I'm going to start going a bit faster paced. Just literally take a quick pause at this section. Go back, watch the last 30 minutes to 45 minutes, Even the last hour, and just watch that section over again. Go look over
throughout your notes. And all I'm going to be doing now is teaching you now the advanced way on how to do it, how to actually do a proper top down analysis, and how to place your areas of interest. So, with that being said, let's get started. Okay, so let's see if you've been doing your homework and you've actually been paying attention, right? So, what I'm about to show you guys is Going to be topdown analysis. Topdown analysis. This right here is what's going to lead you to determine if it's a good time to buy or
a good time to sell. Now, you might be asking yourself, why is top analysis so important? And that is because top-down analysis is directly connected to the actual trend of the trade. And you should only be executing a trade if you are trading with the trend. The trend is Your friend. I cannot stress this enough. And you want to make sure that you can be trading with the most amount of trends in your favor. So the trend is your friend. If you were to get something to write that on a piece of paper, this would
probably be on the top of that forefront. Now, at the point when it comes to actually entering a trade, everything when it comes to educating you on the market, there's a bunch of other valuable notes, but when It comes to actually entering a trade, this is going to be probably one of the top things that you need in your favor for you to actually determine if the trade is good to buy or if the trade is good to sell. So, for us to do a top analysis, it's very simple, right? You have a weekly move
that's going to be like this. So this box over here that we're going to be having at our left section, this is going to be the weekly. Then inside of this box, we're going to Have the daily. And then on this box, we are going to have the 4 hour. And in just a second, I'm going to be breaking down what every single time frame is used for and how you're going to use it. Right? You just learn to determine if something is bullish or bearish. Right now, you can very clearly tell that this weekly
time frame is bullish. That's the higher high and that's the higher low. Right? If you were to do the snake trick once again, this is the head of the Snake. The first turn that is going to be the actual turn of the snake and that's going to be the higher low. So this is what the market looks like on the weekly. Now, if we were to look at this same exact market on the daily, for example, this is exactly how this market would look like. So, I'm literally just copying this exact same structure move, but
I'm just basically zooming into this price. So, this is what the weekly higher high Would look like on the weekly. This is what the weekly higher low would look like on the weekly. If I were to copy this weekly higher low and place it over here on the daily, this is what it would look like. Or even lower. We're just going to place it literally at the exact same price where it is over here. And this is what the weekly higher high would look like if I were to place the weekly higher high at this
daily time frame. Now, this is the weekly higher High. This is the weekly higher low on the daily time frame. But the daily time frame, this is the daily higher high as well. So, if we were just to put here daily higher high and then where is the daily higher low? Well, let's say you don't know because you've just started to learn how to trade, but you do know how to use the snake trick. And this crazy guy in the internet keeps saying that the snake trick is based off of the first turn and that's
where the higher Low is. So, if this is the head of the snake and we start going backwards, that is the first turn. That indeed right there is going to now be the higher low of this market. All right, this crazy guy in the internet is somehow making sense. So that right there is going to be the higher low. Now this is what the daily higher low looks like on the weekly. And this is what the daily higher high looks like on the weekly. So as you can tell we have the same higher High and
then we have a different higher low because there's different structure, right? Pretty easy, pretty self-explanatory. Everything so far should be making sense because we are not breaking down anything new. This is just what it looks like on the weekly and this is what it looks like on the daily. Now, if I were to do the exact same structure move on the 4 hour, obviously the 4our time frame is going to have a lot more structure, a lot more Detail that is going to define the weekly and the daily time frame, right? Because keep in mind,
every single candle of this is just one week. But two of these candles is going to be 10 of the candles on the daily. And then on the weekly it'll be north of 26 candles. So the lower the time frame we go, the more detail you're going to see everything. It's just going to be broken down into many more candlesticks and many more structure points. It's going To be broken down the same way whether you look at it on the candlestick chart or whether you look at it on the line chart. The market structure is
going to change because the price movements change based off of the time frame. So, so far right now we have the weekly time frame and we have the daily time frame. Right? Now, on the 4our time frame, we're also going to identify the higher high and higher low. Right? 4our time frame is bullish. As you can tell, this Is the 4hour higher high. And then the 4hour higher low is going to be at this point right here. Once again, if we do the trusty snake trick, get the head of the snake, turn backwards, that right
there is going to be the higher low. Pretty easy, pretty self-explanatory just showing this in a very very very simple format. So we have just done top down analysis on for example EuroUSD. We have understood that this market structure as of right now. This is what The 4hour higher high looks like on the 4 hour and this is what the 4hour higher low looks like on the daily for example. And this is what the 4hour higher low looks like for example on the weekly. So this is just to give you perspective when you're going to
go enter a trade where you are entering the trade. Should you be entering the trade on the 4 hour? Should you be entering the trade on the daily? Should you be entering the trade on the weekly? Now all of that I'm going To be breaking down inside of this video. I just want you guys to understand one thing at a time. The trend is your friend. So now this market right here, yes, the weekly time frame is going to be considered bullish, the daily time frame is going to be considered bullish, and the 4hour time
frame is going to be considered bullish. Now, this quote unquote is great because you have all three time frames that are going to be in your favor. So this means That it's a great time to buy. Now, while this is what I'm saying to you guys right now in this specific example, that actually might not be the case. And I'm going to break that down in just a second. But the most important thing that I want you guys to understand right now is going to be top down analysis is to literally determine if something is
bullish or bearish from the top down. So all of the time frames that we will be using are going to be these. So we have The weekly, daily, 4 hour, 2 hour, 1 hour, 30 minutes and 15 minutes. Now we will be using the weekly, the daily and the 4 hour. All of these three time frames, these are going to be used to identify the trend. So these are used to identify trend and area of interest slashsup support or resistance. And we'll get into that in just a second. Don't worry, one thing at a time.
But we will be using these higher time frames to Identify where is the overall direction of the market going because we want to be trading with that direction. If the majority of the higher time frames are going up, best believe we're just going to keep going up. If the majority of the higher time frames are going down, best believe we're are going to continue that trend to the downside. There's no better option when it comes to buying or selling. They're both equally the same. And then we're going to be using these Lower time frames as
entry signal confirmations. Now, I'm going to prepare you guys right now for something. The entry signals is going to actually be the most simple thing that I can possibly ever teach you. It's going to be the easiest thing you are ever going to learn. But it will be the last thing. Why? Because when you go enter the trade, that means that you have done your whole entire analysis. That means that you have broken down Your strategy. That means that you have done literally everything and you're at the point of entry. There is so many more
things that we need to get to the point before the market is even near entering the trade. And just want to prepare you guys mentally for that. That if you try even remotely to skip this video straight to the entry section because you can you're going to be making a very big mistake because just because you have the entry portion of The trade doesn't mean that you understand how to have the whole entire analysis of the trade before entering it. You need to properly know how to enter the trade prior to actually having the entry
signal. Where is the trade? Do you have certain confluences? Are you at a proper support and resistance? Do you even know how to place a proper support and resistance? You have added confluences that you can have before your entry signal. There's so many more Steps that go down before the entry signal that you skipping all the way to the entry signal portion is actually going to cause you more damage than good. Just wanted to add this as a side note in there because I get it might be a lot of time for you to sit
down and watch this video, but I will tell you this. it's going to cost you a lot more time you trying to figure this out and cheat your way through it and try to just skip it when the best way to do it Is just learn properly and take your time. Right? So with that being said, entry signal time frames are going to be this. And then the trending time frames for top down analysis are going to be this. So when we do our top down analysis, we are only going to be using the weekly,
the daily, and the 4 hour. We don't involve the two hour, the 1 hour, the 30 or the 15 minutes until we are not ready to enter the trade. So these time frames right here are Completely avoided until we are ready to enter the trade. And we are not ready to enter the trade until quite some time. So for now, we will completely disregard all of these time frames and what an entry signal is. And our only focus for right now is going to be the trend. And for us to identify the trend, we need
to do a top down analysis. And that is with these three time frames the weekly, the daily and the 4 hour. Now the way to do top down analysis Is to identify the structure on these three time frames to identify trend. So it's very simple. The way for us to do a top deadline analysis is to identify the structure on these three time frames to identify the trend. Exactly what we've done right now. Perfect example is we can go right now to S&P 500 for example. We can go to a Different market. For example, let's
say we go to AUD JPY, right? For example, right? This is a real market that I'm actually interested in trading. And we're just going to go to a different server. So, we don't have a bunch of stuff in our way. We're going to start off on the weekly time frame. Top.alysis. analysis is meant to literally start from the top down. So remember, we don't want to be looking at the market way too back to The point where we can't even look at the market structure where you can't even see the candlesticks. And remember, you don't
want to be super zoomed in to the point where you can only see the last five candlesticks and you can't look much to the left. You want to get a healthy amount. For you to do a proper topdown analysis on the weekly time frame, you should go backwards. Max anywhere from five to six years. Five to six years should Be the max. You go backwards to identify structure. If something is bullish or bearish five, six years back to identify the market structure. Now, I know this might seem like a lot. You're like, Alex, that's a
long time. That's a lot of market structure, but you really only need to do this one time. And you only need to do this one time because once you understand where the market is and where it's bullish or bearish from, you really don't ever have to go back. So Like let's say right now we go back five, six years and that's the max, right? Because we don't really have to go all the way to this point right here because we can very clearly tell this has shifted to the upside and then we've gone bullish or
bearish. But let's say if we were to go through all of this market structure right now, it would probably take us 10 minutes, 15 minutes, and then we end off with this market being bullish or bearish to wherever, Right? Just for a random example, let's just call this the higher high. Let's just call this the higher low, whatever. Once this market breaks this structure point, we don't have to go back five years again to determine if this market is indeed bullish or bearish. No, we just know if it breaks this structure point, this market will
then be bullish. that will be the higher high and then the higher low will be somewhere here and then we don't ever have to go back And do it again. And that's why I trade or quote unquote trade. I analyze all of these different markets simply because I just know where they are every single time because I already did the work. I already analyze the markets and I already know where they are. Like I already did all that work and all that work is really not a lot of work. Just kind of preparing for you
guys for that. And then on the 4 hour, the max we could go back is going to be Anywhere from six to 12 months back to identify the market structure. So make sure you guys write this down. You guys don't need to go further than this to determine if something is bullish or if something is bearish. So if we can just go over to the line chart for us to have a very clear indication to determine if this is bullish or bearish. All we can see here is that this market at one point started from
this high point. This was a higher low. Now we can just start off from this point. It'll be very easy for us to determine this. So if you are confused and you are a beginner and you can't do it off of the candlesticks just yet, don't worry. You can just go ahead and use your trusty line chart and that'll be your cheat sheet. That'll be your hack. But if I were to be using the candlesticks, I can tell that this is the higher high off of that body right there. And then I can tell that
this is The higher low based off of that body right there. We switch over back to the line chart and look at that perfect accuracy right to the structure point. So we know that this is the higher high. Excuse me. This is the higher low on the weekly. And then we understand that this is the daily higher high. Cool. We know as long as we remain inside of here, we are bullish. When we break below, we are bearish. Look at that. We go out to the Daily time frame and what do we have? a daily
body candlestick closure below. Now what does that mean? That means that now this if it has confirmed closed below and as of right now it hasn't closed. Let's see if this candlestick has closed. Now it has officially confirmed close below. This is the weekly lower low. Cool. This is the weekly lower low. And then our weekly lower high goes to which point? Well, if this is the head of the snake, we start Going backwards. This is the first turn. That right there is indeed going to be the actual lower high. So this point over here
is now going to be turned into the daily, excuse me, the weekly lower high. Human error weekly lower high. Cool. We know as long as we are inside of the structure, this is still the continuation cells. The candlestick hasn't closed. Would you look at that? Still hasn't still pushing down. We keep we do the snake trick once Again. There's still no stopping point. So, this move hasn't hasn't stopped just yet. Cool. Looks like it's going to be stopping somewhere around here. And that looks like exactly where it's going to stop. Let me confirm based off
of the line chart. Beautiful. It stopped at that point right there. Beautiful perfection execution. We continue following this market structure. As long as we are in between this lower high and lower low, we are still bearish. Would You look at that? We body candlestick closed below. That makes this the new lower low. We do the snake trick. This right here becomes the lower high. You need some clarity, just hop back on over the line chart and take a look at it. Lower low, lower high. As long as we don't body candlestick close above this, we
are still bearish. And would you look at that? We did indeed body candlestick close above this becomes the higher high. So this is now weekly higher high. And then this becomes the weekly higher low. And we basically do this all the way up until the point where we understand where the market is right now. This is extremely healthy for your vision when it comes to seeing the market patterns and determining if something is bullish or bearish. As you can tell here, it has struggled extremely hard to break above that structure point. And this is showing
the power of these higher high and these Structure points. Look how strong that line was that it for nearly six weeks. 1 2 3 4 5 nearly seven weeks it did not manage to break above. It made it all the way to this close and it never body closed. Now it did body close below. So this becomes a new lower low. Then this over here becomes the lower high. So we are now bearish. Then this becomes the lower low. Then this becomes the lower high. We are now bearish inside of this move. Once we body
close above, we then Go bullish. We wicked out. Never actually were able to body candlestick close above and uh we are about to do it very soon. Now we have officially closed above. That is the higher high. This is the higher low. We're just following a live right now just so we can not waste too much time on these examples, but everything is pretty obvious on where it is. So we're just continuing from this lower high, this lower low, then this becomes the higher high. And then this Structure point right here becomes the higher low.
So we could go out to the weekly time frame just to confirm, excuse me, we go out to the line line chart just to confirm. And look at that. That is the weekly higher high. That is the weekly higher low. So right now all we are doing is top down analysis to determine if this is bullish or bearish. And the weekly is bullish. This is the higher high and this is the higher low. I am not making this up. This is not Part of my strategy just yet. At this point right now, I am just
exe I'm just educating you on how to read the market. Next, we go down to the daily time frame. We would pretty much do the exact same thing. We could start off from whichever point, but we can start off from right here. And it would be very obvious if we would just hop over to the line chart that this market at one point was creating these higher highs and higher lows. And we can pretty much just Pick it up from like right around here. This right here would be the lower high. This right here would
be the lower low, lower high. We body candlestick close above. Then this would be the higher high. I would leave that as a higher low. Let me go to the candlestick to confirm. Yes, because if this was the lower high at one point, correct? This was the lower high. This was the lower low. I wouldn't really count that as a structure point simply because it's not As strong or as significant. Once this move has actually closed above and we created this new higher high prior to this candle, if I'm looking down, I don't see any
clean elbows. I don't see any clean structure points. I don't it's just it just looks like one clean continuation up. The head of the snake can very clearly just move on right through there. It's not like a move like this. If this were to be the head of the snake, it would actually Have to like go and make that turn. I don't see any significant turns at that point right there. Meaning that then I would include for this to be the higher low. Obviously this candlestick now closes above this becomes the higher high. This becomes
the higher low and then I would count this as the higher high. I would not count that as the higher low. But let's see what it looks like on the line charts. And if we were to look at that On the line chart, it could be considered the higher low. And this is where experience and just being part of just being in front of the markets for hours will lead you to be able to make this analysis. I personally would not count that as the higher low. Even though on the line chart it does look
like the higher low. If you were to look at it on the daily candlestick, if you were to ask me, the head of the snake would just simply come right on through There and not do a significant turn. It can easily just slide right on through there. this market structure is far more significant and I could actually doing see it doing a turn before continuating to the upside. Now, I know in the past for my advanced students, if any of you guys are in here, I know a lot of you guys sometimes say, "Yep, that's
exactly what I learned inside of my strategy because a one candlestick pullback, I'm not saying it's not significant enough, But it it would need to be a lot cleaner in order for me to actually consider it as a structured pullback." And this one candlestick right here to me is simply not strong enough. There's other different examples of a one candlestick pullback that could look far more interesting and far more respectful. It looks a lot more like structure point compared to that candle. Even if something as small as this, as you can tell, this right here
actually had an Engulfing candlestick and then it had the push up. I would personally count this as a pullback compared to the other one just because this has more of a body to it. It has more of a statement to it. This right here shows me some type of elbow. And if we were to look at it on the line chart, it looks exactly the same as the market structure that we're running into right now. But this looks a lot more respected. This right here looks pretty soft in my opinion. And I Want personally I
want to risk my money on something that I feel comfortable with and something that is respected. And to me, I don't see the market respecting that structure point right there. Right. So daily time frame, we are also indeed bullish. So this is the daily higher high. This is the daily higher low, weekly higher high, weekly higher low. Cool. Pretty easy, pretty self-explanatory. Now, I want you guys to go ahead and pause this video and Tell me whether this 4hour time frame is bullish or if this 4hour time frame is bearish. Go ahead, pause this video.
I'm going to give you guys 5 seconds to determine if this is bullish or if this is bearish just based off of the line chart. Go ahead. If you make a mistake, it's okay. Don't worry. It's very tricky. But go ahead. All right, you guys came back. So the 4hour time frame, if we were to follow just the structure point, obviously this Would be a higher low. This would be a higher high. Arguably, this can be a higher low. And then this could be a higher high up here. But let's see what it looks like
on the actual candlestick chart. Well, if you notice on the candlestick chart, the body line has officially closed above that structure point right there. And I would consider this to be the higher high. I would have actually never considered this to be the higher low for the exact same example That we just did on the daily time frame. I would have actually considered this the higher low. But the point is that it doesn't even matter because this structure actually closed above making that the higher high and then making this right here the higher low. If
that was the higher low, that was the higher high. The market shifted it making this now bearish. So then this became the lower low. Then if we that becomes the lower low. We do the head of the snake. We start working backwards. That's the first turn. That is then going to be the 4hour lower high. And then if this is the 4hour lower low, let me just erase this right here. If this then becomes a 4-hour lower low, we then do the head of the snake. This is then going to be the lower high. That
right there is why this 4hour time frame is indeed bearish. So this time frame is actually bearish. Let me just put that right back up there. There should be a right there. So this Is the 4hour lower low and then this is the 4our lower high. 4 hour lower high. 4our lower low. So, if you said that this was bearish, I want to make sure that you understand why this is bearish. If you were say that it's bullish, I want you to understand why you weren't correct that it was bullish. You should have obviously very
easily seen that this Broke above this structure point and that was the higher high. And if that's the higher high, that's very clearly the higher low. We broke below, lower low, lower high, lower low. So, the 4hour time frame is indeed bearish. Now, at this point of us analyzing this market, this is pretty much what it looks like. This is our top down analysis at this point right now. So, if we were to look at everything on the daily time frame, which is probably my best my my I I say It's my favorite time frame
just because you can kind of see everything without it being either too far or too close in. You can very clearly see here where the weekly higher low and weekly higher high is. You can see where the daily higher high and the daily higher low is. And then you can see where the 4hour lower high and the 4our lower low is. Now this top down analysis looks pretty empty in my opinion. Right? You might be looking at all these lines and you might be Like, "Okay, Alex, cool. I understand that the daily is bullish because
of this and I understand that the weekly is bullish because of this." Now, what do I do with that information? Well, that information is actually extremely powerful because you understanding that you have two time frames in sync is the most powerful thing that you can possibly do. Now, you might be saying, "Wait, what the Alex say? Two time frames in sync?" Yes, you need two Consecutive time frames in sync in order to be interested in a trade. Now, these two time frames could pretty much consist of two different formats. You either have the weekly and
the daily or you have the daily and the 4 hour. You either have both of these that are bullish or you have both of these that Are bullish or both of these that are bearish or both of these that are bearish. If you were to have let's say for example the weekly time frame that is going to be let's say bullish and then you have the daily time frame that is going to be bearish and then you have the 4hour time frame that is going to be bullish that is not two consecutive time frames in
sync. You need to at least a minimum have two time frames in sync weekly and then daily or 4hour and then Daily. So you need to pick which ones you're going to trade together because that right there is what's going to let you know that you are trading with the trend. Now at this very moment you have the weekly and the daily in your favor. Meaning that you have the highest possible time frames in your direction. So it makes the most logical sense to buy. Now I'm not saying that it's a good time to buy
right now. I'm just saying that critique right there that we have Just done will remove 50% of the markets out of our watch list every single week because sometimes some markets just aren't consecutively having two time frames in sync. They aren't trending together. They are, you know, one could be bullish, the other can be bearish, the other can just be the other. It just doesn't even matter. They're not in sync. What you want to do is you want to create the base first by having two consecutive time frames in sync for you To be interested
in the trade. For you to be like, "Okay, cool. I have the trend in my favor with two time frames. All I have to do is either one, take the risk by not waiting for the third or wait for the third to go bullish and then I trade with that time frame as well." Now, at that point, all the stars are aligning and it's literally telling you to just continue buying. It makes everything extremely easy and it is not a high-risisk trade. Now, I get it Earlier. You might have seen me sell this AUD JPY
trade and I'll explain all of that later into the future of this video. That was a very high-risisk trade that I was taking and that's why I also took a very high risk trade on USDCHF and I lost. But that's just me trading, breaking the rules, and making mistakes right now. But I'm going to explain to you guys how to do things the right way first. Before you learn how to become a drifter or do a burnout in a car or even Switch lanes and and race, you first need to understand how to drive a
car, how to properly drive in the roads, and how a car even works. You can't think or compare yourself to somebody that is a professional street racer when you don't even know what a transmission is, right? So everything is baby steps, one step at a time. So for top down analysis, the main main main main main main main thing is to just determine where the market is. And right here you have pretty much Cornered the market, right? You have locked the market in to essentially this spot right here where it is right now. So the
market is very very very big, right? And it could be very intimidating when you look at it like this because you see so much happening to the left, so much happening up here, so much happening down here. But what if I told you that you no longer have to look at any of this stuff? This is all completely irrelevant. All you have to Focus on and look at is right here. This is all you really have to look at because this is your zone of where you're trading in. You're trading within the higher high and
higher low. Traders make a mistake and they're like, "Okay, yeah, this market right here, sure it's bullish, but then I'm going to make this level down here. here. I'm going to make this my support level, and then I'm going to make this my support level, and then I'm going to make this my Resistance level. It's like, all right, uh Jeff, you understand that if the market comes back into this support level that you're claiming that it should come back to, you understand that the market is no longer going to be bullish at that zone, right?
You understand that, right? You understand that if the market makes it to this support level that you claim the market should have a reaction from, the market will then be bearish because it's Breaking below the higher low, that is going to be then the lower low. And then if that is bearish, then there's an extremely high chance that the daily time frame is also going to be bearish and so is the 4 hour. So at that point, does it even make sense to buy? Absolutely not. It's going to make more sense to then sell. So
that is the beauty of the way that I trade. I eliminate all of the noise from the markets and all of the stuff to the left That can just cause confusion. And I basically let you dial in and focus on just a very specific part in the chart. And that's all you really have to do. You really only have to focus yourself inside of this zone right here. And I'm going to educate you now how to focus on this exact zone. Same exact thing goes for the daily. Traders would come here to the to the
daily time frame, excuse me, and then they would place this as a support level. Places as a support level like yeah once it gets here I'll then buy it and then yeah and then I'll I'll I'll sell it here. It's like bro you understand if like it comes down here the daily will be bearish and so will the weekly. Why would you even buy at that point and no longer make sense? So this top down analysis not only does it let you understand where the time frames are and where the market is but it also
lets you focus on a specific zone in the chart. We only need to look within this higher highs and these higher lows. We don't care what happened down here. We don't care what happened up here. That is completely irrelevant to what we have going on right now. This is where we are focusing on the charts right now. So top down analysis and the way that it works is all based off of market structure. Market structure will lead us to understand if something is bullish or if something is bearish. Now, we're going To be using the
line chart back and forth to determine that these structure points are actually valid and valuable. Now obviously we don't want to be looking at the 4our structure where we're in the daily just doesn't really make sense. So you can either do one thing you can you know double click this line can click visibility and then it just won't be available on the daily and then you can click the 4 hour here click on visibility and it won't be available On the daily. Now here you can focus on the higher time frame stuff. When you go
down to the 4 hour there, you're going to get access to the 4our higher low, lower high and lower low. Just a little bit of a of a tricky secret trick that I have sometimes when there's too many things in front of the charts and I want to clear things up, right? So, top down analysis is done. Just going to write this down. Top down analysis is to determine if something is bullish Or bearish based off the trend time frames. Once we determine that something is bullish or bearish, we will then place the higher high,
higher low, lower high, and lower low on the weekly, daily, and 4our to trap price. So, this right here is the stepby-step way. Do the top down analysis to determine if something is bullish or bearish based off of the trend time frames. So we know that the Weekly, the daily, the 4 hour are the 10 the trend time frames. Once you determine that something is bullish or bearish, we place the higher high, higher low, lower high, lower low, whatever the case is on these three time frames to trap price. Now that you have determined that
you these time frames are like this, then you're going to go to the next step. After you have done your proper top analysis, next comes area of interest slashs support and Resistance. slash not residence resistance slash supply and demand slashorder block. All of this stuff right here is the exact same thing. Area of interest is a support and resistance. It's a supply and demand zone and it's an order block. So once you've done your top analysis, which is what we've done right now, next we move into support and resistance and all of this stuff. So
let's get into that right now. Now, Before I I I show you how to do this on the chart, I first need to tell you what this is right here. What is support and resistance? What is supply and demand zone? What is an order block? What is a all of this, right? Very simple. Now, the market as as we have already said in the past, it moves based off of trend and structure points. Now all of these structure points right here leave a history or leave a trail in the market and this trail in the
market Tends to get respected time and time and time again when we cross through these areas. So a level of support or a level of supply and demand is just simply an area that the market has not only reacted to it once but it could potentially react to it again. So all of these elbow points, all of these structure points, they're leaving a story, right? They're leaving something in the past. And this in the past can potentially repeat itself again. So all Of these structure points say a story. Now, what if I told you that
whenever we're below it and it's done it in the past, it could potentially do it again. So if we just start off from this left point right over here, and we get a little little box, we get a little trusty zone. we start going to the left. As you can tell, when we are below, we are also indeed rejecting it. And what a coincidence that when we are above that zone, we are also rejecting it. All Right, cool. Now price has broken below this area. It came back and retested it. What a coincidence that we
also rejected when we're below. Cool. Now, what a coincidence. When we are above, we also came and retested it. Wow. What a coincidence. Exactly how we've done in the past. Exactly how we've done in the past right here as well. Okay, cool. Keep going to the left and just for examples purposes, we're going to modify this this right here. Wow, what a Coincidence. Whenever we are below, we are also rejecting it. So this right here where you are seeing this blue box, this right here is a supply and demand zone. This right here is a
support and this right here is a resistance. This right here is an order block. This right here is an area of interest. It is all the same [ __ ] Supply and demand zone, support and resistance, order blocks, all of this is literally the same [ __ ] People have complicated This over the last couple of years. I don't know why, but it's all the same thing. It's an area of interest. It's an area where the trade where once the market gets there, it's an area that you are interested in because the market has a
reaction from it. Whenever we are above, we use it as support. Whenever we are below, we use it as resistance. Support and resistance is extremely simple. Support is literally exactly what it Says. It is support. It is when price is being held up from something. Right now, if I were to push up from this table, I am using this table as support to then lift myself up. This right here is a support area. Price is using this area as a support area to lift itself up. That is my support to then stand up from this
desk if I want to stand up. But let's say I'm a [ __ ] giant and let's say I'm 10 feet tall. As soon as I stand up from this table, I hit the top of This screen right here that's going on. Or if anything, I can also do it like this, right? As soon as I stand up from the table and I use this as the support, I come up and then boom, I hit this top of the screen. This is the resistance level. This is what's going to then push me back down. And
then I'm going to try and push off of support again. And then I hit resistance, which is going to be the ceiling of the screen. And then I hit support. And then the top of the Screen is resistance. And then the battle goes on. Right now, can this resistance be used as support? And can this support right here be used as resistance? Absolutely. Right now, since I am above the support level, I am pushing price. I'm pushing myself up. But if I were to get out of the way and I were to get under my
desk, I can use this same uh uh no desk to push myself down. So, I'm using the same support area as then resistance to pull myself Down. Now, if I can somehow figure out a way to get on top of this screen right here and then I use myself as support, I can then make this resistance level a support level where then I'm going to grab myself and then bring myself up. That is exactly how price works. This right here is the support level. Whenever price is above it, it's using it as support. Whenever price
is at a resistance, it's using it as resistance. Can the resistance be turned into Support? Absolutely. We just have to break it and then retest it. Can the support, excuse me, can the supports be used as resistance? Absolutely. We just have to break it and then retest it. That is it. Support and resistance can both be used with each other. And they could be used against each other. They could be best friends. They need each other to actually validate themselves. If something is a very strong resistance level, it could be a very strong support Level.
If something is a very strong support level, it could be very much a very strong resistance level. They both go with one another. If this is very well respected when you're below it, when price is above it, it should also be very, very well respected. If this is very well respected when above it, when below it, it should also be very well respected when below it. Now, this right here is just basic support and resistance. And that is what an area of Interest is built off of, right? So, as you can tell right here, price
used it as resistance at this point. It used it as support at this point, at resistance at this point, at support at this point, and at resistance at this point. This right here is a perfect example once again of an area of interest of a support and resistance of a supply and demand zone and an order block. It is all the same [ __ ] It is an area of interest where whenever price approaches This area, it has a reaction. Now, an area of interest is only valid is only valid once we have a minimum
of three touches. A minimum of three touches. Now, these three touches, this right here is a touch of the area of interest. This right here is a touch of the area of interest. This right here is a touch of the area of interest. a minimum of three touches. It could be three resistance touches. So, for example, let's say we Don't have this right here. And let's say we don't have this right here. We move this up. This right here is a valid area of interest. We have one rejection as resistance, two rejections as resistance, and
three rejections as resistance. That right there is a valid area of interest. Yes. Now, what if we don't have this second touch as resistance and we have this touch as support? Well, this support right here is a third touch. So, we have one Resistance, one support, and one resistance. That is another valid area of interest. Well, what if we don't have any resistance and then it's all support? That is also a valid area of interest. As long as we have a minimum of three touches, it is a valid area of interest. Area of interest is
good for buys and sells. Is good for buys and sells. If you're interested in buying and it only has Support, that's great. If you're interested in buying and it only has resistance to validate the area of interest, that is great. It is all the same thing. As long as you have a minimum of three touches, this is now going to be a valid area of interest. If you're looking to buy and you only have resistance, that is also a valid support level. So, obviously, the more touches you have, the better. Obviously, if you have something
that has been rejected 15 Times, I would much rather be interested in something that has been retested it 15 times rather than something to three. Now, the area of interest, the more touches, the better because it means that it has been respected more in the past. Anything less than three touches, it is no longer a valid area of interest. It is not a valid supply and demand zone. It is not a valid order block. Could it be a Support level? Sure. Could it be a resistance level? Sure. But it is not a valid area of
interest. An area of interest is needed to enter a trade. To enter a trade, you cannot enter a trade if not at the area of interest. Now, if you not if you don't understand this right now, don't worry. All of this will make sense in just a second. You know, I don't expect you to get this right off the bat. Like, I I've just taught you what different trading Concepts are. On top of that, I just showed you everything when it comes to the candlestick charts. And now I'm showing you area of interest. Like, this
to me, this to me is crazy. Like, this took me so long to understand. Like, this was literally some [ __ ] where it took me forever just to get this right here. It's just crazy. So area of interest is needed in order for you to actually enter the trade. You cannot enter a Trade if you're not at an area of interest. So this right here is a valid area of interest. Let me ask you a question. Is this right here a valid area of interest? Yes or no? No. This right here simply only has
one touch. So this right here is not a valid area of interest. Making this not a valid area of interest. Cool. We move on. What about this right here? Is this, you know, we just do this for examples purposes. Is this a valid area Of interest? Yes or no? Well, we have one, we have two, and then we have three. Yes, this is a valid area of interest. All right, cool. Let's keep going. Right? We're just finding something that has three touches and we're going to count it as our area of interest. But this is
not how we find our area of interest. Is this right here a valid area of interest? We have one And none. Nothing to the left. So no, not a valid area of interest. We keep coming down. Boom. We run into this zone. What do we have here? We have one. We have two. And then we have three and four. Is this a valid area of interest? [ __ ] yeah. It is very clean and obvious that it has respected this area. Now once again, what am I showing you based this area of interest off of?
I'm showing you this off of structure. These are the elbows. The elbows are based off Of the bodies of the candlesticks. At no point are we including wicks here. Like if I were to be doing this on the actual line chart, for example, if we were just to go here to the line chart, I'm doing this area of interest to the elbows. If you notice this right here, we have one, two, three, four, five. I'm taking these elbows into consideration. At no point am I doing this area of interest to the wicks or am I
making the box big enough to include the wicks. No, I'm doing this To the structure points to the elbows. Now, how big should the box be? How do you do all that? Don't worry, I'm going to get into all that in just a second. I just wanted to really explain that and make that very clear. We're obviously doing it to the structure points. So, you continue to do it on the structure points, right? Let's just continue going down. Let's find something that has a minimum of three touches. Boom. We run into this price right here.
What do we Have? Can we arguably have three points here? Sure. You know, just for argument sake, we'll lower this in a little bit. one, two, and three. That is also an area of interest. Oh, that is also an area of interest. So, this right here is also an area of interest. One second. This right here is also an area of interest. And so is this right here, an area of interest. All right, let's just keep going down. Let's find another example. And keep working Our way down. And boom. We also have right here one,
two, and then three, one, two, and then three. And then we keep going and boom, three. And if we keep moving this to the downside, this right here, boom. Let's just call this one, two, and then three. Right? So, we'll call this one right here as well. One, two, and three, and four, right? Boom. So, right now, at this point, you're probably looking at this Market and you're like, "Yo, what the [ __ ] It was right in front of me the whole time, but also this is like so much [ __ ] going on."
Well, what if I told you that technically in this market right here, all of these are valid areas of interest. Yes, because they have a minimum of three touches, right? That is the core foundation to have a valid area of interest. Now, what if I told you that there's only one of these areas of Interest that are actually applicable, my [ __ ] accent that are actually editor, leave this in there. I have a major accent, guys. So, if sometimes my grammar or my my accent isn't the best, I did not know English until like
the other day, right? I'm I'm kidding. I learned it in in school, but Spanish is my first language, right? So there's only one area of interest inside of this chart that is actually applicable applyable whatever that is actually Appliable to this market. Only one area of interest is appliable to this market. Now which one do you think it is? Do you think that it's going to be the first one? Do you think that it's going to be the second one? Do you think that it's going to be the third one? the fourth, the fifth, or
the sixth. I'm going to go ahead and give you guys a minute to just think about it and determine which one of these areas of interest is actually applicable, applyable To this chart. One of these areas of interest stays. Every other area of interest is completely invalid. So, go ahead, pause this video and I'll give you guys a second to do it. Well, actually, let me see how I explain this. Let's do this. How about now? Yes. So, I kind of cheated there a little bit. I'm not going to lie because I I read the
market structure incorrectly. But at this point, right now, there's technically only Let's do it like this. If we were to do this market structure like this, just for this example's purposes, right? So, let's just get rid of this first one. Just for this example's purposes, there is only one area of interest that is appliable to this market right here, and that is going to be area of interest number two. Now, you might be wondering why. Well, I I mixed it up a little bit, and for some Reason, my return tool isn't working, but I'm literally
trying to trying to click that [ __ ] but it's not working. Um, it's because I read the market structure wrong, but technically this market was bearish. So technically this was the lower high and this was the lower low and technically multiple of these areas of interest are valid but just for this example I wanted to make it bullish just so it can connect a little bit more. So there's only one Area of interest in this market that is actually valid and that's going to be number two. So area of area of interest number three
is not valid, four is not valid, five is not valid and six is not valid. Now you may be asking why. Well very simple. This right here is the higher high. This right here is the higher low. If this is the higher high and this is the higher low, you can only have an area of interest within the higher high and the Higher low. Having an area of interest below the higher low completely defeats the purpose of having identified if it's bullish or bearish. Because if the market makes it to this area of interest, we're
then bearish and we're no longer looking for buys. If this market is bearish, we're going to be looking for sells. Could it be an area of interest for then for us to sell? Of course, for sure. But we're not there. We're very far from that. We're way up Here. And if we have all the indications telling us to buy, why would we place an area of interest to sell? We don't. So, we get rid of the areas of interest that are not valid and have absolutely no use to our trade this area of interest. Once
again, below the higher low, it's not valid. Not valid. and not valid. So now we've taken all of this noise, all of this area of interest, all of these structure points and we have completely removed them all and just focused on one Part of the chart on one area of interest on one zone where the market has a very high probability of having a reaction from this area of interest. So, I basically just answered a question which I'm sure I would get and that is how where do I place the area of interest and how
do I know it's a valid one? Well, simply because you could only place an area of interest within the higher low and within the higher high. So, if you guys were paying attention to What I said earlier, you guys would have known that I said we only look within this zone to actually trade. So, we're only going to place an area of interest within this zone. So our area of interest will only be inside of here. How many areas of interest can we get? Could be an infinite. You can get a thousand, 500, a quantillion.
Obviously these are not real numbers. The most you can actually really get will probably be four and five. Could you get more? Sure. But the less the better because you want better quality zones rather than an abundance. You want quality over quantity when it comes to identify these areas of interest. So an area of interest is identified on something that has a minimum of three touches. An area of interest is good to buy or sell whether you are above it or below it. As long as we have three touches, the more touches the better. And
an area of interest is needed because you need to Enter a trade at an area of interest. You cannot enter a trade if it's not at the area of interest. And you can only only find an area of interest inside of the higher high and higher low or the lower high and the lower low. At no other point can you find the area of interest elsewhere. If you put an area of interest up here, it's pretty much [ __ ] because dude, we're like like the market hasn't even gotten there. And if we're looking to
buy, we can't buy at A [ __ ] resistance. Like, how does that make sense? You're basically betting that you're going to break through a resistance. And that's not logical. You want to buy at a support level. You want price to be at a support level and then it push itself off of it. That is simply the logic when it comes to trading. So when you buy, you need to buy at a support level. When you sell, you need to sell at a resistance level. So you buy at support and then you sell At resistance.
At no point do you break this rule right here. This is probably the simplest thing that I can write in this whole entire class and it will probably be the most valuable. I cannot stress to you guys how many of you guys are buying at resistance or selling at support. Like how does that make sense? If the market is going down, right, and the market is going down and you are literally at a support level right now where the market Has reacted to it three times from this level. Why are you selling into this level
where literally historically what it does from here is have a reaction. Why are you buying from this level? Some people just don't they don't they don't know what to say. Some people just don't have an answer. They're like, "Well, I didn't know." Well, no [ __ ] you to know cuz you wouldn't be doing that. This is like jumping into a twoft pool. Why the [ __ ] would you do that? Like you're Going to literally smash your face. Is there a one in a thousand possibility that you know you happen to break through the
pool and and break the concrete and then go through the the foundation. Yeah, if you're Superman or some [ __ ] But the odds of that happening are very rare. Can it happen in trading? Yes, of course. But I'm talking about in real life, right? You would never jump into a twoft pool. So, you would never sell into a support Level. You sell at a resistance level. Once price is at an area where it has had more than three touches, this right here is a valid resistance level. You sell from a resistance to a support.
You buy at a support into a resistance. At no point do you flip those tables around. If the opportunity is not there, you simply don't do it. Let's say you really want to take the trade at this resistance level right here. Please, by all means, but you need to be above it. Price cannot be below it. You need to be above it. You need to be above this area for you to really buy at this area. But if you're below it, what confirmation do you have that it's actually going to react from it if it's
yet to do it to the past? It's never done it, so why would it do it now? So when it comes to area of interest placements, I need you guys to understand that you are placing in between this higher high and this higher low. And our job as traders, literally our only job is to wait for this retracement. So we know that this is bullish. Our job is to wait for this retracement to happen. And this retracement can literally happen anywhere, right? This can happen here and have the push up. Here and have the push
up. Here and have the push up. This retracement can literally happen anywhere in the chart. Now, we have a higher probability of it having a Reaction from here than from here. Why? Simply because if you look to the left, this area has only been respected one time. And this area here, this area here has been respected four times, five times. So, if the market makes it to this area, the odds of it reacting are going to be a lot higher than this one. Can the market still have a reaction from this level? Of course, and
it will. And then you won't be able to enter this trade here. But with a proper strategy And trading with a plan, you need to take the trade where it simply makes sense. And it will always make more sense to take the trade here than to take the trade here. So trading with areas of interest or support and resistance is literally getting you to be able to pretty much predict precisely where this retracement has the highest probability to stop. Once it stops at this area, then you start to apply extra confirmations and then see if
you're Interested in entering the trade. This retracement is going to be a key fundamental to your success in trading. Whether you are patient enough for this retracement to happen or not, that is entirely up to you. I can't teach patience. I can teach you what you need to know in order for you to apply patience, but patience is what's going to either make or break you as a trader when it comes to applying any type of strategy. So, back to areas of interest. Areas of interest are placed in between the structure points. There is a
never-ending amount of areas of interest, right? If if I were just to let's just say just for examples purposes, I'd bring this structure level up here and I'd bring this structure level up here just for examples purposes. This right here would also be a another area of interest. Why? Because we have one, two, and then three. So, this right here Is a valid area of interest. Now, price is going to have a retracement. On this retracement, we can potentially have a push up or we can make it to this area and potentially have a push
up. That is it. Our job as traders is to wait for the market to make it into this area. And when the market makes it into this area, we apply our strategy to enter the trade. That is it. You only buy at this support. Now, let's say the market just keeps going into this area, keeps having A push down, keeps having a push down, and from here it just does something like this. It breaks below the area of interest. Do you still buy it? No. Because we did not respect the area of interest because this
market can now use this as resistance. What did I just say in this example over here? This example, you cannot buy at a resistance. So yes, even though we've had the retracements and we've broken below price, technically right now we are below this Resistance exactly how we've been here, exactly how we've been here and exactly how we've been here. So this is destined to literally create a move like this. Can there obviously be the events where it from here does this? Of course. And that will happen and that is inevitable. But in order for you
to enter this trade, you want to wait for it to actually break above this area and then use it as support. You need for it to actually come back and retest it as Support. How it has done here and how it has done here. You need to use it when price is above it, not when price is below it. Once price has broken above it and it comes back into it, that is when you use it. Could you use it right as soon as it breaks above it? Sure. But I'm going to be teaching you
guys on how to have the extra confirmations to actually use it when it comes back into it and uses it as support. I'll explain all that later when we get to the Entries and how to actually start applying a strategy. Right now, I'm just teaching you what areas of interest it is, what is support and resistance. Like, this is all very basic standard stuff. I haven't even taught you guys anything of a strategy yet. The only thing that I did teach you is how to properly place this area of interest. So many of these traders
just place these areas of interest randomly in front of the market and they just place it Anywhere. They're literally just putting zones throughout the whole entire chart and calling everything a supply and demand zone, an area of interest, so you could just pretty much get bombarded by this information and you buy into their [ __ ] because they make it seem like you need them. They're trying to manipulate you so they can get you to make them feel like they have this better understanding of the market and that you need to learn from them and
you Need to follow them and you need to No, you don't have to do none of that [ __ ] Having an area of interest only makes sense to have it within the higher high and the higher low. Very [ __ ] simple. So, can it break below it and can it have a reaction and move to the upside? Sure. Now, this is where I would use this support level. If it breaks below it, I would not be buying below it. I would only be using it if we break and retest above it. But for
this example, Let's just say that we did something like this. Sure. Let's say we actually had the move and we had the push to the upside. Cool. Our area of interest is validated. And guess what? What happens now? But we have a new higher high. And where's the higher low? I don't know. Get the head of the snake. Start working our way back. Make the first turn. And now that right there is going to now be the higher low. All right, cool. If That's the higher low, we got to start cooking again. we got to
start finding the next potential area of interest where this market is going to now have a reaction from. So the way we find an area of interest properly, right, is by getting this box at the top of the zone. And our job as traders is to start working our way down all the way to that higher low and find points where the market could potentially have a reaction from. So we start working our way down, Working our way down, working our way down. Boom. We run into the first resistance. Is this a potential valid area
of interest? No, because it only has one touch. Cool, cool, cool, cool. We keep working our way down. Keep working our way down. Keep working our way down. Boom. We run into a second spot. Well, you know what? This is actually pretty close to this spot. And it's pretty close to this spot. Let's see if we can Get a very tight small zone. Sure. We We have one, two, and three. Three touches makes a valid area of interest. So this is the first potential area of where the market could have a retracement to then have
a reaction to the upside. That's just the first potential area. Right now we have absolutely no idea from where else. Bring out our trusty box. So we already understand this is area of interest one. Let's keep working our way down. We can boom. We run into this structure point right here. Can we add another structure point right here? Sure. We have one, two. Is that a valid area of interest? No. Can we make a big zone like this and we get one, two, three, four? Sure. But the zones have a maximum and minimum sizing of
these zones. And I'm going to get to the sizing of these zones once we actually get to the charts. But the max a zone could be is going to be six, Excuse me, is going to be 60 pips. Max a zone could be is 60 pips. Anything bigger than 60 pips, it will no longer be a valid area of interest. So the max a area of interest could be is 60 pips. So we're going to add this as another side note over here. Alex, how do you measure the pips? I already taught you this. You
use this tool over here to the left hand side. Start from the bottom, work your way up to the top, And what do you have here? This zone is now going to be 70 pips, making this too big of a zone. The biggest an area of interest could be is a total of 60 pips. This zone right here is 70 pips, making it no longer valid. We start off from this zone to right here. You can tell this is 28 pips. That is perfect. That is half of the maximum a zone could be. Now, could
you have something smaller? Yes. I'd say the smallest a zone could be. So, the max it could be is 60. And Then the minimum it could be is five pips. You never really go that small, but just in case if you do for people that ask that question, a minimum of five pips. So, this zone right here, as you can tell, it cannot be used as a valid area of interest. one because this one right here doesn't have a minimum of three touches. And then that one right there is more than 60 pips. Right? So,
we start working our way down. Working our way down. Working our way down. And Boom. What do we run into? One, two, and then three. What do we have here? A valid area of interest. Now, we can make this one very tight. As you can tell, this one respects it very, very, very strong. So, we can make this one five pips like this. Or we can make it the actual max length, which right here would be 62 pips. Let's just call it 60 pips for this example's purposes for us to then have a fourth structure
point. Could we do that? Sure. But personally, myself, I would much rather have this zone be as tight as it possibly could be. I wouldn't want to stretch it out to have more touches. I would rather make it just be tight. The tighter the better and the more respected it's going to be. So here we have one, two, three, and four. That right there is a valid area of interest. Now I know a lot of people in the past have asked me when I do classes and when I educate people, can We consider the actual
higher low a area of interest? Of course. If the higher low happens to have three touches, sure. So for examples purposes, this one has one, none, and none. And no, we cannot go below the higher low to add touches to the area of interest because if we go below the higher low, guess what happens? We are then bearish, making this no longer a valid area of interest. So now this market right here, we've just done the top down analysis. We've Determined that this market is bullish. And now we've found two areas of interest. This right
here is going to be daily area of interest number one. And then this right here is going to be daily area of interest number two. So these are two areas of interest where the market could have a retracement into this level. And after having the retracement into this level, it could potentially have a reaction. Now again the the big important thing is Potentially uh one of these areas of interest could do it or none of them this area of interest right here area of interest number one is not stronger than area of interest number two
area of interest number two is not stronger than area of interest number one quote unquote obviously if it has more touches it's supposed to be stronger but that doesn't mean that I would prefer to enter the trade at area of interest number two rather than area of interest Number one they're both equally as much respected to me personally. And the only reason I the only time I take into account how many touches is inside of the area of interest is when it comes to the entry signal and I'll be explaining that later inside of the
actual entry signal area. But for right now, to make a valid area of interest and to wait for the market to have a retracement, this is all I need. I need my areas of interest and area of interest one is Equally as strong as area of interest 2. I would never pick one over the other. Even if this one has a 100 touches and this one only has three, the market can have the reaction from both or from none. The market can simply have a reaction to right here in the middle and then have a
push to the upside. And a lot of students ask me all the time, they're like, "Alex, what happens if the market does that? What happens if it actually has a retracement either in the Middle and it doesn't hit any of your areas of interest or right above your area of interest and it never hits it and then it has a move to the upside? What do you do then?" The answer is nothing. You don't do [ __ ] That wasn't your trade. That never met your strategy. You move on to the next [ __ ]
pair. Why are you trying to figure out to make something work when you already have something that works? You just have to wait for it to happen. Why are you trying to make everything work when all you have to do is wait for one thing to work? Don't try and catch every move. I don't I don't try and catch every move. You know how many moves I miss a week and I still predict the overall trend, but they never come to my zone. So, I never take the trade. I just say two to three moves
every single week. Hundreds of pips. Hundreds of thousands of dollars. But I also avoid hundreds of pips. And I also avoid Losing hundreds of thousands of dollars by sticking to my plan. It's never worth breaking my plan just to try and catch a move and prove a point because I know how to trade or I know how to identify the trend. Waiting for the trade to these areas of interest is going to be the key thing. So now let's say for example, this market actually does this, right? This market has a push to the upside.
This is the higher low. This is the new higher high. Make this a new Higher high. This will be the higher low. Obviously, this area of interest is no longer valid because if price gets to there, we will then be bearish. And this obviously this area of interest is no longer valid. Now, on the daily time frame, if I were just to place this area of interest, start working our way down. Boom. We run into this structure level here. And then, guess what? That's it. There's no three touches here. There is no three touches here.
There's barely Two touches here. Can there be a scenario where there is no area of interest? Of course, this is 100% a possibility. Does it happen? Very rarely does it happen. But if it does, there's just simply no area of interest. You just simply go down to the next time frame or go up to the next time frame and wait for an area of interest at that point. Right now, I'm just teaching you what an area of interest is and how you can identify it. There's 110 million Different what if possibilities and one of them
is this. And if that happens, well then that happens. Now let's say this market, for example, just does this. All right, cool. Now what? We're bearish. This is the lower low. Where's the lower high? Right up at this point right here. If this is the lower high and this is the lower low, guess what? We're now going to get our area of interest in between like this. And then We're going to do the exact same thing. just now working our way up because our job is to predict this pullback and on this pullback for us
to then potentially take this out. Now, where does this pullback stop? Well, it's the same thing. We start working our way up. Boom. We run into this area right here. We have one, two, and nothing else. Oh, I lied. We look a little bit more left and bang. Cool. Let's call it right there. We have one, Two, and three. That right there, ladies and gentlemen, is a valid area of interest. That right there is indeed considered an area of interest. Area of interest number one. One, two, and three. Cool. We have the first area of
interest. We just simply go ahead and start from this point right here and keep going back. We have one, none, none, and none. No area of interest. We keep working our way up. Boom. We run into this right here. One, two, and Three. So, we already had this area of interest in the past. Very clean, very obvious. We keep working from this point right here. We keep working our way up. Bam. Boom. Guess what we run into here? One, two, and three. And I'm sure we can squeeze this one in here for four. One, two,
three, four. And then if we keep working our way from the top, from this right here, keep working our way from all the way right here, we run into that point. There's only one structure point There. And then there is another one like this. How many pips is this? This is a total of 52 pips. So technically on this lower low leg there is one, two, three and four areas of interest that the market can potentially have a reaction from. The market can have a pullback to either here and have a reaction here and have
a reaction here and have a reaction or here and have a reaction. Once again, is this something that can often happen that you would Have four areas of interest? Yes. But our job as traders is just to wait for the market to get to every single one of these or whichever one of these it gets to and then us apply the strategy to it. I can say based off of my experience that if I were to have four areas of interest, my strategy would probably have a full check off checklist at maybe one or two
of these areas of interest. Now, not because the area of interest isn't valid. It's just because the Market isn't going to react to every single one of these. It's probably going to break right through this one and then maybe here it'll have a little bit of a reaction, but then I don't get the proper entry signal that I need. And then it'll actually make it to this area right here. And then here is where I then get my entry signal and then I actually take the trade. If I miss this trade at this area, can
then I enter the trade if it breaks below this area of Interest to then sell? Sure. Yes, you could do this. These are all different possible potential scenarios and hypotheticals of things that can happen. But our job is to wait for this retracement. So once we get this, we can then sell. So this is just a very simple example of a sell markets. Same exact thing. This is now the new lower low. For example, this is now the new lower high. We could invalidate this area of interest. We could invalidate this area Of interest. This
area of interest could stay because it's still within the lower high and the lower low. We just do the exact same thing. We start working from the bottom right into this point right here. We can find one, two, three, and let's just call this one four. Don't worry, I do this very fast because I think I've been doing this for longer than I can remember. But here we have one, two, three with this point right here, four, five, and six. So, let's Just say we have two areas of interest in this market. Same exact thing.
We're waiting for a pull back into here to then sell or a pullback here into then sell. That right there, ladies and gentlemen, is how area of interest works. How you can spot it in the middle of the market and how you use it with market structure. Now, we go do this in the real market in real time. It is no different ladies and gentlemen. If we come here to the weekly time frame, we can only place a weekly area of interest within this higher high and within this higher low. Now, same exact principle applies
as to the trend. For you to identify the area of interest is going to be the exact same thing. So, here we're going to do weekly and area of interest. Daily and area of interest, 4hour, there's going to be no area of interest. So, we only look for an area of interest on the weekly and on the Daily. But we use these three time frames to identify the trend. But we only find an area of interest on the weekly and the daily. Now, some of you guys may be asking, why are we going to only
find an area of interest on the weekly and the daily? Well, the truth is that the market is going to be respected so much more from the higher time frames compared to the lower time frames. In the 4hour time frame, I have found that I can have 10 areas of interest. And I Don't want 10 areas of interest. I want maybe one, maybe two, max three. I don't want more than three areas of the market could potentially have a reaction from. And I always want to trade with the higher time frames. Not because I'm a
swing trader. I don't want you guys to get that confused. It's because I like to trade with the higher time frames backing my trade. I want the weekly and the daily trend to be in my favor so it can push my trade in that direction. I Want to buy or sell the market at a daily or weekly area of interest. So that support level is being pushed by the higher time frame. I want to buy at a daily support because that's what's going to give me that daily push to the upside. I don't want to
do it off of a 4 hour. A 4 hour area of interest could break and retest it 10 times within the same day. On the daily, it'll take much longer just simply because the candlesticks take much more to move. So They get respected a lot more. So in order for me to find an area of interest on the weekly, I have to go back max five to six years, the exact same time it takes me to identify the trend. And I only have an area of interest in between the weekly and the daily. No area
of interest on the 4 hour. So if I were to get this area of interest and I were just to drag it left, I don't really have to go further back than let's say two years. But for example, right now on The weekly time frame, we understand that that is the weekly higher high. That is the weekly higher low. And what we could start doing is working our way down. If we start working our way down, what do we run into? If we don't have a clear vision, we can go to the market structure. And
in the market structure, what do we have? For example, right here, we have one, two, and three. Can that be a valid area of interest? Sure. Can we Make this a very tight area of interest like this? We have one. We have to include this one right here for it to be a valid one. One, two, and three. Technically, four if we include this as well. So, we can probably move it up just a little bit. And nothing else to the right. Now, let's see how that looks like on the daily with the candlesticks. Very
clean on the daily. Very clean elbow here. Very clean elbow here. And very clean elbow here. This one is not So clean on the candlestick chart, but we still indeed have three very valid elbows including the candlesticks. So maybe on the line chart you can have 10 structure points but when you go verify this on the actual candlestick chart you maybe only have five. So you always want to use the line chart to make it a obvious area of interest. After you make it an obvious area of interest, right? So we would also have counted
this right here. So that's an obvious elbow Rejection from this area of interest. We then go to the daily to confirm that it's a real rejection or a valid elbow. And then there we would actually remove it and be like okay it's not as clean for example as this one or this one or this one. These are more obvious reversal points. So even then this is still a valid area of interest. So this right here would be a weekly area of interest. We keep going from this point down right here and uh keep Working our
way down. So we go back to the line chart. Switch to the line chart. And on this line chart, we're going to now identify the next potential area of interest. Start working our way down. Working our way down. And boom, we run into this right here. We have one, two, three, four, five rejections from this area. All right, cool. Can make this a very tight zone. Also, by the way, we have to measure this zone. I forgot it. So, we measure this zone. We Have a total of 54 pips. So yes, this is a valid
area of interest as long as it's below 60. Cool. This area right here, we have one, we have two, we have three, we have four, five, and then six. Let's go check out the candlesticks to confirm that that [ __ ] is legit. This one's okay. So, we have one. This one's okay. We have two for sure. three, four, and five for sure. Okay, so we can technically remove this one. I like this elbow. I like this Elbow. I like this. I like this. And I like this. Very clean break, retest, sell, rejection, sell. Cool.
So that's area of interest, too. Not bad. So we have a weekly second area of interest. Next, we're going to continue going down. We're going to go all the way until we make it to the higher low. We stop at the higher low every single time or we stop at the lower high if we're looking for sells. Right? So now we continue going to the downside and we Then run into boom this structure point right here we have one two three four and five. All right. Cool. Right here we also have one two three four
and five. So if we were to once again get our trusty circle and do this right here. And I've never seen anybody do this. how I'm walking it with it. Like you guys right now, everybody tries just to speed through this stuff. Like I really want to generally take my time so you guys can Learn from this because I'm telling you, I searched the internet for [ __ ] months to understand this. Like you guys have no idea. We go back to the candlestick chart. This is a clear rejection. This is a clear rejection. Very
clear. Very clear. And not so clear. I would not count that as a structure point. I would count this one. I would count this one. Yes. And yes. Even then that is more than three that makes that a valid area of Interest. Now this right here technically are the three weekly areas of interest. This is weekly area of interest number one, weekly area of interest number two and weekly area of interest number three. That right there as you can tell ladies and gentlemen is a very clear indication that these are the potential areas where the
weekly time frame could have a retracement to buy, retracement to buy and then retracement to buy. Now, what we would Do is we would go down to then the daily time frame, right? And on the daily time frame, we're going to do the exact same thing, but for the daily higher low and for the daily higher high. So, we're going to have this blue on blue box be the weekly area of interest and this blue on blue box be the weekly area of interest. This is also the weekly area of interest. But for the daily
area of interest, we're going to have a red outline, right? So, we're going to get This box right here and we're going to make the outline of this box. We're going to make it red. So, we can start off once again at the high of this market. And we can just basically start working our way down. Start working our way down. We're basically going to run into this structure area right here. Resistance, support, support, and we can look more left. We're going to see more structure points coming up to the left hand side over here.
In just a second, We're going to see more structure points. And the goal for us to do here is just to try and minimize as much noise as possible and focus on as many things as just focus on like the the clear market structure points. And right here, as you can tell, we can have here one structure point up here. Two, go a little bit more to the left. And then we can also focus on one, two, three, four, five, six, seven. Right? So we have more than three for sure. Let's look at it on
The candlestick chart. So right here as you can tell we have one two three four five six seven eight nine at that point right there we got 10. So obviously there is also a valid daily area of interest right in here. Now if you can tell what a coincidence that that daily area of interest also happens to be the weekly area of interest. Right? So just putting that on to the side and that's going to be important later on. Right? But for now let's just let's keep going. Right? Let's focus on from this high point
up here, working our way down from this point right here. And then boom, we run into this next structure points that we have right here. Obviously, for just the simplicity of the video, I've skipped this structure point. Then I've gone to the more obvious one. Can there be more structure points at this area right here that I have just identified over here? And I go more to the left. Sure, I'm sure we can find some Structure points there. You can find three touches anywhere, but our goal is to find the three closest touches to where
price is right now and the most relevant. If you have to go back far left, you could. No problem. But you want to get the most strongest and most relevant points. Now, if you notice right here on the daily time frame, what do we have right here? Well, 1 2 3 4 5. How does this look like on the candlestick chart? Perfect. 1 2 3 4 5. We have another area of interest. And what a coincidence, we can also align that with our daily higher low. Well, would you look at that? We have weekly area
of interest number two happens to also line up with our daily area of interest number two. So now this right here is pretty much a perfect coincidence, right? I wish I would have known this before I even started this analysis. So, it would have been easier if it wasn't, but it would have been Easier because I could have separated the areas of interest and stuff like that. But this right here shows you how areas of interest from the weekly and the daily happen to align for this example right here. We're going to go through all
those examples where they don't. So, for now, we're just going to remove this weekly area of interest, the third one, because there's so much that price has to come back through and actually be able to break before getting There. So, now we go back to the weekly time frame. This is what it looks like. This weekly area of interest happens to also be a daily area of interest. This weekly area of interest happens to also be this daily area of interest. So what do I like to do in a scenario like this when we have
two overlapping areas of interest. What I like to do is to combine them as much as I can. I like to find the happy medium. I try and see if I can make this area of interest right Here on the daily somewhat fit in the middle of this weekly area of interest. And if it could still have more than three touches to fit inside of this area of interest, then I would just minimize throughout the top. So, as you can tell here, I moved it down a little bit and I have more taps here, more
taps here, more tabs here, more tabs here. And what I try and do is just make this as tight as possible. So, 60 pips is the biggest, but the sweet spot is around 20 to 35 Pips. Now, this daily area of interest is right at that 25 pip mark. And I'm sure that I can squeeze this weekly area of interest to this structure point and then squeeze it right into that daily structure point as well. So, if we go out to the weekly, let's see if we have a minimum of three touches with that right
there. As you can tell, indeed, we somewhat still do. I would have to move the weekly a little bit higher for us to actually get that right there for us to Get that right there. And then, in order for us to also count that structure point right there. So, right there, we are counting that structure point and that structure point, what I can do here as well is move the daily time frame up along with that weekly. And then, boom. Right there we have a perfect daily area of interest that aligns with a weekly area
of interest. This is a beautiful sweet spot. This right here lets me know that if price retraces to this area, Which is where we are right now, not only are are we at a daily and weekly area of interest, but they're both overlapping. And if it just doesn't get respected here, then it has a higher probability of coming to this area and then basically respecting and having a reaction from that point right there. This right here is beautiful. I love to see this. I love having both of these confirmations because this just lets me know
that these time frames are actually In sync. The weekly and daily are in sync. Areas of interest in sync. All overall, it makes sense to actually enter this trade as a buy rather than a sell. Because at the end of the day, that's all we're trying to do. We're trying to make this trade make more sense that it's going to go to the upside and to the downside. So, right now, this is very, very, very simple, over-the-top top down analysis. Now again, if this looks a little bit Confusing, you know, you don't have to leave
these lines up here. You can you can move them if you want. I like leaving them sometimes because it just gives me an overall idea of where the market is. And it lets me know that I should only be focusing inside of this zone right here. And it lets me know that all I have to do as a trader right now is wait for price to actually have a retracement into this zone for the market to have a reaction from there or Let the price come into this zone and then let the market have a
reaction from there. This right here is what 99% of traders cannot do. Right? Traders cannot identify trend. Traders cannot identify market structure. They can't even tell where to properly put an area of interest or where even the market is. Now, we can very clearly tell if we were just going to look at this market based off of market structure. So, if I were just to look at this for the structure Of the market, which is what we should always look at it, but on the candlestick chart rather than the line chart. If we were to
look at it just on the candlestick chart, just so you guys get a visual, if you look at this without any of the drawings, what does this look like? If I were just to focus on this move right here, this looks like a perfect break, then a retest to this structure point and then a push to the upside. What a coincidence that Structure point happens to be the weekly area of interest and also the daily area of interest and also at that daily higher low. If I were to pick an area of interest, if I
were to pick one over the other, I would for sure pick this one just because it's more of a textbook trade. When you see a textbook move, you see something like this. Comes back to this structure point. Then it just continues to go up. If you ask me, that is exactly what this is right here. That Is the previous structure point. That is the break. And now we are on the way to retest that to potentially have this move to the upside. So that right there is just basic market structure. I have taught you guys
what is top down analysis, how to use these time frames in sync to determine if something is bullish or bearish, and how to place a proper area of interest. All of this is quote unquote still very beginner stuff but also getting into a bit intermediate Just simply because all you need now is just practice. Go out there and go practice this because that is going to be the crucial part of you to actually perfect it and see it as effectively and as quick as I do. But to this right here, what I am showing you
guys, this took me a year to understand, a year to really like get it and like put it into practice. ICS took me such a long time and so many wasted hours of just placing market structure Incorrectly putting areas of interest in areas where it didn't even make sense. Just so much wasted time which obviously led to waste of money that you guys can't even fathom. Like I'm making all of this in one video. But I also don't want to overload you on information that it's just me repeating myself and I want to make sure
that you get the point perfect and then you can go on and go practice it. Right? So right now that is top down analysis. That is how it is. it Has worked. We do a top down analysis from the weekly to the daily to the 4 hour to determine if something is bullish or if something is bearish. Once we determine that we have two consecutive time frames in sync how we have here for the weekly time frame where this would be the higher high and this would be the higher low. We then go ahead to
the daily time frame. We identify the higher high and then we identify the higher low. We then just do It on the 4 hour just to see if we have that added time frame. Then we place our areas of interest within these higher highs and higher lows. And then we can tell that we're only looking at this right here in the market. And we're waiting for the market to come back, retest this zone, apply the strategy here. If we don't get it, then we wait for the strategy to get applied here. Now, once again, if
the market for some reason somehow breaks below this area of Interest, could we then have a reaction from the middle of this area? Do we buy in the middle? No. Do we buy at the bottom? No. We have to wait for the break of it, come back, retest it, and then you have the trade to the upside. This right here would be the perfect trade setup. As long as we are above the support level, we either take the trade fully at this area of interest or above this area of interest or above this area of
interest. There's no if ends or buts About that. You need to buy at a support and you need to sell at a resistance. Now, for a sell, pretty much just the complete opposite. You can literally just flip the chart. You right click this section in Trading View and then you click invert scale. And then it's pretty much the same exact thing. You have the bearish move. You have to wait for it to come back to retest this structure point to then sell. Or you would have to wait for price to then Come back and then
retest this structure point over here to then sell. Either one are equally as strong and each one of them are equally as valid. You just have to wait for the strategy to be aligned at that point. So with that being said, let's move on to our next point which is going to be kind of handinhand with what we are talking about with right now and it's probably going to be one of the most common things you've heard if you've Heard anything about trading and probably one of the main things that I personally use on a
daily basis and it's going to go handinhand with everything that we're talking about right here and that is going to be break of structure slash break and retest. test slashtouch slash shift of structure. All of this right here is almost the same thing. This one right Here is the only one that is different to every single one of these. Break of structure, chach, and shift of structure are all the same [ __ ] So, let's start off with break of structure. Right? This market right here is clearly bullish, right? We know that already. We know
that this is the higher high and we know that this is the higher low. Cool. What happens if this does this? Well, [ __ ] [ __ ] We just broke the structure. We broke the higher low. We Shifted the structure. We ch What the [ __ ] is chach? I don't know. All these fugazi traders came up with this [ __ ] Chach is equal to change of character. This is what chach means. Change of character. Change of character. It they were identifying this that the character or the what it identifies as was bullish.
Now it has changed that identity to now bearish. Same [ __ ] [ __ ] as shift of structure. Same [ __ ] [ __ ] as break of structure. That [ __ ] Pisses me off how they put all these different names to all these same exact [ __ ] They just [ __ ] complicate everything. Change of character is when the market shifts. When you changes from bullish to bearish. Simple. Break of structure is when this was the previous structure and we break it. Shift of structure is when this structure shifts from bullish
to bearish. Easy. Change of character is when you change identity from being bullish to then being Bearish. Simple. Now what is break and you guys already know this I have pretty much have been doing this for the last two hours right doing shift to structure doing breaks of structure now what is a break and retest now this one is uh probably the the easiest one to explain so let's say price is currently being held up at a resistance level how we were previously right or how we were doing for these examples right so this right
here is a valid level of Resistance so the resistance is clearly trapped within this spot right here and we know we cannot actually enter the trade at this resistance. What would we need for the market to do? We would need for the market to break above this area and come back into this area to then actually buy. We need to buy above it. Well, this right here is called break and retest. And break and retest is exactly what it says like the name of it. It's a [ __ ] break and retest. It Is extremely
easy. It is extremely self-explanatory. All you do is wait for the break and the retest for you to take the trade to the upside. That is it. It is really that simple. Break and retest are very crucial for you to take. Whether it be on a area of interest, whether it be at a resistance used as support, at a support used as resistance. You can only take the trade once you've had the break and then the retest. I get thousands of Messages throughout the weeks of asking, "Hey, Alex, can I enter the trade at the
break at the high?" Yes, you could. You could enter the trade at the break. Just understand, you cannot add that as a break and retest confluence. And we're going to get into confluences later into this video, but you understand that it's just a break. It's not a retest. A retest is when something comes back, it retests it. it uses it as support and then you can be interested in buying the Trade to the upside because that's where you anticipate for this trade to actually have the move to the upside. Could you count something as a
breakout and add it as a confluence as a breakout? Sure. But it's always a 50/50 chance if it's going to come back and retest this point. Now, if it comes back and retests this point, it is once again another 50/50 chance that it's going to actually have the reaction from it because it could have just done this Right here. And this is a fake out. This is a liquidity grab and then guess what? It continued back into this area and then price stays ranging in the zone or just rejecting this resistance. Personally myself, I rarely
I'd say 30% of the time I get a breakout. I enter at the breakout. Now, the breakout, as you can tell, I'm doing everything based off of market structure. The breakout is based off of the candlestick of the market. It's not Based off of the wick. It's not based off of the the tail, the do. It's all based off of the actual body candlestick closing above this zone. So, this zone is at these structure points. It's at these bodies. And right now, we have a body that has actually closed above this area. That right there
is a confirmed break. Now I sometimes enter on that break. Just depends the momentum where I am in the week as a trader as a whole. Where's my mindset? How much I'm Risking? How many confluences I have? But the correct thing to do is to wait for the retest. Now in the retest, you want to wait for the body to retest this area and then you get some wick rejections. And those wick rejections is one of your entry confirmations to enter the trade. So can you enter the trade on the body closure above this area?
Sure, but you can only enter properly on the retest and then you need proper body rejections on that retest. Perfect Example could literally be this right here. As you can tell, this is a very valid level of resistance. As you can tell here, this is resistance, resistance, resistance, very valid resistance and area of interest. As you can tell, this right here, these are all wicks. This is not market structure. This is all that price once upon a time at one point was a full blue candle, full green candle, full strong candle up here. But guess
what? It was never Strong enough and it always closed below. So that right there makes that a non-confirmation of a break above that area. If we go look at this on the actual market structure, which is based off of the line chart, as you can tell, market structure never broke above that. But the one time that it did break above that, guess what happened? Price came back and then we retested it. We body candlestick closed above with this very very strong candle. Then we got a retest And then we bought. Could you have entered at
the breakout? Yes. Would you have much been better off entering at the retest? Yes. But these break and retest examples are literally everywhere in the market. I can just simply go to the left and I can almost guarantee you I can find another one of these in just a simple like in any possible scenario in any possible time frame you can find these examples right here. Perfect example could be this. This right here Is technically a resistance level. Resistance level has three touches. If we look at this on the actual market structure time frame you
can see how this market structure has more than one two and then three. We confirm it with the actual body candlesticks. And yes, we notice here this never body candlestick closed above. Never body candlestick closed above. Never body candlestick closed above. And guess what? Body candlestick closed above. Let's say in this scenario, we were waiting for the retest. Guess what happened? We never retested it. We missed the trade. It is what it is. It happens. Sometimes I enter the trade at the breakout. Sometimes I enter the trade on the retest. Perfect example could be this
right here. We have resistance. Resistance, right? I could just move this resistance a bit more up. And on this resistance right here, you can tell we have resistance, resistance, Resistance, resistance, body candlestick close above, retested right there with that wick on the daily time frame. I know if we go to the 4hour time frame, it's a much cleaner retest. Beautiful push to the upside. This happens in sells equally as the amount of times many times as well. It also has fake outs and fake trades that actually never actually end up having the move. But there's
other times where it also gets very much respected. But this right here Of a break and retest is the most textbook example that I can possibly give right here. This is a resistance level and it's just one structure point. Not as strong as if we were to have three, but as you can tell right here, we have broken this area. We retested this area. Then we headed to the upside. Very, very simple. A break and retest is just whenever we break an area and then we retest it and then we head to the downside. Examples
like these I can show You literally never ending. Perfect example is right here. This is a very strong resistance level. We broke this area and then we came back and then we retested. We sold off. Another example that we could have is for example right here. This is an area where I actually took this loss on this trade right here. this area right here. We actually had this support, this support. We got this break and then I waited for the retest and I just jumped off on the retest and Guess what? I took the loss.
It is what it is. It's okay. It happens. It's part of the process. As you can tell right here, this is a very strong level of resistance. And this right here was the resistance structure, structure, structure, structure. We can go to the line chart to go ahead and confirm that. And once we look at that here on the market structure chart, we can see that this was creating structure points. I don't know why. There it is. So we have One, one, two, three, four, and five. Very clean and obvious area of interest. I would not
count that one because the candlestick isn't that clean. One, two, and three, and four, and five. We break this area. We retest it. We head to the upside. Break and retest happens every single day on every single possible market that you could imagine. This is probably one of the most textbook things that happen in the market. And Personally, it's one of my favorite continuation patterns. So, a break and retest is a continuation pattern that happens once you are looking to either go with the trend or get out of it. But a break and retest is
a trade continuation pattern because this is breaking out of this area and it's continuing in that direction. This right here, as you can tell, this was bullish in this example. It broke above, created the new higher high. It retested it. Trade continuation pattern. Again, I can show many more examples of it reversing and then just going in the complete opposite direction. But break and retest is a trade continuation pattern with the market that it's going to be break and retesting for. Now breakout works the same exact way. So I call breakout the little brother of
break and retest. So we have breakouts and that's the example that I was giving. Once we actually have the breakout of the area, you can enter The trade once it breaks out without the retest. I first like building the foundation on break and retest because personally myself, I want to trade with as many possible confluences that I can and having that extra retest is going to be that extra confirmation. At no point do I want to have overexposure in the markets just because I want to enter a trade. I always want to be as less
exposed as I possibly can. So that's why I always create the base off of the Retest. And if sometimes I get the breakout, sure, I could decide if I want to enter the trade at that time, but I'm going to make sure that I have in my mind that I need the retest in order for me to actually enter the trade. But break and retest is the exact same thing. You either enter at the breakout once it breaks out with the body candlestick closing above or you can then wait for the retest. Sometimes you might
miss out on some trades. Sometimes You might avoid some losses. But break and retest. Breakout is the most textbook trade continuation pattern known to exist. So now at this point you understand the law, right? You understand the different types of markets that you could be trading. You probably know how to understand top analysis and see if something is bullish or bearish. you know on what sections of the market to actually focus on because the market is huge. There could be a lot Of noise either at the top or the bottom or at the middle or
and you simply don't know where to actually go and find the proper area for you to go ahead and execute the trade. So now you know the difference between actually finding the top or the bottom of the market, knowing where the market is, and most importantly being able to place that area of interest, and how an area of interest could be combined with the weekly and the daily, and that you only Need an area of interest on the weekly, and you only need an area of interest on the daily. You don't need an area of
interest on the 4 hour, the 2 hour, and the 1 hour, the 30 minute, or the 15-minut. Those time frames, the area of interest is simply not going to be as respected. Can you apply the same principle to it? Sure. But it's just going to be a lot more high risk, and it's not going to make sense. I personally myself I I think trading Already is as a risk as it is because the outcome is not guaranteed and I want to minimize that risk as much as I possibly can by simply having the most amount
of confluences or reasons in my favor and making sure that you're on the higher time frames is that so now that you understand all of that you kind of have to like read the more important candlesticks in front of the markets right because the candlestick the markets are full of candlesticks all Different types of candlesticks but there's certain candlesticks that stand out and are key candlesticks in the chart. And these candlesticks that I'm about to educate you on right now are basically the top performing candlesticks in the market. And they happen everywhere in the chart.
They happen at the areas of interest. They happen in the middle of the chart where there's no area of interest. They happen literally. They happen everywhere. Anywhere that you can think of, it's going to happen. But where they have the most impact is at those areas of interest and at key points in the markets. Now, I'm going to teach you these patterns right now just so you can have them in the back of your mind and then you can go look for them when you actually see the market. You're going to see them randomly throughout
the market. And I just say they have a 70% of the time where they are actually respected. But once they're at a key point in the middle of the chart where there's no area of interest, where there's no respected point, they're not supposed to be rejected because there's just simply no reason for them to actually respect that. So, you got to make sure that you read these candlesticks for what they are and where they're supposed to be because yes, you're going to get them in the middle of the chart, but doesn't mean that you just
trade them because They happen in the middle of the chart. Once again, they need to happen at a key area of interest. So, let's break down these points. Right now, I'm going to be sharing with you these candlesticks that these are the only candlesticks that you need to prioritize when it comes to analyzing the market. Is there other formations? Yes. I don't know any other formation that works anywhere near remotely as much as these. And I'm actually going to be eliminating some of These just because they're a bit complex and they're not as strong. It's
only one of them. And I'll be explaining why in just a second. Right. So, I'm going to be showing you bullish candlestick patterns, which are going to be these patterns right here. And then I'm going to be showing you bearish candlestick patterns. Whatever I show you on one side, it's pretty much the same thing, but just opposite on the other side. Right? So, I want to I want you guys to Have a clear understanding of exactly how it works. Once again, so you have the open of the candlestick. So let's say this is a bullish
candle. So this is a bullish candlestick how it opened and then this is how it closed. This is the highest points in the candlestick which is where the wick is. And then this is the lowest point where the candlestick was which is where the bottom of the wick is. Same exact thing right here. You have the open of the markets. Then The market closed down here. But once upon a time it was a green candle creating a wick up here. And once upon a time was a very strong red candle all the way down here.
But the market has closed at this point. So this right here is how the wicks get formed. And I just want to give you guys a very detailed breakdown explanation. I know we've talked about it already and I've shown it to you, but I think a visual image like this is going to help. One of the Main reversal candlestick patterns is going to be a dogee and a spinning top. So a dogee is very obvious that there's a lot of indecision in the market. Both of these right here are indecision in the markets. But a
full dogee is a much more clear indecision in the market. A dogee is when the market basically closes as a cross or closes as a plus sign, however you want to see it. But what matters is that there is no body in this candlestick. So, as you can tell, In this example right here, there's a green body and then there's a red body, which leads you to understand that it closed a little bit more in one direction versus the other. Even if it's something as small as that, there's a little bit more red, there's a
bit more strong sellers, or they close green, there's a bit more green, there's a bit more buyers. If it closes as a complete dogee like this, it's a that the market is completely standill, right? The Buyers and the sellers cannot make up who's stronger or who is weaker. and then it stayed with the body like this. This is a great point as an indecision, right? This is good for you to anticipate a continuation move to in your direction or this is just so you have an idea how the market is moving. If I personally see
the daily time frame that is having an indecision like this after it comes back to a strong area of interest, logically in my mind, I'm Going to determine that as a slowdown in price. If I see a dogee like this example right here, after I see a market that I've had a very strong push up and then on this push up, we are retesting this area of interest. Price is back at this area of interest. This is a very wellrespected weekly and daily area of interest, for example, that they both overlap. And then at this
area of interest, I then get a dogee candlestick that is leading me to understand that This pullback is potentially stopping. And now the buyers that are at this support level are going to hold price to the upside. That right there to me is a great indication that this market is now slowing down and that the next candlestick could potentially be an engulfing rejecting this area. Now, if I were to pick in between both of these, if I were to pick in between a dogee or a spinning top, I would obviously much rather have a bullish
spinning top Because then that just means that the buyers are a bit stronger than the sellers. But having a dogee isn't a red flag either. It is equally as strong. But just understanding that this just means undecision in the market. And this means that there's a bit more on either side depending on which one the body closes in. Nonetheless, this could be used as a perfect reversal and showing you that the market is ready to move in the other direction. That means that the Market has been battling to go to either side and it couldn't
make up its mind and it closed like this. Now remember key note for this. The higher the time frame, the stronger the formation. If you go down to the one minute time frame, you're going to get these formations that form every single minutes. If you're going to go to the to the 30 minute time frame, these formations happen every 30 minutes. Why? Because it just it it moves a lot more. It's a lot more volatile. The probability of it happening is a lot easier. I like using these candlesticks to have my entry or to determine
if I'm going to enter a trade based off of like, yes, the 30 minute, the one hour, the two hour. But where I like to use these indecision candles, and I'm going to teach you how to use them later on, is on the higher time frame. Seeing a daily dogee like this at an area of Interest, having a full 24hour candlestick battle up and down and close at an undecision candlestick like this, that is amazing. Seeing a 4 hour candlestick like this, it's also good because it's four hours. But then seeing a one hour candlestick,
it's okay. And then a 30 minute just loses less value. The longer it takes for this to be created, the more respect I'm going to give to it. But this as a whole could be used as a reversal and showing slowdown In the direction that I'm interested in taking the trade. This is just a very educational candlestick and it's something that I use on every single time frame just on the higher time frame obviously the more respected it's going to be. Moving after that we then have the hammer and the inverted hammer. So this is
basically very similar to the spinning top but this is something that would happen once we have reached this support level and then we basically Close with little to no wick on the upside. So this means that the momentum is extremely strong and the market opened up. Sellers brought this price all the way down, but buyers were so strong that it brought it all the way up and actually had it close to the upside with that momentum. So this was going to be a dogee where it was going to be a a full cross, but then
the buyers were so strong that actually made it end up closing to the upside. This right here Is an additional very strong and very powerful reversal pattern. I like to have this one as well as once you have approached a support level because then this is showing that we are obviously rejecting it and then we have taken out the lows. Next we have the inverted hammer. So the inverted hammer is actually what is like what I like to call a wick fill. So that wick right there because it's happening in the favor of the direction
that we are going In is where the next candlestick could anticipate to then fill that. We notice this next candlestick has filled that perfectly. So if the do if the wick is to the downside, it's a rejection. If the wick is to the upside, it's a fill. Only if we're at an area of interest. Now, this could again work on the 1 hour, the 4 hour, the daily, the higher the time frame, the better. So if this right here, you get it, that's great. That's a rejection. Could the next Candlestick from that be a bullish
engulfing? Yes. If this is a wick like this, could the next candlestick be a bullish engulfing? Yes. They're both equally as strong. I just personally like the wick fill a bit more. Just really depends on the trade. But don't get me wrong, a strong wick or a strong hammer is a very strong rejection. Next is a dogee is a dragonfly dogee. So this is the [ __ ] that I'm talking about. This is pretty much the same [ __ ] as This. They just decided to make the body a little bit smaller. And at the
end of the day, I'm going to call it a hammer or a dogee. No matter what. You might see me call it dogee more than dragonfly or a hammer. But this is the exact same thing. I don't want to waste your time or get you distracted on having to remember the dragonfly dogee when it's pretty much the same [ __ ] as the hammer. It just has a smaller body, but it means the exact same thing. One is not Stronger than the other. The one that is stronger than all of these is going to be
the actual bullish engulfing candlestick. So, this bullish engulfing candlestick is one of my favorite reversal patterns because this candlestick is showing power. is showing strength and is showing that we are literally going in the complete opposite direction. It is showing that we are literally engulfing the bears and we are going with the buyers. This candlestick Needs to engulf the last candlestick and then the previous one minimum to be considered as a bullish engulfing candlestick. That's how I personally consider the bullish engulfing candlestick. Others like for it to just be the previous small candle. I like
for it to engulf a minimum of two candles just to show the strength of it because that is what's going to lead me to enter the trade and have more confidence that it's going to go in that direction. So If you have a bullish engulfing that means you want to buy in that direction. And once again that would happen at a support level. If you have a dogee or if you have a hammer or if you have a inverted hammer, whatever you want to call it. And then the candlestick after that is going to be
a bullish engulfing candlestick engulfing the hammer and then the bearish candlestick that it was right here. That right there is the perfect formation in my opinion. And That is also known as the morning star formation. This pierce line and I just jumped right through it. This is [ __ ] [ __ ] I don't even know what this is. This is just they made up this formation. In my opinion, it's not even real. They just try to like take value away from the bullish engulfing and validate something when it's not there. If it's not a
bullish engulfing, it's not a pierce line. They try to make something out of nothing. No, if it's Not an engulfing, it's not strong enough. I'm not taking the trade. I am good. And trust me, I tried to figure this [ __ ] out for way too long. And then later throughout my journey, I realized that I was just wasting my time. and it makes more sense to just focus on one good candlestick formation and that's it. My favorite and above all is going to be the morning star formation. The morning star formation or the morning
dogee star formation, but once again It's the same [ __ ] They've pretty much just added an additional verb to it is going to be that this candlestick has engulfed both of these candlesticks and it has that dogee that I was just explaining. Either you have this bearish candlestick right here and this one engulfs or if you have the shooting star to the downside, you have a bullish engulfing candlestick with the dogee. That right there is a morning star formation. This is my favorite end all Be all candlestick formation because what it essentially does is
it combines the bullish engulfing and it adds it in with the inverted hammer or the dogee. And you you're putting the engulfing and the dogee together. Now, obviously, if this example right here were to have a wick like that, even better. But if it doesn't, it's fine. All that matters is that this candlestick has engulfed the last two candles. And that is what makes it a Morning star formation. Last but not least, and definitely least is going to be this right here, the three white soldiers, and then the three black crows. I I I don't
know how it goes from white soldiers to then black crows. I don't even know how how this makes any sense. This candlestick formation is not even a real thing. If you ask me, it looks exactly the same as the three cloud clover. This threecloud clover looks exactly the same as the three Black crows. Three black three red candlesticks, three red candlesticks. Looks exactly the same to me. These formations are total [ __ ] and they're simply a waste of time and there's no need to even focus on them. it makes more sense to just focus
on a formation that actually makes sense like the morning star formation, the bullish engulfing, and then the hammer. That is all you need when it comes to these candlesticks. Now, for the bearish Examples, it's pretty much the exact same thing, just the complete opposite. The shooting star is going to be happening at a rejection as it's going to be happening at a resistance. So, if I just delete all this right here real quick, the shooting star, you want it to be at a resistance. So, let's say this market is trending to the downside and now
we are retesting this resistance level right here. This resistance you're at this resistance level and then once Again the camera battery has died. I guess I'm definitely I've been doing this for a while now. I don't even know how much time I'm into this video. But I will tell you this, I'm loving it. I am very committed to continue doing this right now. One second. And we're back over here now with the other camera angle. So over here on this bearish example, we have this market being a bearish trending market and we are at this
resistance level where we're going To potentially be using it as resistance. Now these market indications, these market patterns are going to actually give us the indication that we're actually rejecting it. So once again, price could come into this resistance level and then give us a shooting star. Whether it be with a very small body, whether it have a small body, so it looks like a dogee. So it looks like a hanging man or a shooting star. As long as we have some type of Rejection at this area of interest, it is considered in my opinion
a dogee. So this gravestone dogee, this formation right here is the exact same thing as the hanging man and the shooting star in my opinion. Now, if you combine that with the bearish engulfing candlestick, that is where you have the beautiful formation, whether it's a dogee or a shooting star or a hammer, a however you want to call it. I just call them dogeis, honestly. It's just so much [ __ ] easier. So then this bearish engulfing candlestick is what's going to give you that beautiful end all be all evening star formation. This is the
most beautiful formation, morning star and then evening star formation. And once again, this right here, they just figured out a way to remix it and add the actual dogee into it, but it's all the exact same thing. As long as the candlestick engulfs the last two, you have a beautiful formation where you Have a combination of a shooting star and an engulfing candlestick, which makes the morning and evening star formation. Now, these candlesticks, you're literally going to see them everywhere, right? We can come here into the chart and then look at this for example right
here. This right here is a bullish engulfing candlestick. This candlestick has engulfed this candlestick. Guess what happened after? Continuation push. Here we have a pull Back to the to the to this retracement break and retest. What do we have here? A beautiful hammer, shooting star, dogee, whatever the actual name was. It's that it's that type of candlestick. What's the candlestick you get after? A beautiful bullish engulfing candlestick that eats the last two candlesticks. This right here is my formation of a perfect morning star formation. This right here is a beautiful formation continuing to this area
over here. Bullish pin bar rejection. Beautiful continuation push to the upside. What do we have here? A beautiful morning star formation with these very very long dogee wicks showing this indication that we are indeed rejection. Meaning once upon a time we're fully red, we rejected. We were fully red, we rejected and we closed bullish. Obviously look what happened after. So, as you can tell, things were never going things are never going to come out exactly textbook How they are here in the picture, right? I wish. But I'm not here to sell you a fantasy. I'm
not here to sell you a dream. I'm here to tell you [ __ ] straight up how it is. It's never going to be perfect, picture perfect, exactly like this. It's going to have the formation and then it's going to be a little bit ugly. Kind of like when you go on a date with a girl you meet on Tinder. Like on the pictures, they all look great, but when you meet them in Person, it's all like, "Whatever, I'll do it. [ __ ] it. I'm already here kind of vibe, right? And it ends up
being a great time. It's the exact same thing. This, for example, right here is a perfect dogee bullish engulfing candlestick break and retest of this area of interest. You buy. You see how now we're combining all of the things at the exact same time. We have this very strong trend, right? This is obviously being a bullish market. We Have a break of this strong resistance. We have a retest. We have a morning star formation with a dogee. That right there, just right off the top of the bat, I just gave you five confluences on why
you should take this trade. You have two time frames in sync. You have area of interest. You have breaking retest and then you have a morning star formation. Five confluences in 30 seconds on everything that I have just taught you in this video could have Easily gotten you to enter this trade at this retest. Have a very simple stop-loss and with a 1 to2 risk-to-reward, you could have made 118 pips. You multiply whatever you were going to risk times 118. This is easily a5 to $10,000 trade. Just showing you guys how simple it is. And
I'm just educating you guys on things that you are already seeing and I have been showing you, but you just didn't even know that they were there. It's almost Like playing where's Waldo, right? When you play Where's Waldo, which is this game right here, you pretty much don't know where he is. But as soon if as soon as I'm able to point out where is Waldo, you're almost going to be like, "Wow, was he really there the whole entire time?" Like, I already found him. So, for example, let's say I spotted Waldo right here, for
example. And then once you spot him, I'm totally kidding. I did not spot him. But if you do spot him right off the bat, once you see him, you can't unsee it. It's the exact same thing when it comes to this training view and this examples right here. Once you see these examples, you can't unsee it. Perfect example of a morning star formation being at an area that is not valid and it not working. Obviously, if you notice right here, this is a beautiful dogee, shooting star, whatever. And then we have a beautiful morning star
formation. It's not an engulfing because it didn't engulf this last candlestick right here. But where is this formation happening into? It's happening into a resistance. What happens after it happens into a resistance? Obviously, it's not going to respect it and then it goes to the downside. This is showing you the example that you can get these formations anywhere in the charts, but you need to get them at key areas that they are going to be respected. If not, It's just simply going to be a complete waste. You get all of these types of formations I'm
talking about everywhere in front of the markets at every given point. Perfect example is right here. Very small morning star formation. This candlestick could have been bigger and maybe if it maybe it would have made a difference, but that right there to me is not a strong morning star formation. I like for that morning bullish candlestick to be strong. I want it to Engulf. That right there is an indication that it's going to continue going in that direction. I want it to be in control. Perfect example is like this one right here. This right here
is a beautiful morning star formation. Bullish engulfing candlestick. It ate the last two candles. Beautiful push to the upside. This right here is an evening star formation and then it did not really engulf this candlestick right here. So, we had a little bit of a push But then we continued going to the upside. This right here is a very clean bearish engulfing candlestick and then we had a very strong push to the downside. Very clean evening star formation right here as well. We're using this as a resistance point right here. And then guess what? Price
has a beautiful evening star formation. Beautiful push to the downside down here. We have a morning star formation. This candlestick never really engulfed This one. So what happens? We break to the downside. This candlestick engulfs this candlestick. Beautiful push to the upside. This right here is a beautiful morning star formation. This right here is if I were to pick a formation that I can have time over time over time again, it would literally be this one right here. Beautiful morning star formation. This candlestick engulfves this candle and this candle because this is the last candle.
You want to make sure that it Can engulf the body of that move, not the wick. You want to make sure it engulf the body. And if this body closes above the body, that is a beautiful engulfing candlestick of the last two candles and having a beautiful push to the upside. So, for example, this move right here actually had a beautiful bearish engulfing candlestick. It engulfed below this body right here. Simply did not have the move. There's times where that is going to happen as Well. But I love when the candlesticks actually engulf the last
body. That to me is the most Picasso thing the market can ever do. Look at these beautiful morning star formations backto back that just happened right here. This right here. Like I would literally screenshot this and frame it and put it on my wall. Beautiful morning star formation with a very slight I'm talking about a hairline break above the last body. That right there, believe it or not, is the Difference between an engulfing and not. And if you were to see this one as well, right here, this one as well has a beautiful morning star
formation. And that candlestick has very clearly body candlestick closed above. And look at the beautiful continuation push that it has had to the upside right after that. These formations are extremely powerful and they're going to happen time and time and time and time and time and time and time again. Like for example, this Right here, this happened at a low of a market. This is a continuation pattern. This is not supposed to happen at the bottom of a market. If we're identifying if this is bullish or bearish, clearly this would have been the higher high.
This would have been the higher low to a certain point right over here. My trading view sometimes glitches. So this would be the higher low. If we were to look at this based off of the market structure, this market indeed would be Bearish, right? So this would be the lower low. And then this would be the lower high. Let's see how clean that looks on the candlestick chart. Arguably that can't be the lower high. So then let's say that would be the lower high. It's not a one clean one candlestick pullback. So this is a
bearish market. I don't expect for a morning star formation to have a reaction on a bearish market. This formation is supposed to happen on a continuation. This is a continuation. If this was bullish, this was at a support level, I would expect for this beautiful pattern to actually have a push. But obviously since it's happening in a bearish market, it simply has no use compared how it would if it were to be in a bullish market. So that is the importance of learning how to use these formations at the right times because they're going to
happen at all places in the markets. They're going to happen While the markets are going up or the markets are going down or the markets are going anywhere. But you need to make sure that you're actually applying it in the proper timing of the market. You need to apply the morning star when you're buying. You need to buy the evening star when you're when you're selling. It's very clean. Morning star when buying, evening star when selling. Very simple, very self-explanatory. Everything's straight To the point. So, there is hundreds of other formations, right? There's other different
types of candlestick confirmations. There's other different types of confluences for you to actually use in your favor. But the most powerful ones are simply going to be the shooting stars and then the engulfing candlesticks. You use it in combination with a strong support level or a strong resistance and you already have a recipe to have more than a 50 to 55% odds in Your favor of a trade going in a certain direction compared to the other. All right, ladies and gentlemen, now we're going to move on to the next subjects. Right? So, up to this
point, we've talked about a lot. Now if at any point at like from this point going on forward you don't understand something you don't have clear the market structure you don't have clear certain candlesticks you don't have clear when it comes to the break and retest to the line charts To the support and resistance areas of interest if any of that stuff is not clear take a pause at this moment you are pretty deep into the video as it is already and we have talked about a lot of things that have taken me a very
very very long time to actually understand and perfect. Now, I don't expect for you to perfect it right now. That will pretty much be impossible because the only thing that's going to perfect it is repetition and time looking at in the Markets for yourself, setting up certain examples, and just going over it over and over and over and again. I didn't perfect this until about four and a half years in my journey simply because I wasted two years on just having a bunch of misinformation and then it took me about a year to actually really
learn it and perfect it simply because I was by myself. Obviously, if I was with a mentor, I was with somebody that would teach me live every single day, kind of How I do every single day with my students, that would have actually escalated and shortened my journey, it would have excellated the amount of knowledge that I actually learn with stuff that matters and it would have removed all the other [ __ ] So, I wish I knew that earlier, but obviously, you know, that's why I'm doing this video now for you guys. So once
again, if at this point into the video there is something that is unclear, pause, go Back, refresh your notes, watch it over because what we are going to be talking about now are going to be pretty advanced stuff and it's going to have everything intertwin and everything connect together. Market structure is going to come together with patterns, patterns going to come together with indicators. All of this is going to start coming together. What is a intercooler? And now we're going to put all that together which is going to make The engine work. So that's exactly
what we're going to get into. Now things are going to get very very very uh how do I say it? Um interesting from this point forward. Right? So all I can say is pay attention. Don't watch this video on two speed. Watch it on one speed. Just make sure you're actually doing this effectively. Right? So the last topic that we have talked about was break and retest. Right? Break and retest. We Understood that's when something literally has the break of an area. We then retest it to continue going to the upside. So that right there
is going to be a trend continuation pattern. That is my favorite trend continuation pattern when it comes to the break and breakout retest. Breakout, break and retest are trend continuation patterns. Now there is reversal patterns. So these patterns also let you know that the market is going to go in the opposite direction. So a reversal means that something is going to go the other way. What is a pattern? A pattern is something that has happened in the past. So a reversal pattern is a pattern that's going to tell you the market is going to shift.
So the main and once again there is hundreds of reversal patterns out there, right? So I can go here into this pattern section and you know you're going to get the X A B C D Y pattern. I don't even know how to place this [ __ ] But yes, there you can get any endless amount of examples. You can get whatever this is right here. And I would never know how to teach you this because I've never used it. I can only teach you the one and only pattern you are going to need and
that is going to be the head and shoulders pattern. Now once again if you have seen me anytime in the past trade, if you have seen any of my clips, if you have seen me anywhere on social media, you would know that I have made So much money off of this pattern right here. This is my go-to pattern. Like this is my [ __ ] right here. I use this every single day in the market. I wait for this pattern to create. And it's not so much about the actual pattern, it's what this pattern actually
means and how it does it. And I'm going to make it make sense in just a second. Right. So my favorites and the only reversal pattern that you're going to need is going to be this head and shoulders Pattern. This is where you have a left. This is where you have a head. And then this is where you have a right shoulder. So a regular head and shoulders pattern is a reversal for this market to continue now going to the downside. This head and shoulders pattern gets formed and you guys should be writing this down.
This gets formed at the high of a market or at a resistance level, excuse me. And then you have this reversal pattern that then lets you know that the Market is now going to start shifting to the downside. At the bottom of a trend, you will then get what is called a inverted head and shoulders, which is literally the complete opposite. But this is now a reversal pattern to let you know that this market is now going to go to the upside. So there's a big difference in between a reversal pattern and a trend continuation
pattern. Reversal patterns literally mean the market is going to shift the other way. Trade continuation patterns like the break and retest are when market is continuously going in that direction. These right here are constant break and retest to the upside. These right here are constant break and retest to the downside. These right here are constant breakouts. Break and retest to the upside. This right here is a reversal pattern and it changes the trend of a market. This right here is a reversal pattern and it changes the trend of the Market. Now once again this reversal
pattern and like every other pattern, every other important point in the market, this head and shoulders pattern is done to call it head and shoulders is done to the market structure. So what do I mean by that? Well, that is done to the bodies of the candlestick. We are not including the wicks at no point when identifying a head and shoulders. I'm going to teach you guys how to put this up on the chart right now, but I want to Educate you guys on the head and shoulders first. And everything that we're going to be
doing is based off of market structure. So, this is what a pretty head and shoulders looks like, but a real head and shoulders might look something like this, for example. Might be at a slant. You might get a head that is a little bit smaller than the right shoulder. And then you will get something like this. You can also get a head and shoulders pattern that can be Something like this. A big left shoulder, a big right shoulder, and a small right shoulder. Vice versa, you can get a very small right shoulder and a very
big right shoulder. You can get the structure point to be up here. You can get the slanted head and shoulders this way. You can get the slanted head and shoulders like this. The head and shoulders is never going to be a beautiful textbook head and shoulders pattern like this. Does it happen? Yes. But I will never aim to always have a perfect one. The head and shoulders pattern is valid as long as it breaks the neckline. Now, what does that mean, Alex? What do you mean breaking the neckline? Well, the head and shoulders pattern. Yes,
it is a head and shoulders pattern. But what is this right here? Right? Give me one second. What is this right here? This right here was a higher high. This right here was a higher low. What is this right here? That is a shift Of structure. That is a change of character. That is a break of structure. This is now bearish. Right? You got that right? Confirmed. Now, this right here, what is that right there? That is our potential right shoulder. So, without you guys even realizing, I have been showing you guys the head and
shoulders this whole entire time. Like, if you guys go back into this recording, just go back five minutes, for example. Just click the arrow back. you guys are going To see that I've been showing you the head and shoulders this whole entire [ __ ] time is that I just never really exposed it to you. And now that I explain to you what it is, it's almost like, oh my god, it's been right in front of me the whole entire time. Just haven't realized it. But there is a big difference in between a valid head
and shoulders and a invalid head and shoulders. Now, this right here is a valid head and shoulders because we have Broken this neckline. Since we have broken this neckline, this is a valid head and shoulders. Now, this right here is not a valid head and shoulders. We all know this, right? We know that this right now is a higher low and that this is a higher high. We have gone through this 100 times already. This is a higher high. This is a higher low. And we know since we have not broken below this, we are
still bullish. This market is still very much bullish. That is the higher Low. That is the higher high a reversal pattern which is exactly what the head and shoulders is. It needs to be a reversal pattern. Now what is the best indication to let us know that this is a reversal pattern? That we have shifted the structure. That means that this market is now changing from bullish to bearish. It is shifting. It is breaking the structure. So there's two ways that the head and shoulders could be valid. The head and shoulders could be valid Either
if the head breaks the neckline making this the lower low and then we have a potential lower high for a new lower low. So this would be a proper head and shoulders shift because of this point right here. So you can take the trade either at the right shoulder or at the break and retest of the neckline of the head and shoulders. So the the way that the head and shoulders works is you can either sell at the right shoulder or sell at the break and retest. Selling at The right shoulder is extremely high risk.
I don't recommend it unless you are an experienced trader. Selling at the break and retest of the head and shoulders is where it is the proper reversal trade confirmation because you have the confirmed shift of structure. The market has officially shifted bearish. Right? So if you have this shift right here, making this the lower low, technically this could come back here, create the lower high, then this Is an area of interest up here, right? Let's just pretend like this has three touches over here. Yes, you can sell at this area of interest. This could be
a sell. This could be your right shoulder. And yes, you can sell at this point right here. But the proper trade is to sell at the retest of the neckline. Now, the neckline is not going to be diagonal because of this tool. So if you place this tool to these structure points, technically it's going to come out Diagonal. Now the neckline is going to be based off of the previous structure points which is basically where the higher low and the shift has been created which would be right here. This is the neckline. The neckline is
not going to be this imaginary line that is gets drawn depending where the structure is. That's not how the neckline works. The neckline is right here. It's always going to be at an area of interest as well. So the neckline of the head and Shoulders is going to be the retest of an area of interest. So now that you have multiple confluences at the same time, you have a shift of structure, you have a reversal pattern, you are breaking and retesting the neckline of the head and shoulders. And that also happens to be an area
of interest. You're seeing how everything is just kind of coming along together, right? So one of the ways that you can execute the head and shoulders is if it indeed Breaks this higher low and then we can sell at the right shoulder. if we're at an area of interest or we can sell at the retest of the neckline. That is the one way the head and shoulders will be valid. The head and shoulders will only be valid. And you guys should be writing this down. The head and shoulders will only be valid once we break
the neckline. If we have not broken the neckline, we cannot count it as a head and shoulders cuz it's not a confirmed Head and shoulders. This can basically come up into right here even though that it's bearish, right? Because this right here would be the lower low. And then this over here would now be the lower high. And guess what? This can literally create an equal move and then have a move to the upside. And then now we are bullish and we shifted above this. We cannot confirm that this is a head and shoulders until
we have not broken the neckline. The neckline is the most Important move for us to consider the valid head and shoulders. Can you take it at the right shoulder? Yes. It's an extremely high risk and that is up to you depending on what you want to do. But the proper trade is at the break of the neckline. Right? So this is the first example and this would make this head and shoulders very strong because it shifted structure once and then it's going to shift it structure pretty much for a second time over here because then
This will turn into the lower low and then this would turn into the lower high, right? Or that's scenario one, meaning that the head breaks this higher low so it sets up the perfect right shoulder. Or the second way that you could do it is if the market is like this. We are still very much bullish. This is the left. This is the head. This right now instead of it cuz if you were to look at this market like this, at no point in your life are you going to be Like, "Yeah, yeah, yeah, yeah.
That's going to be a right shoulder." No, you you anticipate for this to have a move like this. This market structure is bullish. You don't expect for this to do this. This is bullish. You expect for this to continue going to the upside. But for this example, let's say it's doing something like this. Now, you can look at this market and be like, damn, that is setting up a perfect head and shoulders. Let me take the trade now. Well, you taking the trade now. One, you're not selling at an area of interest. Two, you're selling
on a bullish market because this is the higher high, and then this would be the higher low. So, you're already doing two things that simply just don't make any sense. Go find me enough reasons for you to sell this trade. None. You're trading against the trends. You're already making a mistake. people try and jump the gun and trade based off of a Potential head and shoulders. That's not a confirmation. A confirmation is when it actually has the break. So, this right here would just be the potential right shoulder. And this would be a confirmed head
and shoulders once again once we have broken the higher low. Now, once we have broken the higher low, all we simply have to do is let price come back into this area, retest this neckline, and then we will sell. So, if this has broken this area, guess what? That means that this is now the lower low and this over here is the lower high. If this is the lower high and this is the lower low, what did I just teach you guys? I taught you guys that you're going to find an area of interest in
between this lower high and lower low. Start working your way up and boom, what do you happen to find right here? This right here is an area of interest with three touches. And what a coincidence, it is also the neckline of the left, the Head, and the right shoulder. That right there is how you're piecing together market structure, how you're piecing together area of interest, how you're piecing together trend and a reversal pattern. Everything is just coming together, right? And this is just one of the things that I'm going to be teaching you right now.
So once again, if there's something that you don't have clear, just take a pause, go back, double check it, and then come back to this point Right here. And if you're not subscribed, hit the [ __ ] subscribe button. Right. So, let's continue to go on with the head and shoulders pattern. Right now, for a bearish example, it's basically the exact same thing. This market right here was creating this lower low. And then this over here was creating this lower high, right? This market structure, let's just pretend like this market is like this. This right
here is the lower high. this right Here on this lower high and this lower low. What do we expect to happen here? We expect from this move right here to it continue to go to the downside. At no point do we expect for this to come over here and then retest this and then actually have a reversal to the upside. This right here, if you would see this, you would still very much count it bearish. Now, some people are better buyers than sellers. Some people are better sellers than buyers. It just it's Entirely up to
you. Once again, if you don't have a clear indication on how to do that, you can just flip the chart. But the principle applies exactly the same. Nothing will change if it's bullish or if it's bearish. It's literally the exact same thing, right? So this right here, we understand that this market is indeed bearish. Lower high, lower low. We haven't broken above. Nothing changes. Now, if this does this now, guess what? We have the Confirmed break of this lower high, making this the higher high. And if this is the higher high, we get the head
of the snake. The first turn, that is going to be the higher low. So then this turns into the higher low. That turns into the higher low. We could only find an area of interest inside of this higher high and higher low. And what a coincidence that it is literally at the neckline of this left head and right shoulder. So you simply draw your head and shoulders. Obviously, it's the exact same example. before I just flip the chart. But that's really how easy you can tell the difference in between one or the other. So in
the chart is going to be exactly the same exactly just like this, right? So this right here is the lower low and then this over here is going to be the lower high. So us as traders, we do not enter the trade on the breakout of the neckline. We have to wait for price to come back into this area and then Retest. And then once it retests, then you look for those candlestick formations here. Since you're looking to sell, you look for a bearish shooting star and then a bearish engulfing candlestick to then continue pushing
this trade to the downside. That's pretty much it. That is exactly how the head and shoulders works. I can literally show you I'm talking about like hundreds of these examples every single day. I'm going to show you with a Real life example right here. So, this right here is a ugly head and shoulders pattern. So, as you can see it right here, this right here will be a left head and then a big right shoulder. Guess what? We came back over here. We broke above the right shoulder. We broke the right shoulder. We retested the
right shoulder. And then we started to have the push to the downside. You guys remember when I showed you guys this trade before I I was interested in Taking it? How I was actually interested in taking it? Well, look how it's moving now. Look where it is now. All because of this 1 hour left head right shoulder. The head and shoulder is equally as valuable. And I mean it is used equally the same on every single time frame. Now obviously the higher the time frame the stronger the pattern is going to be but it's used
the exact same way. You have to wait for the break of the structure. So for example right here if we are Looking for this example right here this if we were to look at it on the market structure you can see how we have left head and right here you never really anticipate a right shoulder until you actually start to see it being created. So that right shoulder there is looking a little bit ugly but it is creating a right shoulder. And as you can tell this is the higher low. That's the higher high. We
shifted the structure. So, that's a good head and shoulders that we Like to see, but we never got the break of the neckline. So, or we're waiting for this break of the neckline in order for us to then actually sell this trade. So, as you can tell, no break of the neckline there. We almost broke the neckline. We did nothing. Went up to the upside. And then over here, we actually broke the neckline, came back and retested it, and then we had a beautiful sell to the downside. This is just based off of pure market
structure. You can See here how this was a head and shoulders that it never broke the neckline. Left head and then guess what? This right shoulder. This was the higher high and then this was the higher low. The market never broke this higher low. It never completed this right shoulder. It never created a proper reversal pattern. Now, don't get me wrong. You're going to get these head and shoulders literally everywhere in the market. I'm talking about in the middle of the Chart, at the top, at the bottom. You want to make sure that you can
get this reversal pattern on areas that it actually will have a significant impact. You want to make sure that you're getting this head and shoulders pattern at a resistance. If you're looking to sell, you want to make sure you can have it at a support. If you're looking to buy, perfect example of a beautiful head and shoulders could be this example right here. Left head, right shoulder. Doesn't look clean on the candlestick chart. Don't worry. Go to the line chart. Be I'm talking about beautiful. left head and then right shoulder. Price broke the neckline. We
came back to retest it and then I ended up taking a loss. And I'm a real one for doing this, you know, like I am in control of this video right now. I can just pause the video and then just go find the perfect example how it actually happened on that perfect example and then just show you How it wins every single time. But I'm not going to do that because that's [ __ ] up. like I'm showing you guys real life examples on trades that I personally have taken and trades that I have actually
either made money or lost money on. Even if they're not as perfect, it it's going to, you know, it benefits me far more because you guys will like me a lot more if I just set a perfect example and show you how exactly how it looks on a perfect scale and show You how it works every single time. But that's not the reality of this. And that's the mistake that a lot of these mentors make while they're making these videos. They always try and find a perfect example just to show you so it makes sense.
I'm not doing that. I'm making it make sense with real life examples. So you guys, when you guys go out there to the real world and go trade the real markets, you're not [ __ ] lost and you actually understand [ __ ] And even though you have a perfect head and shoulders pattern like this one, you can actually understand that there's still a risk of losing no matter what. So I'm protecting your capital. I'm just looking out as much as I possibly can. So just wanted to set that tonality because I've realized it throughout
the videos that I could have done so many different types of examples that would have made me look better, but it would have not been the reality for you guys. And I just wanted to show you guys that, right? So for example here, this is another head and shoulders. How this was the higher high. This was the higher low. Price never broke the neckline. We remained bullish. And even though right here it probably might have looked like it was going to create a beautiful right shoulder from this area. It could have easily looked like it
was going to go down and create a left head. Right shoulder, excuse me. We did that. So Examples like these, I'm telling you, they are literally never ending throughout the whole entire video. These are literally everywhere in the chart. You're going to get them on every single time frame throughout any chart. I'm just looking to the left finding these head and shoulders when and if they happen, but they happen all of the time at every single place. For example, right here you have a beautiful inverted head and shoulders pattern right here. So, this right here
is going to be the left. This right here is going to be the right I mean the head, excuse me. And then this is going to be the right shoulder. You notice price broke this neckline, came back, retested, beautiful push to the upside. Once again, if it doesn't look super clean, you can go out to the line chart and then on the line chart, you can see it. Left head, broke the lower high structure point, came back to create the right shoulder, break Retest, and then it went to the upside. Examples like these and I
want to find the I remember that I caught one the other day. I wonder where it is. And you know, they come very big. They could also come very small. So for example, you can see this right here as like one ginormous head and shoulders. For example, like right here, you have a ginormous left head and then a ginormous right shoulder. Or you can see a smaller head and shoulders right here. Left head And then right shoulder, for example. I'm telling you, these these are it's literally my favorite reversal pattern. If I go down to
the 15-minut time frame, you're going to see it more than ever. I think it was NZD CAD. Was it NZD CAD? NZD CAD? No, I think it was Oh, it was NZDUSD. Like this right here is a beautiful trade setup that I had. I'm talking about phenomenal. Look at this right Here. Right. So, this right here has a beautiful left head and then this broke the structure and created this beautiful right shoulder for me. Right? It's a very big head and shoulders. Now on this retest of this neckline, I go down to the 4 hour.
And when I go down to this 4 hour, I can see right here. What do I see? I see a beautiful left head and then right shoulder retesting the bigger neckline of the head and shoulders. So this is The big head and shoulders over here. And now this is retesting the neckline. Beautiful head and shoulders at the retest of it. Here's another beautiful example of a beautiful head, left head and then right shoulder. We broke, retested the neckline and then we sold. Right here we have an inverted head and shoulders. Right here we have a
left head and then the right shoulder trade continued to go to the upside. Up here we have another head and shoulders. We Have left head and then right shoulder broke, retested and then went to the downside. Right here we have another left. These things are just never ending. Head, right shoulder. This right here is clearly an area of interest. So if this was I mean you can just look at it. You can just look at this example like this, right? So let's say this is the higher or let's let's not say this right here is
the higher high, right? For example, this right here is the Higher high of this market. This right here is the higher low of this market. We know that this is bullish. So in this market, we now get a perfect retest of this area. So right here it looks like we're creating the perfect base for the left for the head. Now you don't know a right shoulder's coming. You just look this looks like the base. This looks like it's just rejecting the structure to potentially go to the upside, right? But then you get something like this.
You get a little high and then it breaks. Now when it breaks is when you realize, oh [ __ ] this [ __ ] is actually bearish. This went from being bullish to bearish. Now this higher low gets invalidated. This becomes the new lower low. You do your little snake trick. this becomes the lower high. If that becomes the lower high, then we have to look for an area of interest inside of this lower high and lower low. But first, let's just make sure that this Candlestick has actually stopped at this area. This we need
to have some type of slowdown at this area so we confirm that we're actually having that as the lower low. As of right now, this looks like this became the new lower low. See what happens to the next candle. Okay, this becomes okay, perfect. That became the lower low. So now we're going to look for areas of interest within this box, right? So we're going to go back out to the line chart. We're going to start Working our way up from this point right here. Start working our way up. Boom. Right here we have one
and then two. We can potentially have this as an area of interest. Let's see what it looks like on the candlestick chart. We have one. I'm sure if we look more left, uh, we have maybe three. One, two. Doesn't look that clean. we start. If we keep working our way up, we're going to probably run into this area right here where we have one, two, and then three. If we look at It on the line chart, you can tell we have very clean structure. We have 1 2 3 four structure points. And what a coincidence
that it's also the neckline of the head and shoulders. Now, this neckline of the head and shoulders, we're going to wait for price to come back and then retest it. So once price comes back and then retest it, we're going to wait for some type of rejection confirmation like this evening star formation for us in order to enter this Trade and have the sell to the downside. So now this is the confirmation that the neckline the head and shoulders has broken it has come back to retest it. We have our engulfing and then guess what?
Beautiful sell to the downside. That right there ladies and gentlemen is a perfect example of a head and shoulders and this is just a random chart that I found here on Trading View. Head and shoulders patterns happen literally everywhere throughout the market. I can Show you another one right here. Left head, right shoulder. We broke the neckline, came back and retested. You can see it right here. Left head, right shoulder. What matters is that it shifted from being this the higher low to this being the higher high. We shifted the structure. So we go from
being bullish to then bearish. And then we create the new lower low. Then we come back, we create the retest and then we sell. That is the beauty of the head And shoulders that it is a reversal pattern and it is literally showing you its hand first. You're letting the market create the move before it even h like you're letting the market do the move for you where you're letting the market literally have the pattern so you can just simply follow it. You don't even have to think. All you simply have to do is just
react to the pattern. And I know I have many, many, many more examples. I think I have one on GBPUSD Not so long ago that I took as well. That was a beautiful head and shoulders. I think it was somewhere. Yeah. Okay. Look for example right here. So right here GBPUSD once again we have left head right shoulder. We break that neckline come back and retest and then we sell. Examples of these are literally everywhere. And it it's just called a head and shoulders pattern because that's just what it is. But it's really just a
reversal pattern. For example, Right here you have this market that is bullish. This market right here is bullish. Right? This market was creating higher highs, higher lows, higher highs and then guess what? We shifted the structure. So if this is the higher low and then this is the higher high. This at this point did not shift the market structure. This market was still bullish up to this point right here. But guess what? We broke the neckline. We came back to retest it. And then guess what Happens after? Retest the neckline. Beautiful sells to the downside.
This right here is the beauty of the reversal pattern. Now, it's not that I'm looking for specifically a head and shoulders pattern. No, what I'm looking for is for this right here is that shift of structure, the market going from bullish to bearish. That is the reversal pattern. That is the indication that I'm looking for in order for me to be interested in this trade. It's the shift Of the structure. Whether it happens from the uh the push from the head or whether it happens from the break of the neckline of the actual head and
shoulders. And like I'm just so passionate about these head and shoulders that I can literally be on here for hours just showing you examples of head and shoulders alone. Just literally head and shoulders everywhere. Like there's another one right here. I'm trying to find like an ugly one cuz Sometimes there is some ugly ones. I mean this is kind of like an ugly one in a way in my opinion because this one's like not super clean. Left head and then right shoulder. All that matters is that we broke the structure, retested the neckline, we then
had a push to the upside. I see these patterns happen every single day, everywhere in the market, either at tops or bottoms. And for me, it's my personal favorite reversal pattern. And it lets me know That the market is indeed respecting the structure. Perfect example could also be this right here, this inverted head and shoulders right here. We have this left, this head, and then this right shoulder. We break the neckline. So, as you can tell, this right here is going to be the lower high of this market. If this is the lower high of
this market and then this is going to be the lower low, that lower high and lower low, guess what happens? We break that neckline, we Break that lower high, we break the lower low, we then break above it, come back, retest it, have the bullish engulfing candlestick, and look at this beautiful push to the upside. Like, it just I just can't I just can't get over it, you know? I just can't get over how many times this pattern happens all of the time. perfect examples right here on a head and shoulders that it did not
respect it. So technically, you know, you can call this the left the head and Then the right shoulder. And if you were to call this right here the higher low, technically it did break that neckline. So if you were to call this the higher low and this the higher high for examples purposes, this right here, technically it did break that structure and we did come back and then retest it and it could have sold off. But personally, I would have not counted this as a right shoulder for me. That would have just been way too
small of a Right shoulder. Would have not been as clear. Like I want the right shoulder to be obvious. I want you to be actually be able to spot the shoulder. For perfect example could be this one here as well. And I know I'm beating out a dead horse here, but I know that the repetition is what's going to lead you guys to success. I know that's what's going to make you guys see the things how I see it. Cuz what makes me a profitable trader and be able to see the markets How I see
it. It's not something secret that I know. It's the amount of times that I've seen this and I actually could understand it better than anybody else because I've seen it so much. Right here, we have a left head and then guess what? We never broke that higher low. So then this never created the right shoulder. If we look at this on the neckline, I mean on the line chart, this is technically going to be the higher high right here. This is technically Going to be the higher low right here. So as you can tell, price
never broke below that higher low. So, while this was creating that potential right shoulder for us to then sell because right there that looks like it can create the perfect right shoulder, we never broke below the higher low. We continue having this push to the upside. So, ladies and gentlemen, Head and Shoulders pattern is my favorite reversal pattern, but not because of the Actual pattern itself. It's because of how it is done and that is with the shift of structure from the higher low to the higher high or once we actually break the neckline we
come back and we retest it and then we sell. Head and shoulders is my favorite and most effective reversal pattern. Now to this we're going to add what is also called as a indicator. Right? So an indicator is obviously exactly what it's named, an indicator, right? It's going to indicate To you that the market is either going to do one thing or do another, right? So there's many different types of indicators. You know, we can go here into the indicator section of Trading View. And this area alone, you can pretty much click every single one
of these and you're going to have a billion different types of indicators. They all supposedly know what's going to happen next. There is always a new indicator. They're always doing updated indicators. There's always going to be different types of indicators that the market is going to offer. Now, the only indicator that I personally use is the EMA exponential moving average. Now, I use this you guys can see it over here. EMA. So, the moving average exponential. I don't know why it says EMA and then the wording of it is completely different but it is the
exponential moving average or the moving Average exponential potato the same thing. You guys understand I only use an indicator by accident. I was never planning to use an indicator. For me the indicators I tried to have many different types of indicators. I tried to do the indicator crossover. So, it's where you have like five of them and then whenever all of these different types of indicators whenever they all cross over that's when you would sell below it or whenever the price would Cross above all of them that's when you would buy with it. It's all
[ __ ] [ __ ] at the end of the day. Indicator is a delayed line on the chart based off of price. It's never going to predict the future because it needs the current price to be able to like create the indicator and it can never create future price because it doesn't have the future price. It's just an added confluence, right? So, whenever you see price, you're going to see this little Blue line that pretty much just follows it everywhere it goes. Now, this blue line is literally exactly what it seems to be. It's
like a dynamic support and resistance level that follows price. Whenever you're above the indicator, it is used as supports. Whenever you're below the indicator, it is used as resistance. Now, this indicator, like I just mentioned, I came across it by accident. I was just pretty much searching the internet for all different Types of profitable indicators and there's just really one that stuck out and that is the exponential moving average. For you to get access to this exponential moving average, just type EMA and then it's going to pop up as the 20, the 50, the 100,
and the 200. So, I want you guys to go ahead and click on that. And once you guys click on it, you guys are going to see how you're going to get all these different types of indicators that pop up on your chart. You have here the the 20. The 20 is always going to be closest to the price because it just moves as close as it can to the price. Then you're going to have the 50, which is the one that I use, and it's it's this other blue one right here. Then you're going
to have the 100, which is a bit further. And then you're going to have the 200, which is is even further. All of these are [ __ ] [ __ ] pretty much. But there's only one that sticks, and that's the 50 EMA. So for you to get access to the 50 EMA, how I do, just go ahead once again, click EMA, and then you can just click on this section right here. And then once you click on this section, then you want to make sure you can go to the settings icon over here. And
then on the settings icon, you're going to go to or how is it? Do you double click this right here? Visibility like this. So, what you're gonna make sure is that you can go ahead uncclick the red one, Uncclick the dark blue one, uncclick the light blue one, and then you're going to be left with the 50 EMA. The 50 EMA is going to be that orange one. It's already a preset. You notice if I uncclick it, it's literally right on top of my blue one that I have. I guess I just have an old
indicator that I haven't updated and I don't care to update it. It's just there or I can just change it to this one. But as you can tell, the 50 EMA is going to be that Middle indicator because it goes right over my blue line that I have right there. It's literally exactly the same. And then that is pretty much how you place the indicator and how the indicator is used. It's basically a dynamic support and resistance. Whenever the price is moving up and you're looking to buy at anywhere in this point right here, you
being above the EMA is just an added confluence. If you're looking to buy here, for example, and You're above the EMA, it's just an added confluence. If you're looking to sell over here and you're above the EMA, just something to take into consideration. Over here, you're buying, it's above. Whenever price going down, it hits below. Whenever you go above, it's just it's always delayed in my opinion. I just have it honestly because I think it looks cool. But there is some certain scenarios where it happens to line up perfectly with certain areas of interest And
and certain points. For example, like the 1 hour right here, right? So for the 1 hour, as you can tell, we have the head and shoulders pattern. Left head, right shoulder, right? We already understood that. We have the neckline of the head and shoulders. And then guess what? Price broke this area. Came back to retest the area of interest. Retest the EMA. I mean, it retest the area of interest. the neckline of the head and shoulders and it also happens to have The EMA at that area. It's all a piecing of puzzle all together. If
I were to compare this to something of an engine of a vehicle, it's almost like having the hood of the car. Do you need the hood of the car to drive the car? No, at all. But it completes the car, right? Can can you remove the hood and still drive 24 hours without the car turning off? Yes. Can the hood be off, it rain, and the engine still be fine? Yes, of course. The hood does nothing other than Just give the car an aesthetic look and it just completes the vehicle and it also protects your
engine parts so I don't know um somebody doesn't steal something from it. But you can drive the car without the hood. So the EMA is like the hood. It's just like the cherry on top. It completes the trade for whenever it is needed and you want to add it as a confluence. For example, on the 1 hour time frame, this EMA is used as a resistance to then sell. But if we were To go out to then the 4 hour on the 4 hour you can tell that we are above the EMA and now it's
going to potentially reject it to then head to the upside potentially. On the daily time frame we're extremely far from the EMA for example. And on the weekly time frame we are even further away from that EMA. So the EMA it is not used just based off of entry time frames, right? I I don't use it just on the lower time frames for this example. It just happened to line Up. I can find a different example of a trade that I took. For example, let's just say this one right here. The 1 hour time frame
when I was interested in taking this trade, I happened to be a little bit below the EMA. Cool. That was an added confluence. On the 4hour time frame, when I went to go take the trade, I was a little bit above it. On the daily time frame, when I went to go take the trade, I was very above it. So, the EMA is really not used at all. I just Want to educate you on what it is so you don't go out there like a maniac trying to figure out the secret formula behind it because
the truth of the matter is that there is none. There is no secret formula to the EMA. Sometimes it's good to be above it. Sometimes it it doesn't even matter. I personally when I go grade my trade, the EMA is literally at the bottom of the list. Like after I do all of my analysis and I do all of my checklist and I do everything, I'm like, "Oh, where's the EMA? Is it there or not? Oh, it is. Okay, cool. It's not. Okay, cool. It doesn't matter. It does not complete my trade. It does not
take away from my trade and it doesn't do anything for my trade. The only again, for example, here I'm selling it. We're below on the 4 hour. Cool. Let's see on the 1 hour time frame. What are we doing over here? Trying to make it back over to price on the 1 hour time frame. Perfect. As soon as I sold, I happened To be below it as well. What a coincidence. For this example over here, when I happened to buy, I was below it. So, technically, I was breaking the rule. The EMA is nothing but
a delayed support and resistance. You placing a area of interest like this how I have placed it right here is far more accurate than the EMA because the area of interest is going to be valid for the real market structure and for the weekly, for the daily, for the 4 hour, For the 1 hour. It's all going to be the same thing. Not like the EMA how it is subjective and it moves based off of the time frame. Depending on the time frame that you are, it is going to be a bit closer, a bit
further. It's going to be added. It's not going to be added. Now, once again, there is hundreds of different EMAs. The EMA is simply just a dynamic support and resistance that holds price up supposedly whenever you're above it, and whenever you're Below it, it pushes price down. It is a delayed indicator, and it has zero importance when it comes to trading. You're not going to build a whole entire trading strategy just based off of EMA. This will be a cherry on top on your trade when you go enter it. If you have it, you have
it. If you don't, you don't. So, I'm just going to remove this here so I just don't have that extra indicator for no reason. But the EMA is pretty much just a extra tool to call It. Now, you understanding head and shoulders, you understanding EMA, you understanding market structure, top down analysis, areas of interest, blah blah blah. These are all different ways on how to read the market. Now what if I told you that everything that I have just taught you sets up the perfect trade based off confluences. So there is something called confluence trading
and confluences are literally what I have been talking about every single pretty Much time that I go trade every single moment I have this confluence I don't have this confluence I have this I don't have this confluence trading is literally having the most amount of reasons to enter the trade or not it's like right now I'm trying to invite my buddy out to go out to the bar with me to go drink I can't even remember the last time I went to a I don't think I've ever gone to a bar to go have a
beer, right? But just just for example, right? Let's say I want to invite my friend to go out to the bar. Hey, bro. Bars are I don't even know. It's happy hour. Um there's going to be a lot of um college girls there and I I don't even know what people do at bars, but right, I'm just trying to give him as many possible reasons to convince my friend to come to the bar, right, and go have a drink with me. Bro, beers are half off. There's going to be a lot of pretty women. free
nachos and on top of That they're playing a football game. You say all that to your friend and he's like and you know what makes more sense to be at the bar than to be at home doing nothing. So you you basically made it make sense for your friend to be at the bar with you rather than be home. Confluence trading is really no different than that. But it's just, you know, it's just revolved around money and you can actually do something with your life, right? You can actually Capitalize off of it aside from just
wasting your time at a bar drinking beer. So when you go confluence trading, you try and add as many possible things together to the trade for it to logically make sense for the trade to actually go in one direction versus the other. Because we all know the market is going to do two things. The market from this point right here can either go down or it can continue to go up, right? If you at any point in your life, you Figure out if the market does either one of those two things, you [ __ ]
call me, right? because you're on to something special or there's something wrong with the market. But in my humble seven years of trading in these markets, I have never seen the market do anything other than from this point right here go up or go down. So it's already a 50/50 chance. But now what if I told you that if at this area right here, there is seven reasons on why it has a higher Probability of going up than going down. Well, it just simply makes more sense to buy than to sell it. That's really it.
At no point in my trading am I 100% confident that this trade is going to go in one direction or the other. I just simply have so many reasons for it to go in that direction versus the other that I go ahead and risk money behind it. But I don't have inside information. I don't predict the future. I don't have a crystal ball. I am not an alien, right? I just have a logical amount of reasons on why it's going to go up rather than down. And that is all based off of everything that I've
taught you on this video. First thing, for example, is this market bullish? Bullish or bearish? All right, cool. Well, this market is bullish. All right, cool. So, that's the first thing we got, right? We already we already understand the market is bullish. Cool. Well, where is the market right now? Well, this market is at an Area of interest that it's a respected area of interest. [ __ ] All right. Cool. Cool. Cool. So we are at an area of interest. So this area of interest is obviously a very wellrespected support and resistance. We're above it.
It could be used as support. Okay, cool. So right now we understand we have two of these confluences in our favor. All right, cool. What else do we have? So we also have at this area, let's say this is the daily time frame or the 4hour time frame Has created a dogee candlestick, an undecision candlestick. And after this undecision candlestick, it's created a morning star formation. Wow, we have a morning star formation for example. Morning star formation. We have three logical reasons on why this trade should go up or should go down. Now this is
a simple very simple confluence trading checklist that we can just I just built off of 5 seconds. We understand that we are having very clear indications that This should continue go to the upside rather than the downside. We're at a support level. We're trading with the trend. And then we have our entry signal. Go ahead. We enter our trade. And after we enter our trade, guess what? The trade does what it does. Continue trades with the trend. Has a reaction from a support level. And it has the momentum based off of the entry signal confirmation.
That right there is literally confluence trading. Now, That's me not even including if we have the EMA. Me not including if maybe on the 4hour time frame there's an inverted head and shoulders over here. That's me not including so many other little extra things that can be added to this for it to make more sense. Right? This is just me going off of three basic core foundations. Trend, area of interest, and entry signal. It simply makes more logical sense to enter this trade on a buy rather than a sell. And the best way That I
can present this confluence trading is if you literally go up to your your your parents, your siblings, your cousins, your friends, somebody that doesn't believe in your trading journey or somebody that doesn't even understand your trading journey and you literally tell them, all right, you show them this chart for example, right? So let's say for example, I'm going to show you let's say uh let's say for example this market right here, right? Right? For example, let's say this market right here. and you go ahead and tell them, "All right, what do you think this market
is going to do? Do you think this market is going to go up or do you think this market is going to go down?" They're going to have no, right? Cuz you're going to you're going to show them an empty chart like this. They're going to be like, "Dude, I have no idea up or down." Now, they might be right or they might be wrong. It's it's really a 50/50. It's not that hard to be right. It's just very hard to be right consistently and profitably. And that is where having just a proper checklist and
a proper confluence list that changes all of that. Right? So let's say you just tell your random family member, your random friend or whoever if this is going to go up or down. And they just say, okay, I think it's going to go up or I think it's going to go down. And you tell them, okay, let me tell you What I think. And then you start explaining to them, all right, well this market structure is currently bearish. So this is the lower high. This right here is the lower low. Secondly, after this market being
bearish, this right here is a respected area of interest. And we also happen to be very near the neckline of this head and shoulders, which is a massive reversal pattern. To add to that, when we go down to the 4 hour, the 4 hour is rejecting this 4hour EMA. And when we go down to the 1 hour, we're having a 1 hour pin bar rejection from this area. They're going to look at you like if you're a [ __ ] mad scientist, and they're going to be like, well, you're talking Chinese, but you know what?
These are many things that I don't know what they mean, and I guess it makes more sense to sell than to buy at this point. Just for example, right? Just me right here. I pieced up a trade to make more sense to sell than to buy. That is all confluence trading is. Is you get everything that I have been teaching you, which is just very over the top. And by the way, these are more things that I can teach you later on. But these are just very over-the-top things that make the trade make more sense,
right? A better example could be this trade, for example, right here that I was interested in taking and I happened to miss out. Or even this trade, for example, that I was Interested in taking. We have the trend, the lower time frame trend in our favor. We break this area. We come back to retest the neckline. We are retesting the neckline of the area of interest. We have had a shift of structure. We are rejecting the area of interest. We are rejecting the EMA and then we have a massive bearish engulfing candlestick. It just makes
more sense to sell than to buy. Confluence trading is literally building the perfect trade setup for you To have the most amount of confluences in one direction or the other. Now, I get this asked all the time. Is there a minimum amount of confluences that I would have in order to take a trade? And the answer is no. Why would I want to have a minimum amount of confluences? Like, that just makes most no sense to me. If I want to risk my money where my money is going to be the safest, I I don't
know why traders have this perception of high risk, high reward, Right? Or or people that just get involved in trading, they think, oh, whatever is high risk is high reward. Guys, we are not in the casino. We are not in the what's that thing that the the the powerable. We're not in the powerable. We're not in the lotto. We don't want high risk. High risk actually means low reward. A trade that has zero confluences is high risk. And if it has high conf if it has high risk and no confluences, the odds of you winning
That are very low, right? So, you're not going to have a very high return on that. But now if a trade has eight confluences for example that makes that a very lowrisk trade and meaning it's a very small chance that you're going to lose. So it makes more sense to risk more money on that and that is where you in turn have higher reward. You have high rewards on the lowrisk trades. Why? Because you're going to risk more money on trades that have less odds of losing. You're not going to risk more money on a
trade that has higher odds of losing. If it has higher odds than losing, I don't even want to get involved. I want to get involved when I have the least amount of chances of possibly losing. And that is exactly what confluence trading is. You're building a approach to a trade where it simply makes more sense to do one thing rather than the other. Perfect example is right here. This trade right here, we were rejecting this very strong Area of interest. The daily time frame was bearish. This is a massive bearish engulfing pin bar rejection. I
then go down to the 4our time frame. We have a left head and a right shoulder. We break this neckline. I go down to the 1 hour. On the 1 hour, we then have a another left head, right shoulder. On the right shoulder of the head and shoulders on the 4 hour. We break this neckline. We come back. We retest. We reject the EMA and a massive 1 hour bearish engulfing Candlestick. I have just told you seven different confluences in 5 seconds off of everything that I've just simply told you. Daily rejecting area of interest,
daily bearish engulfing candlestick, 4hour head and shoulders candlesticks. Then you also have a break and retest of that head and shoulders neckline. That's another confluence. And then on top of that, you have a head and shoulders on the 1 hour time frame. break and retesting that neckline, rejecting the EMA, and then your entry signal, which is the bearish engulfing candlestick on the 1 hour. What else do you need for it to make more sense to buy? Now, don't get me wrong, there's going to be times where you're going to have 10 confluences make sense on
your trade and then guess what's going to happen? The trade will go in the opposite direction. There's no guarantee at any given point that the trade is going to always win. No, but it just makes more logical Sense. That's why I tell people all the time, I think trading is the the ultimate hack to making money online because I just think you can literally predict the future by just having the most amount of reasons on why it's going to go in one direction versus the other. The best analogy that I can put with that, it's
almost like if you're going to go out there and go fishing, right? Now, let's say you're going to go out there and go fishing and you know Historically when the waters are calm, when there is a very bright sunny day, no clouds, and you're the only person out there fishing and the tide is low, for example. I'm not a fisherman, right? I'm just making stuff up right now. And the tide is low that the fish have nothing else to do but eat and they're going to be looking for food. What if I told you that
you can literally go, you can literally just sit by the dock and wait for the weather conditions to give You that perfect condition and then you go out and fish at those times? Why are you going to go out and fish when it's cloudy, when there's a hundred other boats out there and when it's late at night or late in the afternoon when there's already been a feast? You won't do it. It simply doesn't make sense. You're going to go out there when it makes sense, when you have all the proper conditions for you to
go out there and actually go and fish. This Right here is you literally creating your condition. You're just sitting on the sideline, sitting here on the desk, and you're going to wait for the market to give you that perfect entry signal for you to enter the trade. You're not going to just enter any trade impulsively just because you have the opportunity to do that. Yes, can you just get on your boat at whatever point you want and go out there and fish? Yes, you could do that. But you're going to Waste fuel. You're going to
waste time, waste bait, and then most importantly, waste your own mental sanity because you just want to go fish whenever you want. And can you get lucky and catch one or two fish? Sure. But that's not how you're going to sustainably catch a [ __ ] ton of fish and make your family happy and bring food to the house. You're going to do that when you go do it at the effective times where you're going to be able to optimize and grow the most And be able to actually do it the most. And that's exactly
what confluence trading is. You're building the most amount of reasons on why the trade should go in one direction versus the other. And it's all a checklist, right? So, for example, you can build your own custom checklist. You can build a checklist, for example, just off of the confluences that I have told you. The first one could be trend. The second one could be area of interest. The third one Could be entry. And then lastly, you can have patterns. Right? So when you go analyze a trade, you say, "Okay, we have the weekly and then
the daily in our favor." All right, cool. That right there, we have a double check. We have two trends in our favor, right? So we have the weekly and the daily in our favor. Are we at a weekly or at a daily area of interest? Well, right now we're in neither. Okay, so you don't take a trade if you're not at the area of Interest. You simply wait. Okay, cool. Now we're at the area of interest. Bet. We check that off the list. Now that that we're at the area of interest, do we just jump
right into the trade? No. You need your entry signal. Or you could jump into the trade right if you want to. But the beauty of the entry checklist and the trading plan is that you know exactly the type of trade that you are taking. You're aware of the decisions that you're making. you're not Blind to it anymore. You know that you need these four confirmations for you to take the trade. Now, I have my own custom plan and I teach this to my students literally every single week live and I mention them and I review
the trades and stuff, but it's a very in-depth checklist that I have and I would literally lose you guys at this point right now if I were to show it to you guys. Like, I literally have it right here. It's like my perfect Checklist. If I were to show you guys that right now, you're going to be like, "What the fuck?" cuz if you guys are like already wow about certain stuff, I don't even I don't even think you guys are ready for this checklist. But it it is consisted of this core base right here.
If a market is at a trend and you actually have trending markets, that's already a plus. If you have a solid area of interest and you're at an area of interest, that's already a plus. Now, You need lastly your entry confirmation. Your entry confirmation can be on the lower time frames or the higher time frames depending the type of trade that you want to take. And then on top of that, you have either a very clean resistance area with a very clean area of interest as a resistance. We have broken out of this area. Now
we're retesting it. They have a trend continuation pattern. Cool. You have a break and retest. Or let's say that you Are having this retest of this neckline and you're selling at this area of interest. That area of interest also happens to be the area of interest of the neckline of the head and shoulders. Boom. You have another confluence. This is all about building the perfect trade. These are the checklists that you need to go through in order for you to build that perfect trade. Does every single trade need to have every single one of these
checked off for it to be the Lowest risk possible trade? Yes. Does the every single trade that you take need to have every single one of these checked off for you to take the trade? No. And that right there, ladies and gentlemen, is the problem with traders nowadays. Since you don't have to mandatory check in somewhere or check in with yourself that this is met, you're simply just taking a trade to take a trade and you're just entering a market to enter a market with no real plan. That is the problem with trading nowadays and
traders. They're entering a trade without knowing where or why they're entering it. And they don't have any form of verification to confirm what they're doing is correct. This right here is the correct thing. This is just a very simple plan. You're trading with the trend. You're buying or selling at a strong area of interest. And then you have your entry confirmation. That right there is such a simple trading strategy. And I can agree with any trader out there, whether they are any type of concept trader that they would agree with this right here. Even if
we don't see it eye to eye on our personal strategies, which is like how you actually optimize and get sniper entries. Every strategy is built off of this foundation right here. There's no way. It's simp there's just no way. It's not like an engine is just built of an engine block off of a transmission and Off of a cooling system. Whether it's going to be Corvette, Mustang, Nissan, Toyota, uh, Infiniti, Lamborghini, Bugatti, Ferrari, it's all going to consist of the same thing. Engine, transmission, clutch, and cooling system. All cars are going to have that no
matter what. Now, some cars are going to have better performing parts, but it's going to have the same function. And that is exactly what this is right here. Some strategies are going to have Different ways on how to use the trend, different ways on how to use the area of interest, different ways on how to use the entries or patterns, but it's all going to be off of the same exact thing, this core foundation of this trading plan right here. And if you don't have this plan right here checked off, you should not take the
trade. The trade is going to be a high-risk trade. High risk does not mean high reward. Having all of these checked off will mean you have a Lowrisk trade which in turn means you should risk more and then there you have a high reward. Confluence trading has completely changed my way of trading in the markets. Has changed my life to be completely honest because I actually know exactly what I'm doing every single time when I go execute a trade. And just based off of this simple video here today, you guys should be able to go
ahead and just use this basic foundation successfully. and actually be able to See a difference in your trading. This right here is the game changer personally for me and for all of the students every single week in the markets. Now, you might want to see me actually break down this confluence trading on an actual market. Like, you might want to see me actually break this down in real time and put it to practice. Now, I'm going to be doing that with you guys now on a trade that I actually took and it made me $340,000
Or something like that. And that trade that I break down is a bit advanced and I am going to say some of the terms that you might not understand just yet. But what I want you guys to do is pay attention to the core things. Trend, area of interest, and entry signal. So now, if you guys don't understand that just yet, once again, this video is not going to go anywhere. I think it's best if you just pause right now and go back and watch and make sure that you learn Those things properly. So once
you watch me actually break this trade down live and me executing in real time and seeing the outcome of the trade, you guys can have that, oh, okay, now I understand and I get that. So me breaking down this trade in real life, I show you guys exactly where I was looking to enter, my thought process behind it, and a little bit of a raw version of how I trade by myself when it's either in New York session or London session and how I Approach the market. So I'm going to break this trade down for
you guys right now in real time. Let me show you guys how this goes down. All right, good morning ladies and gentlemen. We got another interesting week ahead of us. NZDUSD right now the daily time frame. We're extremely bearish. This is the lower high. This is the lower low. And as of right now, this is bearish because of this lower high and this lower low. Not this lower high or this lower low. This is actually just a very strong bearish confirmation within the lower high and the lower low. We rejected this area of interest very
strongly and very nicely along with the EMA. Now we are potentially almost creating like a right shoulder, literally a right shoulder to reject under this previous structure level. How we've done here in the past, we've literally broken through this area, retested it, and then sold off. That's exactly what I'm anticipating to Happen here. The 4hour time frame, we're having a very clean 4hour head and shoulders. The 4hour is bearish. This is the lower high. This is the lower low. This is just to pull back into the area of interest and reject the area of interest
along with the EMA we've done here. Now, we got to be on the lookout because we did this last time. Literally broke below, retested and had the engulfing and we didn't. So, so this area is not as respected as you would Expect. You see here, we broke below once. We came back through and we just completely violated and we didn't respect it. We did it here once again and we've done it here multiple times. Just because you have a rejection from this area doesn't mean that it's ready to enter. So, I'm going to wait for
a bit more confirmation, and I want the market to show me its hand first by having a bit more of a push down, even if I get a little bit of a worse entry. That's fine. All I got to do is just make sure that my risk-to-reward makes sense. And then my stop loss anywhere from 10 to 15 pips above this wick over here. So, this is 13 pips right here. I have to put it around 20 23 pips. And then my takerit, I'm going to aim for it to be somewhere around here in the
lows for a quick one to two. So, that's NZDUSD. We have Euro GBP which we have been waiting for this trade to come back up into this area of interest for us to Sell. Price has not come back up into this area of interest. As of right now, we're kind of just waiting for the market to do that. As of right now, we're literally just setting and forgetting until that happens. USD CAD waiting for this to make it back into this area of interest. We actually took this trade last week. We got wicked out and
it went into some profit. Um but not our final take profit. We're going to wait for it to come back and potentially Retest this area of interest to then buy. It's a very clean trade along with very strong bullish moves. And ND CAD is probably one of my favorite by far. And as of right now, we are creating the perfect left head, right shoulder. And I am seeing that this is the potential perfect area for it to have the break of the neckline of the head and shoulders to then have the retest and sell. So,
I'm not going to do anything until we don't have that break And retest confirmation in order for us to sell of this neckline of the head and shoulders and your JPY not that interested right now. So, keep your eye keep you guys updated and we'll come back in a couple of hours. All right, boys. Market update. So, this is how we're looking on NZDUSD. Beautiful push confirmation from the area exactly how we explained it. Sucks a little bit because I got a worse entry than I wanted to. I knew I should have waited For this
wick pullback. So, I told you guys as soon as we had this 4hour bearish candlestick engulfing, evening star formation rejection from the EMA and this area of interest that I want to wait for the market to show me its hand first. That's what it did. So, we had the continuation push. So, then here I went I entered on off of this. I probably have worse entries because of like spread, but I always like to base it off of Trading View. So, I was going To wait for this wick retracement, but I didn't. So, I just
entered off of this confirmation here. And I mean, it is what it is, right? Not the best entry that I wanted to have, but all I really care about is overall direction. If this 4hour candlestick closes below the structure point, I then anticipate for it to have a small retracement and then continue pushing to the downside. But it is a very, very clean trade as of right now. The daily closes like this, we have Very strong push to the downside as well. 4hour time frame just very solid. Everything just looks very clean. So, moving very
nicely. Euro GBP, we're on our way to the area of interest. USD CAD had a reaction from this area. Don't don't really care about this one. NZD CAD still waiting for the break and retest below. And Euro JPY, nothing. So, NZDUSD for now. We're going to set and forget. So, put a little marker just so we know exactly where we Last did our previous update. So, check back in in a couple hours. That, by the way, that was only like an hour ago. Well, this is why you have to [ __ ] set and [
__ ] forget. The last time we did an update, it was here. It's having the retracement seems to be on the 30 minute time frame. So, 30-minut time frame looks like it's going to create this very clean lower high, which honestly, it's even better. I would much rather for this to close with a strong Dogee like this and people be like, "Wait, why doesn't that mean that it's rejecting it?" Not necessarily. That means that the lower time frames are creating that structured pullback and then the next candlestick on the higher time frame will fill. So,
it's going to be more of an aggressive push in that direction. But a little bit of a red flag. Last time that we were here, we did the exact same break, retest, very strong bearish engulfing, and then guess What happened? We completely reversed. So, there's a probability of that happening here because last time we came here and rejected, we reversed. We rejected. We reversed. Now, you know what they say, third times a charm. I'm not saying that's what's going to happen here, but you know, I'm going to, you know, see what goes down. All we
got to do is just set and forget. Whenever I enter a trade, I commit to the trade. I don't ever ever ever Enter a trade and then get out of it before either hitting my stop-loss or my takerit. Very rarely. There's obviously a 2 3% chance. I mean, one out of every 20 trades that I do that, but it's not what I like to do. Whenever I enter a trade, I made a decision that my mind is 100% convinced that this trade is going to go in one direction versus the other. I've done all of
the proper top down analysis. I have done absolutely everything that I need to feel Comfortable risking $100,000 behind this trade. When I entered this trade, I was on a nonchalant approach and the decision the decision that I made was based off of probability and my strategy being made. Now, as soon as you click that buy and sell button, you start thinking different cuz now you're like now now it's now it's real. Now the money can actually get lost. You saw some profits, now you saw some red. And then your mind starts to change. And I
Don't let that affect my decision at the point when I took the trade because I trust myself. I know when I take the trade, I know what state of mind I was in to take it. I know that I did the proper analysis to go ahead and execute that trade to the best of my ability. So, there is no reason why I should [ __ ] with the trade if it doesn't hit my stop-loss or it doesn't hit my takerit. If you do, then you simply weren't ready to go ahead and execute that trade when
You did. So, for me, we're just going to keep setting and forgetting. So, we'll update you guys in a little bit. All right. Good morning, ladies and gentlemen. In market update right now we are a little bit in profit in our NZDUSD trade. So we literally had the exact retracement exactly how I anticipated. We rejected from this high creating that right shoulder exactly how I anticipated it. Beautiful daily bearish push to the downside. It's like a left head right Shoulder and then there's a left head right shoulder within the right shoulder. I love that. So
so far it's moving pretty decent. I would love if this daily time frame can close with a very strong bearish candlestick. We have about six hours left in this candlestick. So, let's see how that does. The 4our time frame is still needing to break below this structure point to give us that confirmation that we're going to have the push to the Downside. So, I'm going to put my alarm down here to let me know once and if we actually decide to do that. And on the 1 hour is looking pretty decent because this is the
1 hour lower high over here. This is the 1 hour lower low. And same exact thing. If the 4hour body closes below this, we create a new 1 hour lower low and it's just going to be all bearish to the downside from this point. It pretty much should just be a just free just a free run to take profit Zone. I should have I wish I would have had a higher TP with a better risk-to-reward because I could see it reacting above this area, not making it all the way to my takerit. But let's see
how that goes. Euro GBP just made it to the area of interest. We just got the alarm. So, I'm going to be waiting for some entry signals to enter around this area. Some decent break like bearish engulfing candlesticks like this. Like this. I'm going to be interested in Selling here. USD CAD. Wow. Wow. Wow. Wow. Wow. Yeah, we got [ __ ] didd it over here, dude. Look at this [ __ ] Literally wake us out by three pips and now fly fly take profit for a one to four. You can't make this [ __
] up, bro. It is what it is. NZDC CAD right now is perfectly cooking up the perfect left head right shoulder having that bearish engulfing candlestick right now from this area and now it's just having a reaction above This area of interest. Ever since the markets traded from Biden to Trump what I've realized is that the markets are just not respecting the head and shoulders at the right shoulder as it should before. As soon as you get that right shoulder to form, I would sell off of that right shoulder and anticipate the break of the
neckline. Now I can't do that. I gotta wait for the break and retest because this doesn't respect it the same as before. So, I'm waiting for That extra confirmation. It's what you should do actually, but before I was just more of a DGEN trader and I would just take it right at that right shoulder and if I would have taken it here, I would be in some draw down. But the right thing to do is at the break of that neckline. So, let's wait for that to cook up and uh euro JP JPY nothing. So,
let's just keep setting and forgetting. NZD USD. We'll check back in in a couple Hours. All right. All right. All right. A little update. A little update. A little update. Hello. Hello. Oh, no. No. Tell me. I I hope I'm [ __ ] up. All right. So, market update. We are up around $88,000 right now. So, this is our trade right here. You can see we're up 88 grand. It's funny because my screen is still broken and I'm up 100 grand on this one trade right here. So, definitely broke Below this structure point right here.
We're moving very nicely. Having a very clean push to the downside and uh yeah, I [ __ ] forget. That's pretty much it. This market hasn't rejected as much as I want to. This is just absolutely ridiculous. And NZDUSD is having a break and retest. So, we're going to wait for that. So, for now, let's see how the daily closes and we'll come back. We'll update you guys. It's very strong movement. So, Let's wait. All right, boys. Little bit of a market update. So, I spent pretty much all day just in meetings. Worked out a
little bit. And this is how the market's looking right now. So, very clean continuation push to the downside. We have stopped at this very strong level of support. Exactly how we anticipated. Right now, we are up a solid, let me show you guys this. Right now, we are up about $123,000. Oh, you guys cannot see that. We're up $124,000 as of right now on NZD/USD. I'm not going to lie, I went a little bit low risk like a [ __ ] [ __ ] I should have gone a bit more high risk. And it is
what it is. Usually I risk anywhere from like 100 to 150 on this trade. I went around like 70 60 75 and I like that the fact that they had this strong bearish engulfing candlestick but clearly that doesn't Really mean much when price reaches this area because you know you can have a strong rejection from this level plus a strong bearish engulfing candlestick and then the next move just be a massive push up and this market was bearish when it did this move here. Same exact thing here. You could have a bro I'm talking about
this astronomical bearish pinball rejection from this area reach this point and then have a push up. Same thing here. Very strong bearish Candlestick into this area then have a push up. So exact same thing bear push up and you so like it's a pattern that has happened here. I personally believe that this is the move that will break through that. And if this is the move that breaks through that, boys, we're we're talking about massive downside potential from from this here. Like, this is literally going to be massive. Is it worth the risk? I I
don't know Because I I got to be realistic with myself, right? Because here we have a massive left head, right shoulder. We broke, we retested the neckline. Like I see this having a just continuation push to the downside. But I don't know if it'll happen this week. Maybe it'll I mean it is only Tuesday. We still have a whole entire week ahead of us. What I do know is this. If it does have the breakthrough this area, obviously we're going to catch much more risk-to-reward. Let's say we're up a one to three, right? One to
four, right? Which is awesome. But I do know that if it does have that very strong weekly bearish engulfing candlestick, we can have a pretty big retracement to then sell. Exactly how we did here. Very strong break through this area. Then we come back, retest, and then we sell. Like I'm not too concerned about missing out on money on this trade because I know it'll make it. If it's not now, it'll make it Down here. So like, let's say I close right here and then it does end up having the full push. Would it suck?
Yes, obviously. because I missed out essentially on free money. But I could very easily catch these cells once it does have that pullback. The pullback of that happening is very high. Uh I'm just going to keep my eye on it right now. I'm very confident on my analysis. I don't like that we are at this level and previously it's obviously reacted from It. I'm just going to keep my eye on it. If right now on the 30 minute time frame we break above this structure point right here, I'm probably just going to get out of
it there and just call it a trade and just not even look back. And if it does somehow pull back up into this area, then I'm just going to be looking to enter new positions on it to sell. But yeah, if it breaks above that structure point, I'm just going to take my profits and run. If it keeps going Down, I'm going to keep holding. So, I'm going to keep monitoring this trade live as it goes because this is a this can be a really really really big banger trade. So, I want to make sure
that I'm on the lookout for it. Euro GBP on the other hand right now, the daily time frame has had a very clean rejection from this area. The weekly time frame didn't quite make it up to this area of interest how I wanted to. Even though this area of interest, I could technically squeeze it Up and make it a little bit higher or I could also make it a little bit lower. I can make it something like this. On the daily time frame, we have had this pullback and we have had this this bit of
a of a rejection. Not my favorite. It just h cuz if I enter the trade here and I put my stop loss somewhere around here. So let's say this is 15 pips. Let's say we make it at 25 pips. And the next point where the market will potentially have a reaction Can easily be this structure point right here. structure point from this right here will be a 1 to 2.5. Not a terrible trade, but I do see some type of odds of this just coming in here and giving it a better rejection before actually having
a push. This is a perfect example right here. Price actually came into this area and then it rejected and even though it did come back. Same thing here. It did these little minor wick rejection but then it actually brought some full body Candlesticks in there. So I'm just trying to avoid some unnecessary draw down or a potential wick out. We are bearish. This is the lower high. This is the lower low. We have had a very clean shift of structure. H if we can if we can break and retest this little head and shoulders right
here, I'm going to take this trade clean. If we break it clean, I'm going to take this trade. I'm going to wait For this to have a very clean break, a clean retest, and then I'm going to be interested in taking this trade to the downside because I believe if it does that, it will continue to have the push. I believe if it doesn't do that, then it's just going to have a full push back up into here and then create a proper body structure rejection from this area. Because if we look at this for
the market structure for what it is, the market structure technically hasn't made It into the area of interest. We notice the structure is not there. structure is always the bodies, never the wicks. And the bodies haven't made there. It's only been the wicks. So, for now, damn, that's crazy. You guys see this right here? These are notes from 2022 that I put here on Trading View. Monthly bullish on June 20th. So, that is literally three years ago. Jesus. I've been doing this for a long [ __ ] time. And some people in their first week,
they want to quit. Isn't that crazy? USD card. Look at that. A round of applause, ladies and gentlemen. A round of applause. USD CAD wicked out and flew to our take profit for a one to four. Wow. We got [ __ ] diddied. D diddi straight diddled the [ __ ] out of us here. I can't believe it. I'm I'm I'm totally lying. I totally believe it. I saw it. I saw it. I didn't see it coming, but it is what It is. As soon as I got wicked out, I'm like, "Oh, there it goes.
It's going to go straight to my take profit." Now, I had to do that in order to go to my takerit. Beautiful trade. I'll take this 10 out of 10 times. A lot of people are always focused on how to avoiding these wickouts, and these wickouts are inevitable. The only way to avoid these wickouts are very easy, ladies and gentlemen. You want to avoid a wick out, don't trade. That's all I can say. If You're scared of getting wicked out in the markets, don't even get involved. When you get to the market, you're prone to
the risk and you're also exposed to the reward. If you want the reward, you simply have to be ready to take the risk. Sometimes it's [ __ ] Yes, trust me, it is. It's part of the game. But you know what isn't [ __ ] That you forget to place a takerit and instead of it being a 1 to2, it goes to a 1 to7. That's happened to me before. And I don't know about you, but I don't complain in those scenarios. Free money, right? But I get it. Some people want to only focus on
the negative aspect of trading, which are wickouts like this, but never realize the reward and the positive exposure that you're put out there when you actually take these trades. So, just put those things into perspective when you actually go execute a trade. Yes. Can you get wicked out? Yes. Is it Avoidable? Yes. Don't take the trade. Simple. So, USD CAD, very clean trade for now. I'm not interested. NZD CAD right now we are cooking up the perfect left head right shoulder waiting for this break and retest of this neckline daily has had a very strong
bearish pin bar currently accumulating at this area and there's not really much that we can do other than just set and forget I'm going to put an alarm here at the neckline to let me know once and if It does break it but yeah I can't really take a trade until it doesn't do that and Euro JPY uh looks like it's having the move but I'm not really that interested in it for now NZDUSD is our priority Euro GBP and NZDCAD. So, it's only Tuesday. We're already up $120,000. And uh I can see another trade.
A lot of people think that, oh, swing trading, day trading is hard. It's not. It's actually super easy because when you're Taking trades that have high probability trade setups, you know, they they tend to take their time to move in in their direction. For me, holding a trade anywhere for two to three days is a lot more logical if the probabilities are there rather than scalpers that they want to enter in and out of a trade in an hour and know if they won or if they lost. Well, you're probably going to lose more because
the odds of a trade getting wicked out on the lower time Frame is a lot higher compared to the higher time frame. People always trade in the lower time frames for whatever reason because I want the trades to be fast, but that's never going to lead them to be profitable. I don't know. I'm just ranting at this point. Let's check back in in a couple of hours for London session and let's see what happens. Oh my [Laughter] what the [ __ ] Oh my God. [Laughter] Yo, what the [ __ ] bro? What the [
__ ] We are up right now. Yo, you can't make this [ __ ] up, bro. We are now up $330,000 off the same [ __ ] trade. Oh my god. Yo, I was literally going to I just got out the shower and I was like, "Yo, let me go back and do the trade update." Saying that, "All right, for London Session, I'm just going to decide to continue to hold." Holy [ __ ] Oh my god. Oh, what the [ __ ] is going on? Yo yo NZD CAD, we're waiting for the break and
retest of the money line. Oh my god, bro. We had the whole move already. Oh my god. Yo, what happened? Was there some news? What the [ __ ] 1000 p.m. What the I mean, ladies and gentlemen, trade update. We're [ __ ] lit. Yo, we're up $337,000. $340,000. You can't make this [ __ ] up. You guys have seen the whole entire process of this trade. Oh, I'm buying some crazy [ __ ] That's it. I'm buying it. I I I'm I'm I'm going to buy another Bugatti. I I I I gotta do something,
bro. I just made a $350,000. Wow. Well, ladies and gentlemen, that For you is a [ __ ] perfect example. Yo, hold on. Hold on. I got to I got to Yo, I'm going to put this [ __ ] on Twitter right now. All the haters are going to [ __ ] hate this [ __ ] Oh, bro. I I I'm literally in shock. I'm in shock right now. I'm in shock. I did not expect this going to sleep right now. I was literally going to go to bed early to wake up early. Bro, this
is insane. All right, I'm going to focus. Ladies and gentlemen, market update. NZDUSD Take profit fully officially [ __ ] hit. I am definitely going to close this. It It could still continue to go down, but I will be closing this in the next 30 40 minutes. I have no intention to continue to hold this. It's gone way past my takeprofit and I am not going to be greedy. I am going to know exactly like I know exactly what I'm doing here, right? I'm going to just take my profits and close it out. We're at
more than I want to two. This is the situation where You cannot get greedy. Let me post all this [ __ ] on social media real quick and I'll be right back. All right, give me a second. All right, boys. Update. So, I officially closed the trade right now. So, we closed the trade at Jesus. We closed the trade at $396,000 in profit. Can you guys see that right there? $349,000 in profit. Sorry. Can't forget that mother, bro. [ __ ] This [ __ ] man. Hi. You think I I see you. Come here. Come
here. Come here. Come here, you [ __ ] Yeah. Yeah. [ __ ] with me. All right. [ __ ] with me one more time and see what the [ __ ] goes down. All right. [ __ ] [ __ ] But on a serious note, this is an absolute phenomenon of a trade. This is a beautiful a perfect trade setup. Cannot ask for more. I literally closed right at the bottom here at a one to Five risk-to-reward. Do I think this is going to continue to go down? Yes. But wow, that was a great
trade. I am going to be honest, ladies and gentlemen. I'm not trying to trade for the rest of the week. I'm I'm good. I'm good. Like I'm literally good. This is insane. This is insane. This is insane. This is insane. This is insane. Wow. So, all I can say, ladies and gentlemen, at this point is I hope you guys enjoyed this video. Trades like these are the ones That turn a somewhat profitable month into a very profitable month. You can't anticipate for one to five risk-to-reward trades to come. You can't anticipate for massive moves like
this. All you could anticipate is how you're going to react when the market gets to your one to two risk-to-reward profit, how mine was, and then you make the decision to determine if you want to continue to hold or not. That is the only thing you can anticipate. That is The only thing you can prepare for. You cannot prepare for anything else. That is the only thing you need to focus on as a trader. What you're going to do when it comes to decision making with the market gets to a position like the one that
it just did right now. Are you going to decide to hold or are you going to decide to close? Now, regardless of the outcome, let's say if I did close this position at that point right there and this market did this 1 second after I closed it, would I have been mad? Of course, right? I'm human. But you know what I would have done? I would have gone back to sleep and then I would have just pretended like it never happened the next night. 90% of you guys would be dreading on those profits for weeks,
months, and that what it does is that it gives you this constant negative energy approaching the market. And it will no matter what affect your decision to the next trade. And that is what you Need to control. That is what you need to master. how you're going to react based off the decision that you make. Cuz if I decided to close that position, I need to be okay with the outcome, whether it went back to break even or whether it did what it did. And if it if I decided to hold and now I reap
the benefits of taking that risk, now I have to be ready to control my emotions. I have to be ready and say, you know what, I'm done for the week. or if the next Trade that I'm going to take, is it a logical trade idea or am I just making an impulsive move because I just made a lot of money and I want to make more money. If you notice, the first thing I said as soon as I got back on here is I'm done trading for the week cuz I know myself. I know that
now I feel like the [ __ ] and I want to go make another 300 and close off at a million dollar week. But I'm not going to do that right now. I'm not prepared for that. I those Weren't my intentions for this week. My intentions for this week were 200 max and I surpassed that. So, I know myself and I stay true to my plan and my rules and that's why I'm at the position where I am. And that's probably the best piece of advice that I can give you right now. All right. So,
you guys just saw me break down that big trade that I took a couple of weeks ago. And you guys saw different ways of how I actually react to the market when it does certain Moves. You guys probably saw some terminologies that I've explained a little bit deeply inside of this class. other ones that I might have said over the top like you know previous structure point um some types of shift to structure but it all comes down to the core foundation of what I have taught you guys in this video right here everything that
I have taught you guys in this video is exactly what you need to be able to understand that market That I broke down 80%. The other 20% is just simply based off of experience and then actually having a bit more knowledge when it comes to defining the core points of my strategy, which is like how to basically tie up all these other extra confirmations, extra shifts of structure, putting into intertwined smaller areas of interest, a certain type of engulfing after a certain time frame. These are all things that you're going to learn with time. But
if you Notice the whole entire breakdown of the strategy, everything of that trade that I took was based off of trend, was based off of an area of interest, a pattern, which is head and shoulders, and then my entry signal. So, I had to be extremely patient when it came to actually executing this trade as you guys can tell. And when it came to the take-profit placement, I had to be extremely patient and almost a little bit lucky to actually capitalize off of It more than I should have. Now, a very important thing when it
comes to that type of trading is that you obviously are as unemotional as you possibly can. Sometimes I overreact a little bit for the camera. Sometimes I generally do feel like that. But that doesn't let me that doesn't affect my actual execution of the trade or the way I manage it. Like I follow a very strict plan. I enter my trade. I get out when it hits either my stop loss or my takerit. Whether I'm up a certain amount of money for the day or whether I'm down a certain money for the week or for
the month. I have pre-calculated the risk before I enter the trade and I have a full understanding of the position that I'm in which is the most important part in trading is literally understanding the position that you are interested in taking. A lot of traders once again don't know what type of a position they're actually interested in entering Into the market. And that leads me to the next point, which is how to actually do what I did, right? Make a lot of money when it comes to trading. And you can know the strategy all the
way to the end. You can perfect it exactly how I've perfected it over the last four years. But if you don't have a significant amount of funds, you're simply not going to make it in trading. Like I'm talking about you can literally learn the strategy, have all the experience in the World, but if you don't have the proper funds or the proper way on how to manage these funds, it means absolutely nothing. In my trading journey, it took me about a year and a half to understand the market, 70% of how I know it now.
The other 30% of how I know it now is just more intuition and a lot of experience. But the core foundation of understanding everything I've taught you in this video took me about a year and a half. It took Me about another year just to learn how to actually manage the money and how to scale it. One thing is reading the charts and then another thing is actually trading with real money behind it. The best example, the best analogy I can put is like going to go hunting, right? You can know everything about the forest,
right? All the animals that are inside of the forest. You can know all the possible trees. You can know exactly how to load up your weapon. You can Clean it. You can align it. You can polish it in the shooting range. Everything could be great. And you know exactly how to make the noises to attract the animals. All the preparation of going to go hunt. You know it perfectly. But at the point of actually executing and pulling the trigger once you see the animal on your scope is a completely different scenario prior to everything that
you've done. you can analyze the markets perfectly. You can Actually have the strategy to the tea, but actually executing that trade with the proper risk management is where most traders fail. Now, there's times where they execute things correctly and there's other times where they execute things incorrectly and then there's an unconsistency in their results. Perfect example, back to the shooting analogy or the hunting analogy. Let's say the first time you go shoot an animal uh or the first time you go hunt, you actually hit Your target and it's a success. It that's going to give
you a bit of a boost of confidence. So, your next time around to come hunt, you might not have extra extra bullets. You might not actually have your camouflage on. You maybe have a smaller scope or you don't take as long to get the proper aim. And then on that next shot, you actually miss your target. Well, then that's going to decrease your confidence on the third shot. Come the third shot, now You're overthinking everything. You're overp preppering. And then guess what? You make too much noise. There's too much going on. And then the animals
don't come. And then you scare them as a whole. Now you're just a frustrated hunter. And then you basically end up hating the sport because you found success at the beginning. And then what ended up happening is that there was an inconsistency on that success at the beginning. And then you basically just Gave up on it as a whole. That's what happens to a lot of traders. Traders come into the markets, they might see a little bit of money because they either got lucky or made the right decision, but then they get way too confident.
Then they start getting way too comfortable and then they start being unconsistent with correct things and then they start getting too deep into their head and now they enter this negative spiral or even overthinking and They have all of these opportunities constantly being missed right in front of their face. And this what ended up leading into is traders just quitting trading and they don't end up continuing with this journey. Now this is a very very very common mistake of traders in any part of their journey and with any part of the strategy and it's the
risk management and the money management side. I personally myself I think I've had one of the most legendary flips in The industry which is turning a $100 into a million. And a lot of people know me for this, but they don't know the preparation, the experience, and how many times I actually attempted to do this. Like, this was not an easy task. I attempted to turn a h 100red into a million. I think it took me a year and a half to actually complete this. I attempted it one time after failing like five times. I
took the account from $100 to about $330,000. And in one single week, I completely blew the whole entire account. I took about a threemonth break and then I come back and I document the whole entire journey again. Literally showing you guys as transparent as it can possibly be the before, the during, the after of every single position exactly how I have just done in this last position right here that I have just broken down. I did the exact same thing when I was taking the 100 bucks into the mill. And if There's something that I
learned in that journey more than ever and what actually led me to the success, it's not the decision making behind the trade, it's the decision-m behind the actual trade management and the risk management. When is the right time to hold the trade? When is it not? When is the right time to risk more? When is it not? And that is all based off of my clarity when it comes to the charts because I know how to read the charts. I don't need to read More of the charts. Like everything that I've taught you is everything
you need to know trading. I'm just repeating myself at this point, but it's how I am mentally when I'm going to go read these charts. Did I just go have a bad day at work? Did I just have go a great day at work? Am I just looking to make some profit because I I couldn't work this week? Or am I just looking to double up from the profits from last week? am I looking to catch like everything is how Am I as a person when I am actually going to do this trade management or
do this account flipper scale. So what I'm going to be breaking down for you guys right now is exactly how I took the hundred bucks into a mill successfully and unsuccessfully. The first time that I did it and then the second time that I did it. I'm going to break down the risk management behind every single one of these trades that I did. And you guys can go see this challenge for yourself. I think there's a 10, 12, 13 part series. It took me about 3 and 1/2 months, nearly 4 months when I actually completed
it. And I have a full series here on my YouTube channel. You guys can go ahead and go watch it if you'd like. But I'm going to summarize everything on this video right now. So, let me break it down for you guys. All right. So, I'm going to break down to you guys the exact math that I used to take the 100 bucks into the mail. Now, I'm going to Make this extremely clear right now. I am not a financial adviser. I'm not here giving you legal advice. I'm just letting you know how I did
this. And uh I had some great experiences at times and then some other times it was not so great. And my decision-m and my actual trade management is what led me to completing my challenge of taking a 100 bucks into a mill, right? But just want to make sure it's not financial advice. I trying To educate you guys on how I did it personally myself. So when people think or people hear of me taking a $100 into a mill, the first thing immediate red flag is like impossible. It is fake. It is not true. And
I'm going to be honest. I did not take a $100 into a million. That is actually impossible. And I am here saying this on the record. There is no humanly possible way that I took one singular $100 bill into a million. That is just not possible. But what I did do Is that I did take the $100 into about $400. And then I did take these $400 into about $3,200. And then I did end up taking these $3,200 into about $8,000. And then I know I was at break even with these $8,000 for roughly, let's
call it, two weeks. But then I took this $8,000 into about $15,000. Then I took these $15,000 from what I remember, I think it was around $30,000. After taking these 15 to 30,000. Then I know I lost it back to I think I think it was 17,000 more or less. Then I took these 17,000 all the way up to about 55 and then going from 55 everything was pretty much history, right? We go from 55 to about 100, 100 to 300 and then the 300 we just finish it off on a full live session. At
no point did I ever take one singular $100 bill to a million. What I ended up doing is I am constantly scaling and flipping this current Account balance to this, then this current account balance to then this, this to this, this to this, and then it just constantly is scaling to the next level where my end goal was to scale all the way to a million dollars. and me taking this account up to this one and then up to this one and then this like me taking this 400 bucks into 3200 taking this 3200 to
8,000 is with the exact strategy that I have just taught you in this video. There's just one Thing that led me do this successfully and that is going to be risk management. Risk management is what led me to be able to successfully scale this account and it's how I did it. So, I'm going to explain to you how I properly did it. And I'm going to be extremely blunt and I'm going to be extremely straightforward at this very point. I did this because at no giving point was this starting balance a significant amount of money
for me. I could have Lost the account from this point right here. And I did when we made it all the way to 333,000 I think or I think it was 308,000 or something like that. I ended up blowing this 308,000. It was what I had in the balance of my MetaTrader 5. Now, that is obviously a lot of money, right? Even at the point where I am now, I'm extreme. You know, I've made multiple seven figures in trading. I recognize that that's a lot of money. And so, that Could be life-changing to some people.
And some people might have maybe not actually gone all the way and they would have probably closed the accounts or, you know, called it there, right? They would have not made it all the way to a million. But the way that I looked at it is that I started off with a h 100 bucks. If I lose this $300,000, if I even lose a million dollar out of my own pocket, I'm only losing a h 100red bucks. So the starting balance to me is Not a significant amount of money. So I am able to have
a much more aggressive approach. And this is something that is extremely aggressive. This is something that I personally do not recommend for anybody to do. If you are a beginner, I recommend that you actually, you know, learn trading and then you start with a significant amount of money that does not mean something to you. So for the first trade, what I always always always Do is I always risk 100% of the position. So my first trade to me is simply the most important trade because you simply need to get out of the hole, right? you
need to fullport the account until you are not able to risk anymore. So, you don't even need to go to your position size calculator and pre-calculate your risk. If you have a $100 account and you want to buy or sell a market, for example, like the one that I'm in right now, you just simply go to Your MetaTrader 5, you click on lots and you just try and put the max possible lots that you can. Now, two things are going to happen. You're either going to blow the 100 bucks, how I've done tens of times,
or you're simply going to then scale your account to 400, 500, 300, whatever point where your trade actually hits your takerit. Now, once you get to this second point, now you're officially out of the hole. So, what you can decide to do at this point is either one, Withdraw your original balance, which is 100 bucks, and then you're basically just playing with the house money at this point, and you have no risk. So you should not have any care for what is going to happen from this point forward. The money is not yours until it's
not in your bank account. And if it's inside of this trading platform that is not your bank account, that money is technically not yours yet. So you need to treat this with a with a certain approach. I Personally myself on the next flip, I decide to go ahead and then risk 100%. Once again, after we then flip this second amount of money to around 3,200, here's where I'll decide to slow down a little bit and then put the brakes on. I'll either go from 60% to about 50% risk from this point forward because we're already
around 2 3 weeks ahead, right? Every single one of these account flips that you're seeing right here, these are weeks that are going by. And To me, 3 weeks is a lot of time. And I want to make sure that I'm not doing something that it's just going to be a waste of time, right? Because time is money at the end of the day. And if this were to be happening every day, sure, like, you know, it's it's a lot easier to move this percentage up and down. And I could have been even more aggressive.
But since at this point in the challenge, I'm already on the third week, I don't want to be a whole entire Month doing this challenge for me to just be overly aggressive and then potentially blow the account. That's why I start to minimize my risk. And all of this is by simply executing one single trade. I'm not taking five trades a week. I'm not taking three trades a week. I'm not taking I'm literally taking one single trade. what I'm doing and the best analogy I know I have a lot of analogies but the best analogy
that I can put to this is I am literally a Baseball player standing at home base and I'm getting pitched a ball every single minute and I'm just standing there on home base and I have endless amounts of pitches. The the pitcher is just a robot just going to keep throwing balls, keep throwing balls and I'm not obligated to swing at any point. I'm just there standing at home base waiting for that perfect pitch and I know that if I strike I'm out because I'm risking such a high percentage amount in the Account. So I
want to make sure if I am going to swing it is going to be a perfect pitch and I'm going to be ready for that perfect swing. Is there times where that perfect pitch has come and I'm simply tired of standing at home base and I don't swing? Yeah, of course. I will not swing until everything does not align because I know if I if I strike if I miss, I strike out and I'm done. I can't continue to play. So, or and in the trading term, you simply blow The account and you cannot continue
to trade this account. You have to deposit money again. So, my trade selection when it came to these trades was extremely precise. I would break down my 10 markets for the week and out of all the 10 markets that I had for the week, I would really, really only focus on three. And out of those three markets, I would just wait for that one. It had to be that perfect trade setup that gave me the exact entry signal that I need that I would be 100% confident that this trade is going to go in my
favor. And I would make sure that if I am 100% wrong on this position, I am totally okay with it. I am totally okay if I give my all on this swing that I strike out. Right? Because I've been extremely pat I've been extremely patient. I've seen a hundred different pitches come by. And have I missed out on some pitches and they could have been home runs? Sure. But you know what? I wasn't 100% Confident. And I am only taking that position when I am 100% confident. That decision making right there, that experience, that intuition,
that mindset is what led me to properly take the 100 into the mill. Or better said, it's what let me take the 100 into 400, the 400 into 3200, the 3200 into 8,000. Throughout this whole entire challenge that I did, I probably predicted 40 solid move setups. And I maybe only caught seven, eight, nine, 10 max. I'm Not here to catch every single move. I'm here to catch the right one. So after me taking the 3,200 into then 8,000 is where then I start to lower my risk even more. So here I started to go
anywhere from 50% to around 40%. And the same exact thing applies. I am only risking this on one single position. If I enter one trade for the week and I win, I am done. I don't need to execute another position. It's a one and done for the week. If I lose a position for the week, One and done. I am done for the week. I will come back next week because I know myself and I know how I react to the market. And if I am entering a position and I lose, I know myself and
I know that I'm going to want to chase that loss back and gain back more profits. Or if I were to win a trade, I know that I'm going to want to win more for the week. I want to end up more on top. So a simple rule on how I minimize that is I'm just simply a oneandone type of guy. Win or lose, I am done. because I know by the time that next week will come by, my mindset will be so much more clear that I won't even remember what happened last week. So
much time has gone by. Did I break this rule a couple times throughout the challenge? Yes. And if you guys go see the series, you guys are going to see how I hold myself accountable because I know that I have tens of thousands of people, hundreds of thousands of people, millions of people That were going to be watching this challenge. And nobody was going to hold myself accountable how I was. And I need to set that standard to whenever you do something wrong, you actually do something about it. Because us traders right now, I'm here
in my office and I can decide to click buy or sell on a position right now. Nobody's going to come and tell me that I'm doing the right or the wrong decision. It's only myself. Only myself is going to know if What I'm doing is right or wrong. And I need to have the mental clarity to understand on what I'm doing is right or wrong. If you're on a two, three week losing streak or on a two, three week winning streak and you're still a beginner intermediate trader, I can guarantee you you're going to you're
not going to have extreme clarity. You're going to feel like the king of the world. I've been there, believe me. And as an experienced trader now, and as I've aged, I think I've aged like fine wine in the trading space. And I understand the difference in between one and the other. And when you're in a challenge, when you're in a a series like this, all this stuff starts getting very murky. And if you don't set the foundations from the beginning, it's only going to end bad because you want to get to this end goal as
quick as possible. You don't want to go through four months of hell to get to this point Right here. What matters is how you set the rules before you begin. And these were my core base rules. After me taking it to about 15K, at this point right here, what I started to do is I started to stay from around 40% to then 35%. And then basically what I did from this point on is I stick through this same exact same risk management rule throughout the whole entire challenge. I never went below 35%. Maybe I went
to about 30% 27% depending on the the type Of trade, how long I predicting it was going to be or if I could have even actually traded. You know, I traveled a couple times throughout this challenge and I wanted to make sure that yes, it was the perfect swing and it was the perfect pitch, but it was just not worth missing out on. And I'm personally okay with risking a certain amount of the account. Sometimes it worked in my favor. Other times that it did. But the most important thing right here, and Believe me, I
I I cannot stress this enough is going to be this right here. this risk management and the decision makingaking behind the trade that you are analyzing. If you're going to enter a trade, make sure that it's the right trade. And then following throughout all of this, what led me to the true success is going to be this right here, RR, risk to reward. This is what made the difference from this turning from $100 into a million and that turning from a Hundred to a h 100,000. The difference was risk-to-reward. Why is that? Well, because some
positions I would go for a one to two risk-to-reward. Other positions I would go for a one to4 risk-to-reward. And this one to four risk-to-reward would take me out of the hole. Like you can't even imagine because let's say I'm trying to risk a hundred bucks and then the goal is to flip it. If I'm doing a one to two risk-to-reward, that's just times two, Right? I'm taking 100 bucks to 200 bucks, right? Nobody cares. Just 100% 200% no big deal. But if you apply this percentage going from 100 to 400, it's far more of
a strong base to then take the 400 to 3,200 for example. Because if I were just to have 200 bucks and then I just apply the same exact one to two risk-to-reward, it's taking 200 to then 400 bucks. So you just wasted a whole week trying to do what you could have done in one simple week by simply Continuing to either hold the position or have bigger take profits on the original trade that you're taking. So, I always attempted to have every single trade setup, always be a minimum of a one to two risk-to-reward. This
is always going to be the minimum of every single trade that I'm going to take. The minimum of the risk-to-reward has to be this because that is what's going to lead you to profitability. That is just a fact, right? But I would always aim For the trade to have a potential of a one to4 risk-to-reward because I'm essentially getting another trade for free. exactly what I would be doing right here. I'm literally getting it for free by just simply holding the trade to then get a 1 to4 risk-to-reward. For example, let's say I'm going to
be buying a position, right? I'm going to be buying this trade. This is the area where I'm going to be buying it. And the minimum I would always place my Risk-to-reward ratio is going to be a 1:2. This is the minimum. No matter no if, ends or buts. But I would always set the trade to have a minimum of a one to four. So if the trade gets to this one to four, I know for a fact that okay, you know what? Not only was it worth the trade to be at a one to two,
but it has the potential to be at a 1 to4, meaning I'm going to basically get a whole other trade that I am entering right here. It's like me entering two trades, but Without risking the second one. I'm literally getting this one to four risk-to-reward, which is two trades, by only risking what I would on one. That's where the money is because I didn't need to have additional risk to make more money. It's just the winning trade. I let it be a continuous winning trade. I didn't have to take another trade to make more money.
I didn't have to add risk into the account for me to make more money. I didn't have to overexpose Myself. I didn't have to swing again to catch a home run. All I would do is just let that ball continue going. Obviously, in the baseball term, can't really control where the ball went, but let's just pretend like you can decide when you want to let off of of the bat, right? I would just continue to hold on to the bat because the ball's going to continue to go. So, this is what literally changed the game
for me. Having the trades go further from the Takerit than what they already were because what this would do is that I didn't have to do anything else other than set and forget. And that is what gave me clarity because I didn't have to be stressed about entering another trade. That is what literally made my job so easy because I just simply did nothing. That also gave me confidence on the next trade because if I do the exact same setup and obviously minimum of a 1 to2 risk-to-reward always but with a Potential to be a
1 to4 that gave me the confidence on the next position to do the exact same thing. And when you compound all of these positives on a trade over the course of three months, you're going to have a perfect equation for success. It's just the simple truth and you're following a proper strategy. The odds of you failing are very low. It's very unlikely. If you're taking one simple trade setup a week and it meets every single confluence and you have a Minimum of a 1 to2 risk-to-reward and you have a potential for it to be at
a 1 to4, why shouldn't you succeed? You're following every single possible need for the trade to make sense. Now, this is the core foundation of what I did to actually take the hundred bucks into 400 and 400 into 3200. hate saying that I took a hundred into a million because to be technical and to be real, I technically took $300,000 into a million, but the starting balance was Hundred bucks, right? But not to get too technical, I want to literally show you guys how I did this. So, what I'm going to be showing you guys
right now are literal live footages that you guys can go check out right now in the YouTube channel, but I'm going to put it in this video here of me literally showing you guys the before, the during, the after, and the explanation of every single trade, why I was interested in entering the trade, my thought process on Entering the trade based off of where I was in the week, and if I had just won, if I had slept, if I had not slept, because that all influenced greatly into my decision- making of the trade and
the end results of the trade, if I ended up winning and how I reacted, if I ended up losing and how I reacted. Because my decision making throughout this challenge is what led me to succeed and to do this. Now, I've had tens of students that have successfully taken a Couple thousand bucks into a couple hundred,000. We have students that have taken $15 into 304,000. And when I've done podcasts and interviews with them and I've met them in person and they're inside the community and we chat, they literally tell me, "Alex, the strategy is amazing
and your teaching obviously let me understand the market." But it's how I reacted to the market when I got these opportunities that presented themselves that led me do this Successfully. And I want to show you how my mindset and my approach changed throughout the whole entire challenge as a person, as a trader, as a mentor because I personally feel that challenge made me the mentor and the person that I am today because I went to I went through a certain experience. I went through a certain battle that nobody could have taught me. There's no type
of trading in the market that could have taught me that other than me going Through that myself. And nobody could have told me what I was going to go through. I had to literally go through it because it was a immaculate it was just it was just an immaculate experience that led me to understand that at no given point am I in control. The market's always in control and I have to understand when to be involved and when to not. So what I'm going to be showing you right now once again is the real raw
journey of the challenge. Pay Attention to the types of trades that I am taking because I literally explain everything that I have just taught you inside of this video. Trend, area of interest, and market structure. That is what's going to lead you to be able to make a decision if a trade is good to take or not. So, let's get into it right now. All right, guys. Good morning. It is currently July 16th, Tuesday morning. So, obviously, we stayed up last night about like 3 in the morningish. I stayed Up to catch this trade and
it was for no reason. We are currently in the position and this is literally the max that I can honestly risk on the account. So last night, remember that I explained to you guys that I was waiting for the market to have a body closure under this line right here. So we had that body engulfing candlestick and then I pretty much entered on the little quick pullback of the next one. And now that was for no reason because all of London Session as soon as I fell asleep literally did nothing. But the point is that
now price is pulling back into the area where we entered. Usually what should happen is that as soon as we enter the trade, it just goes down with the momentum of the session. Well, now we haven't. But it is what it is. Enter the trade. Set and forget. My prediction is that now from here it is going to go down. And as soon as I take the first position, obviously you have to risk 100% of the account to even get out of that hole. And I remember that I was in draw down as soon as
I took the trade. I'm like, ah, here we go. Starting off bad. And I think we were in draw down about 35 bucks right at the start. So then there it's either going to completely blow the account or skyrocket me out of it so I can give me the badness that I need to then take on the next week and follow the goal that I have for every single week. >> So I got it 1 minute ago positive $15. Now we are about to hit margin call on the account 1 minute later. But trading is
so funny. Oh my god. >> But like always when the trade went into draw down I wasn't going to panic. I set and forget because worst case that can happen. I just blow 100 bucks and I start right again. And guess what happened? Trade hit take profit. >> Ladies and gentlemen, I'm sorry to announce that We have reached the goal for the week actively right now. We are currently up $330. You guys can see here. Last night, literally what I said happened once again. So look, check it out. GBP JPY right after that 1 hour
bearish engulfing candlestick. Literally the whole momentum throughout London session was that bearish move to the downside had my takerit set at a 1 2 3.4 risk-to-reward. So meaning if I risked 100 bucks here then I would have made $340 right here. As you guys can see that is literally the math that is happening right now. candlestick is going to close in 15 minutes over here. So, I want to see how this candlestick closes right here in 15 minutes. And then based off of that, I'll then make my decision. And let's see if we can then
this week flip this $450 to then $800 or $900 because that would put us really, really, really Fast into the margin that we need to be in order for us to flip the $100 to the mail a lot faster. It's currently 2:30 in the afternoon. Pretty much we closed at $437 in profit. You guys can see here the my effect book pretty much how it's looking currently of $437. These are pretty much the fees we got to pay. These are the orders. Well, there's nothing open right now. This is the history though. You guys can
see here both positions that we Ended up taking. That's the profit that we closed in. And now, same [ __ ] Gym time. You know, it sucks. So, you only get to drive one supercar now. Lamborghini twin turbo just sold it. Ybody is at the shop. The rear brake caliper is broken. They're fixing it. The Porsche, I blew the second gear on the Porsche drifting. Uh Rolls-Royce is finally getting them wrapped. Should be done today or tomorrow. What other car do I have? The Maybag. I'm not going to Drive. Oh, yeah. Oh, I sold the
Scat Pack. Got rid of the Scat Pack. Scat Pack is gone. That was probably the dumbest thing I ever bought. Yeah, the side by side. >> The side by side is in the shop as well, >> bro. Half of my fleet right now is in the shop. I only get to drive a Ferrari right now. [ __ ] We were up 430 bucks, I think. And we hit the goal not only for week one, but for week two. Meaning that I didn't have to execute a trade next Week or the week after because this one
trade because we set and forget and we caught a 1 to three risk-to-reward, we outdid the profit that we were even anticipating for this very same week just to get started. So, we were off to a very good start right at the beginning. So, since the week was off to a good start, I pretty much came to the executive decision that, you know what, we hit the goal, not only for this week, but for next week. We're done for the Week. Let's not get greedy. Let's not chase any trades. Let's just set and forget for
the rest of the week. And next week, we'll come back with new fresh market, new fresh mindset, and then we'll pick up on the goal, which is going to be then taking $400 to about $900. So, then that's exactly what we did. We did not take any other opportunities, and then the next week, we started off fresh with a new goal. And if we were to hit it, we're then Ahead three weeks in the challenge, which is absolutely beautiful. >> It's week two of me trying to turn a $100 into a million day trade. >>
So, like always, we started off the week on Sunday swings, analyzing the top two, top three markets that we're going to be trading for the week. And we found some solid markets where it can probably even more double the account. >> Account is still on $437. We got, I think, seven solid markets in The markets. Seven solid markets in the markets. A lot of markets. A lot of [ __ ] money. USD JPY. So USD JPY has a very clean left head kind of right shoulder action going around here. We broke the neckline. Now we
are retesting the neckline of the head and shoulders along with the 1 hour EMA. 4hour time frame looks absolutely phenomenal. We're having a beautiful 1 hour bearish engulfing candlestick. Looks like we're having that pullback to retest that Previous structure level. And then the daily time frame does not get any cleaner than this daily previous structure level. daily EMA. And then you guys can look left. It is obviously a level of resistance whenever we're under a level of resistance whenever we're under. And this line right here, what is it? You may be asking a round psychological
level 157,500 or like the smart money concept guys would call it an order block. Potato potato. This is a Round psychological level with an area of interest. So this trade is my number one trade that I'm going to be interested in taking this week. All I'm really waiting for on this market. So earlier this week, what I was waiting for was this break. So that break already happened and now this pullback is actively happening. So I just got to wait for price to go back into this area so I can actually enter this trade. We
took the trade which was on USD JPY I Believe. >> Yo yo. >> Oh, [ __ ] with me. Huh? [ __ ] with me. Literally USD JPY as simple and as effective as it is. Look at this [ __ ] We literally had the retest perfectly to the area of interest. The marabuzu tweezer top rejection bearish engulfing candlestick. I keep telling you, you need an engulfing candlestick to enter a Sell or a bullish engulfing to enter a buy. I'm laughing cuz the mic is moving. So, the point is that we're in this trade right
now. Literally, we already at $550. If this [ __ ] hits that take profit, we'll probably be at like two threek. It will probably even break the goal for the week that we've been anticipating. So, for now, just gonna set forget. But it was taking a little bit long. So, I'm not going to sit in Front of the computer all day and basically do nothing. I just exactly what I said at the beginning of the challenge. I'm going to go play basketball. I'm going to go hit the gym. I'm going to go live my normal
life so it doesn't affect my psychology and I can always have a fresh mindset when I'm actually going to execute a trade. and I treat the markets one thing and then my life, my personal life is a completely other thing. >> You can either literally make us or break us. It is currently 8:00 p.m. Miami time. So, I think it's like about 2 hours or an hour and a half from the last time I updated you guys. And set and forget. Now, what we're going to go do is pick up Jordan. And for those of
you guys that don't know who Jordan is, he's actually one of my top students where about 6 years ago, he was actually working at aviation in a place like this, but he wasn't flying the Airplanes, he was fixing them. He was a mechanic fixing the planes that were broken down, probably making 50 60k a year. And he didn't want to live that life. He wanted to have a obviously successful life. And because of the set and forget strategy, he managed to not only get out of his job, but make trading his main source of income
in just under two years, which is absolutely legendary. And over time, we become really, really close friends. So Jordan obviously, you know, is battling cancer and stuff, and his legs get really, really swollen and I have a cold plunge. So cold water helps with inflammation. We're going to put him inside the cold plunge in about like 20 30 minutes. So, we're going to pick him up now and show you guys the whole drink. All right, so this is Jordan. We're going to take him out to the cold plunge. It's going to suck, bro. >> It's
going to suck. >> It's cold, right? >> Cold plunge, >> dude. It's going to [ __ ] suck. But I'm telling you, you're going to get on, you're going to feel [ __ ] amazing. So, you know, we would pick him up, take him to the cold plunge, and then drop him back off. He actually gave me some Mike Tyson signed gloves, which is super sick because, you know, Mike Tyson's a legend. >> I told you I got something. It just came A little late. >> Oh [ __ ] Oh [ __ ] No way.
Signed by the boy. >> For me, it's a representation of Jordan because he's a fighter fighting through what he's doing. And obviously, Mike Tyson is one of the most legendary fighters. So, it's actually pretty cool to have boxing gloves signed directly from him. All right, guys. So, trade update. We just left the gym right now. Trade update. It's currently 12:30 in the afternoon. So, like I mentioned earlier, if that daily candlestick closes under that previous structure level, we're pretty much going to set and forget this [ __ ] for a very long time. 4 hours
looking good. We are now currently up about $1,200 on the account. So, going to continue to set and forget. I think I was already about like $1,200, $1,300 bucks. And I had a decision to make. I can either close There and hit my takeprofit for the week or I can logically look at the markets and realize that my analysis and my strategy is indicating to me that this trade is going to have a much higher risk-to-reward ratio. So, what would I do? The whole reason of me entering a trade is to capitalize the most I
can from the gains. All right, guys. Trade update. It is currently 317 in the afternoon and we are up about,600 on the trade. And you guys can see here That the market is about to close. Well, you guys can see that the market is about to close in 2 hours. So, this daily candlestick will close about an hour 42 minutes and it's honestly going a lot faster than I anticipated and we're definitely going to close under that previous structure level. This is why you set and forget your take profit. You never put a takerit. You
always put a stop loss to minimize your losses. You never put a takerit. You never want to Minimize your losses. So, this trade, we just continue to hold and set and forget. And this is where I'm preaching to all of my students. I'm actively monitoring the markets, seeing how much more can we continue to go in one direction because I'm a protrend trader. I trade with all the time frames in my favor. So the trade continues to go in that direction on the long run. You want to trade with the trend. The trend is your
friend. So in here is where I Continue to set and forget and analyze the markets. And the trade went from a,000 in profit to 2,000. >> Currently have about $1600 on the account. So we're up $2,000 to 3,000. God damn. >> Wow, bro. Wow. >> How long did it take you last year to do this? >> This is probably almost a month last year. That shows you how much better of a trader I've become. I'm so much less Attached to the profits and of the money behind this, bro. That's crazy, dude. And keep in mind,
goal for the week was 900. So, if I close at this point, I'm ahead by six weeks in the challenge, cutting the end goal of training the 100 into the million to then maybe in two months. So, at this point, I'm [ __ ] hyped. So, then as we're like halfway through the week, I'm basically living my normal life, drifting, um going out to the gym, just doing whatever I got to Do. I realize that, you know what, 3K more than enough. I can see the trade that it can potentially have a reversal because the
structure is starting to shift. So, I closed my profits there. >> You guys can see right here that the account is at officially $3,000. You guys can see here on the my effects book pretty much uh where we started the account with the current balance. This updated two days ago. You guys can see here the history. These are all the Trades that we have taken. Obviously, two trades on GP JPY, one trade on USD JPY. And I did not take any more trades for the week on week two because I'm well past the profit that
I need. There's no reason on me to go chase and add new trades. So, I simply set and forget and then we pulled up to the next week where then the goal was to take 3K to 6K. Last week, we turned $437 into $3,000. Same thing as always, getting on Sunday swings, analyzing the Markets with my students, finding the top two, top three markets that I'm going to be trading with that very week. Then my goal is to take 3K to 6K. And at this point in the challenge where I'm at 3K, I no longer
have to risk 100% of the account cuz one, I'm already ahead by 4 weeks. And my goal once I get to about 3 to 5K is to minimize my risk on the account to about 50 to 75%. Meaning if I take a losing trade, I don't start back at zero. At least I still have some Ammunition to then kick back and get started right where I was for the profit that I should be for that week. So in my mindset, technically, yes, I did lose some time, but I lost time that I gained, not time
that I where I should actually be in the challenge. So for example, let's say I took a loss on the 3K account and I'm go back to the 900. Well, it's technically where I'm supposed to actually be for the challenge for that week. So, it gives me The freedom to be able to actually do that because I'm so ahead in the challenge. >> All right, guys. So, market update. It is currently 9:49 in the morning. We are officially in the trade. So, I literally entered. Let me before that, let me show you guys the time,
right? So, what time is it right now in Miami? I come over here. I refresh the website. 9:49 in the morning. So, literally to show you guys, we just entered the trade. So, look, Pull up here. So, you guys remember how I literally just mentioned that we were going to have a pull back into this level to then sell. So, we literally had that pull back perfectly. I went exactly to where I didn't go exactly to where I anticipated, but got really close. I entered it. And just to show you guys proof, I was just
recording for Instagram right now. As soon as we enter the trade, we're literally like using margin and [ __ ] because we entered the Trade pretty much risked everything. So, I just wanted to show you guys that. But now, we're officially in the trade. We are up $400 on it currently right now. Like always, have to show you guys that it is a real account. So you guys can see right here that it is indeed a real account. You guys can see where the account is currently sitting and we're currently now going to just wait.
But I explained to you guys perfectly this. I explained to you guys the break and Retest here. I entered at this next retest where we should have waited for it here. We should have waited for the break and retest here to then sell. But then this didn't happen here. But it did happen here. We then entered after the engulfing which ideally we should be entering up here. So then on week three, we started off with a new trade that we took and we pretty much went straight into draw down about 50% draw down in the
account, which is totally fine. I'm Okay with it. I don't mind the swings. But I continued to set and forget and then the trade and the trend ended up going in the favor where I ended up analyzing and then the trade actually went back into profit. We're about 5,000 floating in profit. Keep in mind, my goal for the week is actually 6,000. And like always, I'm updating my Telegram, Discord, Instagram, every like I'm mass social media blasting these trades everywhere. So, I'm not the only person That's in profit or in loss. Like, there's hundreds of
thousands of traders all around the world looking at the same market that I am. People in Africa, people in London, people in the States going through the same journey that I'm going through because if I'm making money, you're making money. But if I'm losing money, you're losing money, too. And I always have this belief that in order for you to receive, you have to give. So, I'm at this point in the Challenge where I need to receive, right? I got to make back some of these profits. I'm like, you know what? Let me give my
boy Sensei a little gift. A M Blanc pen. One of 10 in the world. So this is a very special edition watch. So this is a Muhammad Ali M Blanc watch. So you see it has like Ali through here. >> And then you see the Muhammad Ali everywhere throughout here. You see the Muhammad Ali everywhere throughout here. >> Pen was like $3,000. I don't even think This guy appreciated that [ __ ] But you know what? I don't care because when I go look at my trade that same night, we were up about $9,000 on
the account. >> So, right now, we are currently floating about $6,000 in profit. The account is currently at $9,000 in equity. And you guys can see this trade right here is literally continuing the momentum to the downside. Just continuing this set and forget trend. That's why you got to trade with the trend. The trend is your Friend. So you guys can see the 4 hour close very strong. I am going to just continue to hold this trade. Uh if tomorrow closes under this line right here, not this one. I'm just copy and pasting. If the
candlestick closes under this line right there, we will probably turn this into over $15,000 easily. So let's wait for now. Simply just set and forget. So, if you want to receive something, first you got to Give. And I actually put this to test later throughout the journey and it came back 10 times more. So, a little bit more on that later in the journey. And then the usual happened every single time. You set and forget. The trade ended up going to 15,000 [ __ ] dollars. 15,500. So, exactly what I was mentioning to you guys
earlier. I have to see like you can't just close a trade right away, right? Cuz you got to look. So, Obviously, we're going to close a trade because we wanted it to close under this line. Well, under this right here and actively looks like we are piercing through that. So, this candlestick closes in the next five minutes as you can see right over here. And if this candlestick closes under this line, it will mean that it closes under this structure point. And then there, I truly do believe that it could then easily go from here
to then this point right here. So, right now, we literally got to wait the next 5 minutes. If it closes above like that, I'm going to close it right then and there. If not, I'll squeeze it in for the little bit extra right here. And just to show you guys, we're up about 15,100 right now. [ __ ] bro. Trey started reversing on me, dude. Look at this, bro. [ __ ] Trey started reversing. We were up like 15,000 here and now, bro. Like I said, I forget too much, bro. It's like we closed the
trade like 2 hours ago. So, right now, it's currently 12:30 in the afternoon. Right here, you guys can see where the account is. It's officially closed at $15,000. You guys can see right here in the history. So, you guys can see that we officially closed this trade at $12,200 in profit. So, we closed it earlier, literally as soon as I told you guys, pretty much after it closed that line. So, it did make it all the way up to this structure point and then it had a reaction. So, pretty much exactly what I explained, it's
going to have a reaction from that structure point right here. And if we follow this line, it's exactly what it did. So, our entry points are as precise as they get. Our stop losses, our takerit, everything with the seven figure strategy, [ __ ] sniper. Yo, the goal for the week was 6 grand. We are at $15,000. So, if we were to close at 6 grand this week, the goal for next week was to turn 6 to 12. So, we just did this week and next week's goal. Oh, [ __ ] We should go on
a vacation. We're ahead of schedule. >> We should just [ __ ] off for 2 weeks, right? >> Keep in mind, I'm looking at the numbers on the screen because you guys like to see it. I hate looking at the Metatrader and the money go up and down. I hate it. It [ __ ] with your mind. I only like looking at the charts because what happens in the charts directly correlates with what's happening on the numbers. What happens on the numbers does not mean that that affects the charts. The charts affects the numbers. I
only like looking at the charts because I can make a logical decision based off of the price action. I can't make a logical decision based off of me being up 5,000 or 6,000. What connection Does that have to the charts? Zero. So, I started implementing that and educating people on it. And they everybody kind of had like a oh, an aha moment. They're like, oh, you know what? That does make sense. I should only look at the charts and not the numbers because if you focus on the structure, the structure is going to equal the
money. This is like the prime where I was in the challenge in terms of ahead. Like I had so much time ahead of what I Anticipated to have that I felt like the king of the world at this point. So we ended off week three closing at about $15,000 in profit where then the goal for next week was to then take the 15k to then 30k. It's week four of me turning $100 into a million. Last week we were trying to turn $3,000 up to $6,000. Now the next week actually started off kind of slow.
No trades towards the beginning of the week. So, we kind of just had fun. Jim, drift. Uh, I think I bought a dope art piece from Atlanta. Atlanta just pulled up. So, Atlanta just did a collab with Trump where he pulled up. He actually signed one of the paintings that he did. I actually have a bunch of Atlanta paint throughout my entire house. But, I just got two new posters. Going to give one to one of my family members are all about Trump and I want to put one on the wall. I think this is
a legendary ass picture and then Arana did itself. Let's Go check it out. >> Oh [ __ ] So, this came in a frame with everything. >> Yeah. You got the first two. Literally the first two. >> Okay. >> So that's that's basically where he signed it on the on the original one. >> Yeah. But this that's my signature. >> Oh, okay. So yeah, but he said like somewhere. >> Exactly. Yeah. >> Okay. Oh, wait. So this is one out of 47. >> Yeah. One and that's two >> and two out of 47. >> Oh
[ __ ] So I got the real >> appreciate you, bro. This is lit. So, for people that don't know, I was the first person that trusted our lander to paint a Lamborghin. It's crazy. >> He hit me up. He was like, "Yo, I'm going to do art basel." What was that? 2020 >> 2022. >> 2022. >> So, yo, I want I want to paint your Lambo and Art Basel. And I'm like, dog, I don't know. Sounds a little crazy. I'm like, you know what? [ __ ] it. Let's do two Lambo. So, we did
my hood and it was Sensei's whole entire. >> Mhm. >> Then we did the rolls. >> The Dawn. >> Oh, yeah. That's right. the D. >> Look, I you know I have this painting. >> Oh, the Kobe. >> Yeah. >> Damn. I haven't seen this one minute. >> Yeah. Yeah. Jordan gifted me this one. >> Yeah, I remember that. >> But then the unexpected happened. Well, kind of expected because I started getting bored in the challenge. I'm so ahead. I feel like Superman. I'm winning every trade. I'm ahead by four or five Weeks. I feel
like I can take any trade. So, the market wasn't giving me protrend trades, meaning having markets that have every single time frame in the favor to trade with and there was just nothing available that checked out everything in my trading plan. I had to do something degenerate, take trades that I shouldn't be taking. All right, guys. Market update. So, I spent the morning kind of just focusing, locking in, diving on this trade to see if I was making the Right decision because we have officially taken the most degenerate trade of the whole entire [ __
] challenge. The biggest counter trend trade. It's such a den trade that I did not risk 100%. I risked 20% on this trade. So, to show you guys currently market update and we are negative about $500 cuz we literally just entered the trade as the candlestick just closed right now. So yesterday on EuroUSD, I'm sure you guys can remember that I was Anticipating for price to have a sell from this point up here to then reject and then for price to actually make it all the way down here to then have the actual buy on
EuroUSD because we're anticipating for Euro USD to make it all the way down here, reject this level, and then head to the upside. Since we broke out, we never retested it. So we're expecting for that retest. And here on the 1 hour you can very very clearly see that we are creating a Potential left head right shoulder. Again it's not a confirmed right shoulder and so we don't break under this neckline but I believe what it's creating right here it's such a strong level of accumulation looks like a 1 hour double top 30 minute time
frame. I see it I almost see it like squeezing into this inwards uh triangle whatever you want to call this. Again, I hate trend lines and I hate all this stuff cuz they're very subjective, but you can Literally see how price is squeezing into this area. And I personally believe it's going to have more of a reason to burst down than burst up. I could be completely wrong because I don't believe that this area that is rejecting from right now is going to be the area to continue pushing to the upside. I think such a
strong move like this has to have a deeper retracement before actually heading to the upside. So when I go down to the 4our, this 4hour candlestick Still has about 3 hours to close and the last one closes a very indecisive candle. I think this next one can engulf close under this which then on the 1 hour, it'll give us the break under this neckline of the head and shoulders. If you notice, I put my stop loss a little bit right above this level because if we pretty much break above this, the trade is just going
to keep going to the upside. >> Oh, that that doesn't seem very good. >> I'm not good. I mean, I called it, you know, I don't really care. Um, I'm glad that I ended up getting that out of my system. I'm a [ __ ] idiot, bro. Like, I mean, technically, we're still in the trade, right? So, it could clearly reject this level right here, so it can literally have the same reaction to the downside and then this same reaction to the downside. That's why I'm very strategic with my stop-loss placement. But, the Trade that
I should be taking is at the break and retest from the neckline of the head and shoulders. Like, I know this. I I know this, you know, I just decided to want to get involved. But, I'm not mad. doesn't really set us back much in the challenge. There's an unnecessary loss. Well, not a loss yet, but it's just a trade update. So, it's just like an hour later from the last time that we took the trade. So, yeah. Now, we just got to wait. And this Is what a lot of you guys do. A lot
of you guys do this. A lot of you guys will take trades that you shouldn't be taking, but you guys won't put the blame on yourself or hold yourself accountable. I know exactly what I did. I did the wrong thing. Now, do I accept it? 100%. You guys, when you do the wrong things, you don't accept it. You're ready to put the blame on the on someone's strategy, on the markets, on anything but yourself. That's what once You start having that self-recognition is once you start developing a nonchalant character for trading in the markets. And
that's how you truly become successful because you realize that your success, whatever the outcome is, successful or not, is 100% because of you, not because of another outsource. Like I'm the one that clicked the sell button. The phone didn't click it just for me, you know? So, for now, set up for I can't do this one. >> Yo, that's a sign that we shouldn't. We took the first [ __ ] loss in the 100 to the middle count. >> [ __ ] man. And uh yeah, first loss in the challenge and I said, you know
what, this loss isn't because of my strategy. My strategy works. There was just no opportunities that week that align with my strategy. I decided to be a slick ass, wanted to be smart, and take trades that I shouldn't because I was bored, Because I felt like I was Superman. And this is the week where I decided to implement a punishment. every single time I break my trading plan, I then have to do something in order so I hold myself accountable because again, there's hundreds of thousands of people watching these videos, uh, following all the trades,
making money with me, losing money with me. And I don't mind losing money if I am following my trading plan. But if I'm breaking my trading plan, I Do mind losing money because I shouldn't not be doing that. I should only lose money when I follow my trading plan. So whenever I don't follow my trading plan, there has to be a punishment. And that's where the beetle came in. I have owned Lamborghinis, Ferraris, Porsches, Rolls-Royces, >> McLaren, >> McLar bro, McLaren. How can I forget about that? But this right here is going To put the
biggest smile on my face. Biggest. Don't show them just yet. This right here is my new masterpiece. Yes, bro. Perfect. Perfect. Oh, yeah. We're getting a haircut on Thursday night instead of tomorrow. We always get a haircut Friday morning. We're getting one tonight cuz Eric is not available. [Music] >> What the [ __ ] is that? What do you mean, bro? What is that [ __ ] My new part. You don't like it? That's fake. That's fake. Just park up. Park up. [Music] Let me Let me explain to you guys the real moral behind this
car right here. So, this is so I follow my trading plan and my trading rules. Obviously, I have A [ __ ] ton of cool cars, but this is going to humble me every single time I break my trading plan. This week, I have broken my trading plan twice. Meaning every single time I break my trading plan, I cannot drive any of my cars for 24 hours. The only car that I can drive is this for 24 hours. So what is that going to incentivize me to do? To not break my trading plan. Every single
time I break my trading plan, I have to drive this for 24 hours. That's just the price And the consequence that I have to pay. What do you think? >> You [ __ ] stuff. >> And it's manual. >> It is. >> Yeah, it's four. It's four-speed. Wait, you going to drift it? That's just 1966. Oh, wait. Sense is here. >> Give me a >> You don't like it? >> No. >> Sorry. >> Give me a Yeah. Yeah. Yeah. You like it? [Laughter] >> We're going to be blessed if we get a [ __ ]
whiff of air in that. >> No air. Oh [ __ ] That's Oh [ __ ] >> All right. All right. All right. All right. Oh, we out. Oh, dude. It's not that bad at all. Oh, this is fantastic. Oh >> yo, it barely has >> Oh my god. >> Oh, it has no brakes. >> That thing is leaning, boy. >> Is it leaking? >> No. Leaning. Leaning. >> Leaning what way? >> Like this? >> Really? >> Hey, follow your training plan. If not, You're going to be like me. >> Oh [ __ ] Oh
[ __ ] [Music] >> [ __ ] beetle. And I leave so much by example that I went to go do some student podcast with students that have made over $100,000 with my strategy. And instead of me pulling up in a super car and taking them for a cool journey as I normally do, I pulled up in the Beetle. Even the students were making fun of me Cuz they expect for me to pull up and show them the lifestyle. And I showed them the real lifestyle. I broke my trading plans and now I'm driving this
piece of [ __ ] And I wanted to show it as an example to them. Like, yeah, all right, cool. My student made 100,000, but buddy, I want to let you know you need to have something to hold you accountable how I am right now. because if you don't, you're going to probably end up driving a car like this. So That's why I led by example and to showed the students live in person that they need to continue to follow the training plan to be successful. The moment they don't, they're going to end up in
a car like that. It's kind of a funny way to look at it, but it's the reality of the situation. This is where the humbling begins. You guys know how much I love driving my Porsche GT3 and driving it like a man and driving my Ferrari and driving it like a man. But man's got to do what a man's got to do, and a man's got to pay the price. And I'm doing this to show you guys that I'm holding myself accountable for breaking my rules. And as you guys can tell, I've already attempted to
drive this vehicle. And uh today starts the 24-hour clock where I will only drive the Beetle. What name should we give the Beetle? Keep in mind, it's a 1966 Volkswagen Beetle. It has the original engine, four-speed transmission. I tried turning it on earlier. It did not work. We're going to try again right now. So, this is to show you guys that I'm going back to my roots of me literally having to hold myself accountable when I do something wrong. I don't want to do this. But if I don't follow my trading plan, I will no
longer be able to drive a [ __ ] Ferrari or a Porsche. I'm going to probably be driving some [ __ ] like this. So, I'm going to keep following my trading plan So I don't end up in a [ __ ] car like this. Please turn on [Music] What name should we give it? Should it be a he? Should it be a her? Come on. Come on. Work my way up. Watch. You guys know about this. What profitable trader knows how to do this? [Music] [Music] Heat. Heat. [Music] All right. Yeah, we only got
space for two. >> Oh. Oh, >> yeah. Let's just push it. Let's push it. So, we ended off on week four with the first loss that we had in the whole entire challenge. So, this was a big uppercut to my ego because to this point, I felt invincible. I literally felt like I could do anything. I could win every single trade. It's week five Of me trying to turn $100 into a million day trading. Last week, we ended up taking two unnecessary losses because I broke my trading plan. So, we started off the challenge with
about 8,000, which is where we left off last week because we took the account from 15 to 8,000. So, at this point in the challenge, I am not scared to execute a position. I'm being a little bit more selective. So, I actually avoided some wins that I could have taken, but I also Avoided a couple of losses that I could have taken. And funny enough, because some of my friends were actually calling me in the middle of the week saying, "Hey, you're going to get enter this and enter this." I'm like, "No, dude. Trust me,
I'm not going to enter these counter trend trades. I don't want to drive to [ __ ] beat him. My god, what the [ __ ] Oh, wow. I just saw this right now. So, NZDUSD. I'm actually laughing because one of my Friends called me earlier. He's like, "Yo, what should I do with NZDUSD? I entered earlier this week, Sunday night, when you sent it out on Sundays." This is one of my friends that I went to high school with. Literally, one of the only close friends that I have outside of, you know, my my
team. And he told me, he's like, "Yo, should I close NZDUSD or do I hold?" I'm like, "Dude, if you hold it can have the risk of having a pullback. I don't think you should hold. I think you should close." He's like, "No, no, no, no. I'm going to set and forget." I'm like, "Brother, you have to know when to set and forget and when to not set and forget. This is not the time you don't want to like not close this trade." And I'm laughing cuz I know he is. I don't I'm going to
call him. I'm going call him. Yeah. So I'm that friend that I'll call you a 100 times. I don't give a [ __ ] >> Yo. >> Yo, you're sleeping >> about to >> Have you seen your trade? >> Yeah. [ __ ] you, >> bro. >> [ __ ] me. I told you, bro. >> You told me to have a pullback, not a whole [ __ ] move straight down. >> This what I told you, bro. I told you it was going to have a pullback, bro. You don't [ __ ] listen to me,
dog. What do you think? >> You told me set and forget. >> No, no, no, no, no, no, no, no. I told you don't set and forget this trade. It's going to have a pullback. You didn't listen to me, bro. Yo, I didn't I literally told you, bro. I'm like, yo, it's going to it's going to have the pullback. So, week five, we actually did not end up taking any trades at all. We did a lot of action stuff. I went to go look at a new penthouse that I was looking to move into. the
Bugatti that I Bought, my pink Bugatti. We got delivery of it with Jane Juice, which is another successful student of mine from the 30-day boot camp. >> So, I bought a new car. So, you Yeah. You don't know what car, right? >> You don't? >> No. >> All right. You're about to know in a little bit. >> So, I was going to say something and say some words of courage, but all I have to Say is set and forget. That's all I got to say. >> You think, bro? >> I have no words to say,
honestly. And it's >> You're the only one that knows, bro. >> No, no, no. I I I'm speechless. Honestly, I'm not going to say anything. I I'll I'll I'll leave it for you guys to see it. >> Well, he has made over a4 million dollars in trading in under 6 months. He Got into my first boot camp at the beginning of the year and then later throughout 6 months after applying everything he learned in the strategy, he made more than a quart million dollars. I find out I'm like, "Dude, pull up to Miami. Let's do
a podcast." You know, I like to show traders that if they apply the strategy and they do everything the right way, the lifestyle that they want is just couple moves away, all you have to do is execute the Strategy correctly. So later throughout the week, just more day-to-day action in my life, and we did not take any trades. So keep in mind, the week before this, we ended up taking our first loss. Then the week after this, which is week five, we ended up taking no trades, which kind of made me feel a little bit
not like Superman anymore because at the beginning of the challenge, I felt invincible. Now this times, I'm getting a little bit more humbled. I'm being Very selective on the type of trades that I'm taking because obviously I don't want to blow the account now. I'm so ahead. I have so much time in front of me that I want to be on track to complete the challenge. It's week six of me turning $100 into a million. And let me tell you, you guys aren't ready for this week. Then we started off week six at same exact
balance. The only difference now is that we have a Bugatti in the front of the driveway. >> Now we got views of my [ __ ] Bugatti. So if I don't complete this challenge, I can't afford the Bugatti. So I definitely have to complete the challenge and stay on route. So the goal doesn't feel right. Right. The Bugatti's pink. I'm wearing blue. I'll be right back. Give me a second. More like it, huh? Got to be on the same vibe as a I cannot believe I [ __ ] did that. Dude, still surreal. >> What's
the payment on one of those? >> My payment is 46,000 a month and then the insurance is like 2500. So, it comes out to like 4849,000 every month. So, yeah, we got a lot of work to do to make that up. >> And to start off the week, like always, we do the Sunday swings. picked the top two, top three markets for the week ahead. But I decided to go look at my track record on the trades that I'm Taking in the account to look at the stats, like what am I doing right, what am
I doing wrong, so I can learn from it and double down on what I'm doing right and fix what I'm doing wrong. Currently, we have taken the 100 bucks to $8,000. You guys can see that the starting balance was 100 bucks and it was just updated 44 minutes ago. down below over here. You can currently see our win rate is currently a 70% of the total amount of trades that we have taken. We've Taken a total of seven amount of trades and 100% of our trades have been short. So, we have not taken any long
positions and our average duration is an interesting 20 hours. Now, this right here is going to be a problem very soon, the commissions that we have on the account because the bigger obviously we start scaling on this challenge. The more slippage, the more commission everything that we're it's going to cost us to trade. So, I might be switching Brokers very very soon. Not entirely sure just yet, but I will be letting you guys know if I do. Well, I don't market a broker. I'm just going to let you guys know if I switch to a
broker. I don't plan to market any broker anytime soon. You know what's funny? I paid $2,000 for that lighter. It doesn't work. Now I have to use this $20. What is it? How much? I don't even know how much is this. Like $5 at a gas station. [ __ ] sucks. It just doesn't feel right Lighting a good cigar with a $5 lighter from a gas station. Feel like I'm disrespecting the cigar. $2,000 on a lighter. GBPCHF. Probably one of the cleanest ones that you can probably see. And it is this beautiful higher high, higher
low. Higher high. Higher low. Higher high. Higher low. Higher high. Boom. [ __ ] structure lower low high lower low. Now this time frame is bearish. Now if I just show you guys this market structure Like this which is realistically how you have to look at the structure of the market not look at the market. This right here is the structure of the market and you can clearly see how we were creating higher highs, higher lows and we shifted. We did a ginormous and beautifully formated double top pattern right here. And now we're coming back
to retest that neckline of the double top to then have a reaction to the downside. What a coincidence that the neckline of The double top happens to also be at the weekly EMA and also happens to have a round psychological level 1.12500 which is obviously very key because now you just have three four things that simply make sense at this area in order for you to be interested in the trade. What a coincidence. Now we also have the daily EMA, we also have daily structure level, so on and so forth. So, what I'm going to
be waiting for for this trade is for price to have a break and retest Under this little double top formation that we're potentially creating at this area here to have an alarm right at the bottom of it that's going to notify me as soon as we break out of it. And this trade once it does that it's going to have a great riskreward. We can easily get a 1 to5 or even to this structure point and then obviously we have a smaller stop loss. We get like a 1 to six, 1 to 6 or 7.
This is a great risk-to-reward on this trade because we Are following the trend. We're trading with the weekly time frame, we're trading with the daily time frame, and once that double top breaks, then we're going to be trading with the 4hour time frame. So, we have three time frames that are going all in the same direction. We simply just enter the trade set for. So, after we analyzed the top markets for the week, like always on Sunday swings, we then realized there was no markets to trade. But then we got A phone call from this
guy that was like, "Yo, you want to put your Bugatti in a music video with Kodak Black and Trump? >> They want to have your the Bugatti um in this warehouse and have this marching Trump's marching band behind it playing while Kodak and all them are rapping in front. But Trump will be there. >> I I mean, I've been part of a couple music videos. I know how this [ __ ] goes, You know. Start pull up at 3, start at 7, end at 1 in the morning, you know. >> Well, I [ __ ]
hope it's not like that. >> Like, [ __ ] yeah. I've listened to Kodak Black since I was like 15. And who doesn't like Trump? Little did I know that I was getting scammed. Trump was not pulling up. And Kodak Black pulled up 20 hours late. And that same night, my Bugatti broke. >> Kodak's not here yet. We'll probably be Here like 30 minutes. We going to leave till like 3:00 in the morning. Watch >> this time. My bad. won't care. When I go, I'm going be hold. I'm not going to lie. This [ __
] feels a little too wobbly. [Music] We are still here. It's 9:00 a.m. Basically a trade update and we're still here. Well, after a couple hours, Finally got it up. Now we got to take it from this tow truck to that tow truck. [ __ ] this dude. >> I don't even want to talk about that. So, after we finish all those shenanigans, like always, patience pays. And most importantly, following the set and forget strategy CHF, as you guys can see, we're currently up about $6,000. So, we entered this trade earlier, Literally probably like [
__ ] I don't know, like an hour ago. But, we're in the middle of all these calls and the trade is now heading into our direction. Everything's looking very well. We're actually in a lot more profit than I expected. Obviously, I did not account how volatile this pair is. I did not realize that this pair goes into a little bit more draw down. We'll blow this account completely because this pair is super volatile. I actually have Not entered a trade in GFP CHF in a very long time. But this trade right here, if it does
hit my takerit, it could take this account up to like $70,000 if it does make it all the way down here. And then we were up now from the $8,000 that we were technically down back up to the $15,000 where we were 2 weeks ago. So, now we're picking back up, staying on track, and the goal for this week was to turn the 8,000 to 16,000 to 18,000 roughly. And I again, I had an executive Decision to make. Do I close at the profit for the week or do I set and forget? What do you
think I did? I [ __ ] set and forget. >> Drum roll, please. $38,000. Ching. Well, for right now, I think this trade is that's why I'm not even that excited because I do think this trade right now in London session is going to have a pullback. Let me show you. So, I think now this is will have a Retracement to retest this neckline of the left head, right shoulder for then the trade to then head to the downside. Currently on the daily time frame, we close very strong as a bearish engulfing, but we could
come back and retest these daily wicks right here. So then the trader can continue heading to the downside. Now this is where a lot of beginner traders will probably get, you know, FOMO and either close out their positions here or they can probably set And forget the whole entire way. Currently just waiting for it to do its thing. But then when we go close the trade, we get the most ridiculous slippage I have ever gotten in any trading account. And I said, "If I'm getting slippage at this part in the challenge so early on, I
don't want to be with this broker anymore." >> Yo, we just blew the whole [ __ ] account. >> No, that's how you close the trade, >> bro. We literally just blew the whole account. [ __ ] We just withd you all the money. So, we just draw the money from the current broker. Should get into my wallet by the end of today, maybe tomorrow. And uh we're going to deposit into a new broker, which I might be letting you guys soon which broker it's going to be. So you guys are going to have the
same market conditions as me. Current broker right now. The fees were all over the place. The commissions were okay. It was more of the slippage. I would literally try and close the trade out and I guess slipped out. I wouldn't get closed at the point that I wanted to. So I'm going to be switching to a new broker today pretty much. And uh we'll see where the challenge goes from that point. And this is why I don't market brokers right at the beginning of the challenge. I know you guys ask me For what broker am
I using? What broker am I using? I literally got this asked a thousand times. I don't want to market a broker that I don't trust and I don't have any experience with and gladly I didn't market it because [ __ ] I closed a trade at 30,000 in profit and then it puts me at 22. The slippage and the spread was absolutely ridiculous. I decided to withdraw my money and then put it into a new broker that I was going to then test out. But again, keep In mind this is the exact same account that
I then just transferred the funds into a different one. And this is where we then pretty much moved on to week number seven where the ending balance was about 22,000. It's week seven of me turning this $100 into a million. Then on this next week, it was week seven. We were starting with about $22,000 and then the goal was to take 22 to then 40. Touch that. Touch that. what you guys Know about week seven turning $100 into a million. I I I thought it had just reversed on us. I was so I was like,
"Oh shit." Currently, right now, we are up $4,000 on the trade. Now, I'm not excited because of these $4,000. I could give a [ __ ] I'm excited about the potential of this trade that we have taken. If you have seen last week's series, you saw the loss we avoided on this position. Price had the push, stop, then push. That's what we are anticipating for this week to come ahead. So, we avoided not making any money this week simply because we have experience in the market. Now, let's look at it now. So, trade update. We
are currently up $4,000 on GBP CHF. So, if you guys saw last night's trade update, I explained that I was looking to enter a trade right around this area once we had the retest to then sell. So currently right now, GBPCHF has a very strong double top Formation currently creating right now. Very strong bearish move. If this trade hits all the way down here, we'll [ __ ] sweep 1 to 11 risk-to-reward, meaning we will take Right now we have 35 lots, right? So 35 lots means that it's $350 per pip. So, we do $350
per pip times a takerit of $342 pips. So, $350 times 342 pips. Drum roll, please. $100,000 in one single position. The beauty of This is not this. We're going to get to this no matter what. What is the beauty is how much I'm actually putting at risk. So, I'm only putting at risk. So, we have 30 pip stop-loss. So, if I do $350 per pip times $30, I'm only putting at risk 50% of the account. This is key to growth. So, I'm literally risking 50% to almost 5x the account. Tell me that's not a [
__ ] great deal. So, as of right now, we are currently just waiting For this position to have a confirmation body candlestick closure in the next 27 minutes under this level of support right here. 4hour candlestick looks very strong, very bearish engulfing. Can then wait for a little retest as well for then that structure level right there. Basically, moral of the story, all we got to do right now is set for it. Just looks so lovely, dude. Like, we're finally like making some type of decent money. Like, look at this. And then we Ran into
the same broker issue. We took the 20 and then we took it to the 40. But we ran into even worse slippage on this other broker that we were testing out. And again, this is why I don't market brokers. It's my first time trading on it. And I'm taking a good trade. And when I take it, the profits that I'm supposed to be making, I literally lost it because of the slippage on the account. This is the trades from last night. GBPCHF. You guys Can clearly see that we closed out all three positions at the
same exact time. one of them is in profit and then the other got split in half or whatever and then it was in a loss. So GBPCHF last night I explained if we had a retest of this level and then a rejection to the downside we can very easily continue to head down. If not if we body closed above we can come back right into our area of interest. So, we body closed above. And as I'm seeing this body close Above and then I'm seeing this rejection from the EMA, but then I see this retest
of this level of support that every single time we're above, we're clearly heading up. I say, "Oh [ __ ] this is the area where I want to get out cuz I could get pushed right back into my entry and I don't want to be in a loss at this point in the challenge. I'm doing so well." So, I decided to close my position right at that line right there. Right at 1.11282, Right at 3:00 in the morning, 4 in the morning, which is like when London session is kicking in. You guys can see down
here the times. And I closed out the first position, right? The 20 lots. So, the 20 lots gave me $2,000 in profit. Now, we're going to do some calculations right now because if I enter the position up at this point right here, and then we close out the position, let's say somewhere in here, that is a total of about 23 pips. But For argument sake, let's say 20 pips. So, I am currently risking $200 per pip. So, it's going to be $200 times 20 pips. I'm supposed to be up $4,000 on that position. I am
up $2,000. So, they ate up 50% of my profits, but that's fine. You know what? High fees. I'll take it. Whatever. Not a big deal. But then the other position when I go close it, it is then in a loss. Why did I take a loss on the same position that I entered at the same spot and close at The same spot? Why did it close at a loss? Now, this is where I get very skeptical about these platforms because it's just so unnecess like like I just I just don't get it. And this is
why I also split my lot sizes because everybody says, "Oh, why don't you just take 180 lot?" It's for this very same exact reason. If I were to take 80 lots in a position, it would literally have one full slipped out position versus if I split the positions in half, at least I get one and then the other ones probably have a little bit of slippage. I I do this because I've dealt with this [ __ ] before and I've been dealing it for a very long time. Like this at this point was very frustrating
because I just came off of a losing week, then a break even week and now two weeks that are technically break even because of the market conditions that the broker was giving me. If I'm running into these issues with a broker so early on into The challenge, I'm already being skeptical because imagine the slippage and the issues that I'm going to be running at when I'm fluctuating hundreds of thousands of dollars in profit, which is realistically like 3 4 weeks away if I double the account every single week. It's week eight of me turning $100
into a million. Last week, we took two trades where one of them made us about $2,000 and then the other we lost $2,000. Biggest waste of time ever. And I wasn't Going to let any of this broker issue stop me living my life. I'm going to go drift my Porsche. I'm going to go hit the gym. I'm going to go do what I have to do because at the end of the day, what affected me last time was that I was not living my normal life. Now, this time, I decided to, you know, you know
what? If I take a loss, if I take a win, I'm going to go hit my gym. I'm going to go take my my night trades, if you know what I'm talking about, and just do what I got to do. And then later on throughout the week, we got another great opportunity in the market, which is what we analyze on Sunday swings. This market right here currently is having a lower high pullback. And this is what this market structure looks like on this pullback, right? We have some structure right here and then we are now
at this resistance level. If I take this same exact market structure move from right here and then I simply move it to This market structure here with an exception of making this a little bit higher and aiming this a little bit higher. It's the exact same move right here, but instead of it obviously being here, it is now right here. It's the same exact move with the exception of bit being a little bit higher. Now, what is the difference that this had this [ __ ] the structure up here and that this one is having
it right here. Let's see what happened here to see if we can Anticipate for it to happen here cuz we're expecting for the sells and clearly this once it did this pattern, it then went to the downside. So, let's zoom into this 30 minute structure on this circle time frame right here. What did we get when we were at this pattern right here? Oh, okay. We got a left head, right shoulder. Okay, cool. Left head, right shoulder, retest, then sell. Well, let's go to current price right now. Holy [ __ ] What do we have
here? Left head, right shoulder. [ __ ] with me. [ __ ] with me. if you want me to keep showing you guys because I see this all the time and I don't always explain it because I it's just normal to me. This is my second language, third language, and I see this literally every single day. It's very normal to me. But to a lot of you guys, this might be like what the [ __ ] a wow moment. And if it is, let me know in the comments so I can keep doing this stuff
for you guys cuz It motivates me and it shows me that you guys are actually learning. So this position, we're actually very, very, very interested in executing, but not just yet. I want to execute this position once we have some type of engulfing confirmation. As of right now, I have my potential entry right under this level because when this candlestick closes under it, it is a engulfing candlestick. So, just put my alarm under there to pretty much notify me once we Have that engulfing candlestick. Even the 15-minute hasn't had the engulfing quite just yet. So,
we're going to stay up all night tonight because that literally might happen very, very, very soon. We actually ended up taking then the account from the 22 to about 60k in profit more or less. Drum roll please for the [ __ ] trade update. $19,000 [ __ ] dollars in profit. Now what how fast did this happen? Very fast. Let me Show you guys. So right now USD JPY exactly how I explained yesterday. We literally explained the only way we'd be interested in taking this position right here is if we have a break, retest, and
then sell. Price literally broke, retested, sell. Exactly what we anticipated. Perfect entry signal. Literally 1 hour ago. As you guys can see down here, 8:00 in the morning. Currently, right now, it is 10:00 in the morning. So, as soon as we entered this Position, market immediately started heading to the downside. Look how fast this momentum of this market is currently moving. Beautiful 30 minutes bearish engulfing evening star formation. 15-minute time frame. As soon as the candlestick close, boom, just completely downside move, which is absolutely beautiful. This is the trade that we avoided yesterday and we
avoided to take the loss cuz it never retested and gave us the engulfing of this left Head and the right shoulder. Now avoided this loss, we can remove this. Now we have this position right here. We're just looking decent, right? Obviously, I'm just hyped because I risked a lot more than I should have because we're trying to turn $20,000 into 40. So, I can literally close the position right now and then we will have the $40,000 in profit that we need. Literally. Oh. Oh [ __ ] Oh. Oh. Oh. What? Oh [ __ ] What
the [ __ ] just happened? Oh [ __ ] Oh. Oh. Woah. Woah. Woah. Whoa, whoa, whoa, whoa, whoa, whoa, whoa. Whoa, whoa, whoa. Don't you [ __ ] do it. >> Hold on. I'm in I'm in shock right now. Yo, I saw 50,000. It was It was at the bottom of that wick right there. Is news happening right now? Probably. Well, now I'm on edge. I'm going to put an alarm right around my entry signal just to let me know that it is up there. I have to put a an alarm at the bottom
of this Candlestick. If we if we get a candlestick to go back under that wick, we're pretty much good. We are good. Okay. You know, you don't want this. All right. So, currently, right now, we had a little quick uh spaz in the markets. This is what trading in the market is. This is why people go crazy when they risk more money than they should. If I was risking, you know, 3, four, 5% like a normal human, I would Even care. Oh, right now, $40,000 floating in profit. That's all we care about. >> Oh [
__ ] Oh [ __ ] Oh [ __ ] Yo. Oh [ __ ] Yo. No. Yo. Yo, I can't Yo, I can't make this up, dude. Yo, I can't make this up, dude. Holy Holy [ __ ] Holy [ __ ] bro. Yo, stop, dude. Oh, we got 100,000. Yo, there's no way. Yo, there's no way. Yo. Yo, there's no there's no way. Ow, I kind of hurt myself. Is my watch okay? That's fine. Doesn't matter. We can buy another one. Oh. Oh. Oh, dude. Oh. Yo, we're about to be at 100,000. That's [
__ ] crazy. Yo, the countdown is legendary. Yo. No, no, no, no. We got to keep going. We got to keep going. Got to keep going. We got to keep going. >> 95. >> 95. >> Oh, 97. Yo, it's going to hit 100,000. Yo, it's going to hit 100,000. We got to keep going. Look, dude. I think I think we got to like Ah, dude. Do we got up to there? [Music] Now, now I just got to focus. What is it? Why didn't you do this? This right here shows you guys that the [ __
] Fundamentals will follow the technicals. All right, I got to focus, dude. Market update, boys. Markets update, boys and ladies and gentlemen. We have officially officially closed the accounts at No, no, no. Drum roll, please. Thank you very much. We have officially closed at 90,000 [ __ ] dollars on the account. So, we ended off the week I think about 90,000 80,000 something like that in profit. And honestly, I didn't have really Anything else to do. So, I had a bright idea. Why not buy five, six junk cars, call my other rich friends, and let's
just go play bumper cars. Hey, [Music] [ __ ] So, we ended off closing off the week with about 90,000 I think in profit and playing bumper cars, which is pretty legendary because I got a pretty big group of people together in under two Hours. Like, imagine you're getting a phone call saying, "Yo, pull up to this location and let's play bumper cars." Everybody's reaction is like, "What the fuck?" >> Good morning, ladies and gentlemen. As much as I would want to go right into the markets and show you my trades on this week where
I'm going to be turning the $90,000 into 200, I have to spoon feed my children, my very special unit of children, the haters. Come here. Come Here. Airplane. So, the beginning of week nine, something that I expected to happen happened. the haters. The haters decided to arise and they decided to then voice their opinions on their challenge. Now, keep in mind haters were not voicing their opinion up to this point. Why? Because the account wasn't big enough. Turning 100 to 300 and then 300 to 4 or 5,000, it's just not exciting. But now, when I
started having multiple six Figures fluctuating, automatically people wanted to then say, "He's not showing the trade history. It's not real. He blew the account." Like if I have not been showing every single trade, the before, the during, the after up to this point, literally showing every single trade in my free Telegram, in my Discord, in my Instagram, on YouTube. They wanted to voice their opinions. And I said, "Okay, you know what? Nobody's going to [ __ ] with my Reputation. My reputation is everything." So I addressed the haters, showed the trade history, and then continued
on with the journey. Because truthfully, if they were concerned about the challenge being legit at this point, I said, "You know what? Thank you. That means I'm not doing good of enough a job. Let me double down on making this even more transparent and even more legit. Ladies and gentlemen, it is currently 11:15 In the morning. And as of right now, the account is currently sitting at a whopping blew the account. >> It's like $115,000. Now, you know what? Let me just uh we're currently sitting at $115,000. Now, the reason why I'm not excited is
because we could have literally been in this much profit. We've been holding the last trade, but it sucks. So, we had to overexpose ourselves, but it's okay. Why? Because the strategy is working Once again. NZDCAD literally having left head, right shoulder, retest of the neckline. Exactly what I explained yesterday on the 1 hour time frame. Higher high, higher low, higher high. Once it breaks and retests this neckline, we will be interested in selling. And boys, that is exactly what we did. We broke and we retested once again. Like does not get any more legit than
this. Oh, but you want to know what's the crazy part? That the downside Potential of this trade is massive. we can reach lows of all the way up to this structure point right here, but we're not going to do that. We're not going to be greedy. We're going to be realistic and set real takeprofits and we enter this position. Once we body close under this right here, we're pretty much good. And very ironically, the same week that I call out the haters is the same week where I'm supposed to be fluctuating in multiple six figures
in profits. I Actually ended up having the biggest loss. >> I don't even know why I'm laughing at this point. Yeah, the account boys to 44,000. [ __ ] bro. This is why we can't [ __ ] around talking [ __ ] We [ __ ] jinxed it. Talking [ __ ] So, we just took a unnecessary $40,000 loss on NZDCAT. The same week I decided to troll the haters, which honestly it was kind of funny because I made it even more legit, even More transparent, and I expected to win a trade and I lost.
I lost in front of everybody. And after I trolled the haters, it was kind of like a it was an L on my side. But you know what? I'm glad I'm glad that that happened because that only made me stronger to then come into the next week. So, we started off the challenge this week on about 90,000 and we ended off on 40, which kind of sucks because after you address haters, you want to win. You want to win on the Haters. I lost on the haters. Even though we did lose 50% of the account,
I did something the haters can't. I got on a G4 to go to Dominican Republic to not only do a podcast on the jet, but to go check out my tobacco farm that I have for this brand that I'm actually building, which is my new cigar brand. And I said, "Okay, I might have lost for the week, but let's take this private jet, this cool podcast, and be back in about 36 hours just to check up on how The cigars are doing and coming right back." So, the haters had the laugh at the beginning of
the week, but then I had it at the end of the week. All right, ladies and gentlemen, good morning. Let's head to our office. So, let me show you the starting balance for this week on the account. Wrong phone, white phone. So, right now, the starting balance for this week is going to be $44,000. So, to start off week 10, we got on the Jet right back to Miami. But before I leave, I like taking care of the people that took care of me while we were out in this trip in Dominican Republic. Had one
of the best chefs, one of the best services. Tent them about $2,000 in ones that I happen to find in my duffel bag. Don't ask me why it's ones. Don't ask me how it got there. I don't know. [Applause] You know what's funny? You give like you give somebody in the United States $10,000 like cash, like a big stack like this, and they'll be like, "Thanks." Like they won't they won't give a [ __ ] The first thing that I do when I get back is pull up the time piece trading, buy a new Richard
Mill cuz I felt like my wrist was a little weak, you know? I'm like, you know what? We've been doing this for 10 weeks. I need some motivation. I need something better. Bugatti is not enough and it's broken. Let's go buy a new Richard Mill. >> What you just picked up, it's limited to 50 pieces in the world. It's the Asia edition. It's carbon, super light. I think it's cool. Like, it's good contrast from your like your white watch, your gold watch. You know >> what makes this like the Asia edition? >> The the color
way. Oh, like a black and black, >> bro. I like this one. I think I'm going to take this one. >> That's it. >> He's going to sell it to this guy, bro. >> [ __ ] it. Why not? We bought a chain for Ste. We give away out to him. >> Cuz you're always giving back. >> You know what? >> Yeah. What is going on here? >> The [ __ ] going on back there? love it. >> You know, he never gets gifts. So, I was like, let me be the first guy to actually
gift this guy. He's always giving other people stuff. And I thought It was a nice gesture. He doesn't need it. Probably got the chain, throws it into the safe, and never looks at it ever again. But my conscious is good. We are currently in a position that we are going to continue to set and forget. I mean, I literally just called it last night. It's not my first time calling it. All right, boys. So, market update. We are currently up 41,000. So, we're back at We're not even back where we were last week. And we
just did The dumbest thing ever. We just executed a loss right here because we decided to enter this position right around this area thinking that it was just going to continue to go down. Like when you don't sleep all night, you just start seeing [ __ ] But then I go down to the 1 hour. I'm like, but wait, this price definitely has the opportunity to come back and retest this level of support and resistance just how it did here. It could even go up further. it could Literally go back up all the way up
to this area right around here before actually going down. So the 80 lot that I took at that point right there, I simply closed it cuz it was actually [ __ ] So now I'm currently in this position. Um similarly what I said yesterday, we're ready to execute it. We're just waiting for the right confirmations. We just got the break of the structure how I wanted to enter the EMA. And yeah, we're in this position now. So, I'm just going to anticipate for price to continue having a push to the downside after this retest. Uh,
we avoided a loss yesterday on Euro GBP. Avoided a loss on GBP JPY and avoided a loss on Euro AUD. So, we've been dodging bullets all week. Finally managed to catch one that aligned with the strategy. We closed a position at the top of this wick up here and literally we probably did the best decision we Could have done. We closed these two positions at a $2,000 loss for a total of 160 lots. Then we waited for price to have its rejection. Now, some of you guys would have been like, "Wow, you closed for no
reason. You could have still been holding the trade." You know what? You're right. You're right, dude. But you wouldn't be up $63,000 if I did not do that. Why? because I waited for this next entry bearish engulfing confirmation uh evening star formation Under the EMA rejection from the structure and I said you know what okay fine you want to take me out of break even and you want to make me lose an extra 15 pips from the original entry that I originally had up here from this to this point okay fine I'll make it back
by risking 170 more lots on this position before we had 160 lots which was these positions right here. 80 + 80 is 160. You add all these up and we have 330. So, we essentially almost doubled a Little bit over the risk that we had before, but we got an extra confirmation that we did not get here. And you know what? I [ __ ] with it because yeah, we lose 15 pips from the entry, but we gain 170 lots. It sucks on the short term, but on the long term, trust me, it's going to
pay off, man. Dude, how stressful, dude, these last couple of hours. >> Yes. Yes. >> In profit. Like, we weren't just up $70,000 [ __ ] dollars. This shit's making me go crazy. >> All right, we just got out right now at [ __ ] I don't know, dude. I don't even know how much that is. Um, like $6,000 in profit, 5,000, whatever. >> Bro, what a swing, dude. How do you go from like 13 How do you go from $70,000 in profit to then $13,000 in draw down to now only making 4 grand? Tell
me how that works. So, we ended off week 10 Pretty choppy, kind of whack. Can't even lie because we spent a lot of money, but we didn't make a lot of money. But then come week 11, we do the same thing. Pick the top pairs for the week. But now this time, we did a major comeback. >> Welcome to week 11, turning $100 into a million. We made up for the slack that we did in two weeks because we took the account balance from what we were starting at to about $200,000. Now, you might be
wondering, "What the [ __ ] The video just started." It didn't. The video started yesterday on Sunday Swings. Welcome, welcome, welcome to another Sunday Swings, where I literally broke down every single one of these trades to the tea. I entered USD CAD on the sales once again. So if you guys go watch last week's series, you guys would see what I went through last week right here at this very moment. I entered this trade, got stopped out at break even. I closed out a break even. I Entered this trade, closed myself out of break even
right here. It was an absolute brutal Friday. Now price came back into the area, did exactly what I said it was going to do, and then we executed the positions right at the top of this area. Such a beautiful trade. Look at this retest here from this level of support, support, support, resistance, rejection from the EMA. Daily time frame currently having that re break of structure. This daily Candlestick engulf 1 2 3 4 5 6 7 8 9 10 11 candlesticks. Then we had the pullback. Then we had the weekly double dogee rejection from the
EMA, rejection from the structure. Like there's so many things that are going to make this trade create a new lower low rather than create a higher high. All I did was simply re-enter the trade where I was originally entered. The only thing that changed is the mindset behind when I entered this trade versus when I entered This trade. But if you notice, I'm taking the exact same trade. Look at the pattern formation here and where it is. It's at the area of interest EMA. Look at the pattern formation here. It's at the area of interest
and EMA. And then you simply set and forgets. And we are now up $168,000. And yes, it's the same account as always, boys. You guys can see right here in the trade history. We can like I can literally close this position right now. So, it's literally Monday morning and I can literally close out this position at this very point right here and be done for the week. And there goes this series 5 minutes. But you know what? We're not stopping there. We're going to keep it going. We're going to try and turn this hundred something
thousand into the million today. Now, the goal for the week was to double the account. And like always, I see the structure continuing with the trend. So, I'm going to set and forget. I want to maximize my profits, but minimize my losses. Trade update. It is currently 12:45 in the morning. It's about to be 1:00 a.m. Right now, we are in a new position where now the account is up 35 gazillion dollars. I'm kidding. We're still at the same exact spot. Still no trades that we have added on to the challenge. So, we did miss
this new added position on USD CAT. As you guys can see, prices actually had a retracement to the area Exactly how I anticipated. Price came back, reaches this structure level, and now it looks like it's having a sell down. We literally pulled out, right? I mean, you know, we had a little bit more that we could have potentially gotten, but you know, it's simply not worth it. So, we got out at the perfect area right before this retracement. We're looking to add positions here, but the session was not the right session to be entering this
trade. So, for me to be interested In adding a new position, I would have to wait for a retest here to then head to the downside. So, I'm going to be waiting for that lower high to then sell. Wake up the next day and I see the trade could have tripled the account. I could have closed the account at half a million dollars by doing nothing. And, you know, this did mess with my psychology a little bit, but I'm leading by example. I have too many people watching me. I have to be realistic and Be
like, you know what, guys? This is going to happen. You're going to set and forget and you're going to close at the point where you thought it was the final point before price reversed. But the trade keeps on going. It's okay. You made money. You hit your take profit. You move on. So, I did miss out on about 300K on the trade. But it's okay because I hit the profit for the week and we showed people that we can come back from two losing weeks, two break even weeks To now tripling the account on one
single trade. It's week 12 of me turning this into a million day trading. So on week 12 is where things start getting a little interesting because now every single trade we're about to take is going to fluctuate hundreds of thousands of dollars. So, like always, the pairs that we analyzed on Sunday swings ended up taking it. We fluctuated up and down. >> Trade update. I feel like I I feel like I've said this a million times. Trade update. Right now, we are up $59,000 on the account. But not only have I said this a million
times, I'm talking about this. Oh, oh, oh. Yo, what is going on every single time? Yo, what the [ __ ] Yo, it's every time, dude. Yo, I can't make this up, dude. Yo, I can't make this [ __ ] up, bro. I can't make this up, bro. I was literally going to say we have the head and shoulders pattern. We See this pattern a gazillion times and then we usually always have the retest to then sell. Dude, what is happening, dude? What is happening, bro? All right. Well, look at that. There goes our trade
update right there. We're up 100,000. The goal for the week is half a ticket, bro. Almost was there. Come on. Do your thing. Yeah. And dude, I was just so calm. I was so relaxed. I was so pacific. Well, the goal was to show you guys that What I said we needed yesterday to happen, which was the head and shoulders. We put our alarm at the ship structure and once we body close under it, we get the retest and then we sell. That's basically it. We've we've said it a 100 [ __ ] times. You
can't make this up, dude. You cannot make this up. Okay, so right now we are up exactly a one to one and we're up about 100,000. That means when we get 2011 to 2, we Should be up 200,000. And when we get 2011 to 3, we'll be up 300,000. Isn't that beautiful? Don't you want to have your easy math like that? Every single time you add a risk-to-reward, it's just an extra 100k. 100k. 100k sounds good to me. This is why I didn't want to celebrate earlier or be anywhere near excited because I expected for
something like this to happen. We are currently down about $25,000 in the account when we were up earlier about $150,000 at the Height of it. The markets did the dead out of me. Look at this. Price went not only straight into our stop loss, but a complete violation. Break through the previous structure level, almost through the screen, and out the [ __ ] roof. We just got diddy didd in the didd. Is that even real? [ __ ] Luckily, we did not risk much on the position. We are only back at $135,000 and we only
took about a $68,000 Loss on the account which given this trade I should have risked 100%. But I explained to you the higher I go in the account I lower my risk by 25 to 50%. So I'm not even mad. I I I'm not it's just it's one of those losses with this type of approach. You know, Albert Einstein has projects that sometimes don't don't do well. And right now, we are not doing well. We're still at the same exact spot. Still no new positions into the account. So, our trade deals are going To potentially
start moving as of right now. GBPCHF for cells. I love how this price action is currently looking right now. Daily time frame closed with a daily dogee. And if we go down to the 1 hour, 1 hour has had what looks to be like a little double top. I'm literally going to wait for a break and retest under this area right here. So, this is kind of like the consolidation zone it's in. So, I want to have some type of break out of this and then a quick Retest, then sell. A little breakout, then a
quick retest, then sell. Everything depends on the price action. But, I want to enter here, but I can't enter here right now. I need the breakout confirmation and then the pullback to enter here. I don't mind entering a little bit lower, but I just need the confirmation that it's having a breakout. It's having a move. We are up $238,000 [ __ ] dollars. GBPCHF Trade update. So, right now we have three very unique entries on GBPCHF and I want to explain them to perfection because this moved very fast. Literally only like 4 hours. This is
just one candlestick. So, GBPCHF, we had the 4hour bearish engulfing how I wanted from that area and then we obviously entered at the breakout of all of this consolidation zone here. I entered on this 1 in the morning candlestick as it was getting ready to close. Entered Right there. Spread took a little bit down and then we had our next entry on this 15minute pullback. So, we had the full move. I'm like, yes, amazing, beautiful. But then we had this pullback. And on this pullback, I waited for this engulfing confirmation. We entered on this pullback
of this wick. And then the next entry, we entered at the bottom of that rejection candle right there. And those are our three entries. We have our first one up here, Our second one right here, and our third one right around here. And our takerit was very strategically placed at this next 4hour low. So as you can see, the 4 hours is clearly bearish. Higher, high, higher low. D bearish lower low, lower high, lower low, lower high. We're destined to create a new lower low. But up to where? Up to this structure point. And you
can clearly see that price has very well reacted from that structure point. This is only a 1 to 2.7 Risk-to-reward. And we've risked a lot more than what we're risking here on different markets. This move just happens to be very, very volatile. Like we're up 102 pips right now. >> You got to set and forget. The trade either hits my stop loss or hits my takeprofit. Can I set and forget? And the trade ended up closing off at the highest point, which I think it was about $400,000 at this point where the challenge is Right
now. So, we stuck to our trading plan. We held oursel accountable while doing this live in front of hundreds of thousands of people on my Telegram, Discord, Instagram, YouTube, absolutely everywhere. I'm not the only one making money at this point. There are so many of you guys that have done your own flips that I'm like, "Oh [ __ ] this shit's getting serious." I did a podcast with a student that by copying my exact same trades, he took uh what was it? I Think he did $1,000 to $150,000. This guy by just watching my Instagram
stories became a six figure person by watching 10-second Instagram stories. Talk about [ __ ] batting. Trade update. We closed at 332,000 trade history. As you guys can see, we have officially closed the position at the highest point keyword. We've closed the position. We were just up 400,000. We lost 70K just because of [ __ ] floating [ __ ] P&L. Well, you know what? We actually won a trade. We shouldn't be doing that. So, after we closed off on week 12 at about $400,000, on week 13, I got a bright idea. We're going to
[ __ ] live stream the last trade, trading 400 into a million. [ __ ] it. I came up with a bright idea to do it on Instagram. I go on Instagram, try to do an IG live, doesn't let me. Said, "Okay, you know what? Everything happens for a reason. Let's then go to YouTube." And we start A live stream turning $400,000 to $800,000. All right, ladies and gentlemen, welcome to the live stream. Today in the morning when I w I literally just woke up like an hour ago and I'm seeing the trade that I
took last night. I'm like, "Yo, I have to do an IG live from the moment that I wake up till this trade hits a million." Then I go to my IG. So I'm going to show you guys right now. So this is my account as you guys can see. When I go into my Account, I go into my settings and I'm trying to go on live. So look, I'm I'm going to do it right now with you guys, right? So right here on my IG, I try and go live. So I click here live at
this time, your account is not eligible to use this. So even if I wanted to, I couldn't go live on Instagram. And I'm like, [ __ ] how do I stream? Like for me, this very point the whole entire way of me turning the hundred to the mil. Like it's going to Literally be like the rawest day in the life that I think anybody has ever done. So, basically, we're going to stream until this account turns into a mill. Whether it happens today, tomorrow, the day after. I don't plan to turn off the stream until
we don't reach the million. So, this can last an hour, which I don't think so based off of the price action. Or this can last 24 hours. This can last 48 hours. I will not shut off this stream until we don't complete the Challenge. This is something that is legendary and I want it to be documented the whole entire way. So get prepared, get comfortable because this is going to be an interesting 24 hours, 48 hours, you guys are going to see real day in my life. Obviously like if I had to enter some meetings
and stuff, you know, I can't have you guys be part of that. I'll just kind of like put it to the phone and [ __ ] So I mean we're we're live, bro. Like what Do we do now? Like we're just live. Look, this is literally live right now. >> Focus. >> How much are we up? 600. [ __ ] >> History. >> Hold up. >> Is it focusing? Is it focusing? >> Yeah. Put a little higher. >> Yeah. There you go. >> You want it higher than that? Huh? Okay. So basically we have USD
CHF where Basically we have been interested in taking this position since early this week. You guys can tell how we've had this very strong consolidation zone and then what we ended up doing is we broke out of that consolidation zone. Let me actually take off all these writings. So once we broke out of this consolidation zone, we were then waiting for price to have a retest of this area. Once it retested this structure, then we would continue to head to the upside. Now, This had the retest exactly not exactly as I wanted to, but it
made it to the area. And we had the most important thing, which is going to be our entry signal, which is this right here. This right here is our entry signal. Not this specifically, but there is something in here that happened that is my entry signal. And I don't really ever speak about it. And you know what? I'm going to talk about it on the stream, but not right now because we just got started With the stream and I don't see this market moving for the next 7 hours. So, only to the soldiers that are
with me for these next seven hours that I'm doing this stream am I going to actually break everything down of my strategy and everything. So, I I I you know, I feel like I came up with this idea and I haven't really processed that. We didn't really put too much thought into, >> bro. For real, dude. What the [ __ ] bro? >> Cuz now I can't turn it off. >> I just can't. I'm so committed. I I can't. I live streamed for literally 26 hours. I was with you guys when I went to throw
away trash, when I went to go eat, when I went to go drift, when I went to go do my day-to-day life. I literally was with you guys all the time. So, I did want to say this is probably one of the most spontaneous little events I've done. I probably expected five people to pull up, six People to pull up. We have well over almost like 50 60 people. It's two in the morning. You guys are maniacs, right? I'm letting you guys know. I thought I was a freak staying up all night watching the markets.
>> You are. >> Well, I'm not I'm could be a maniac. I could be a maniac, but I'm not the only one. I'm surrounded by other people that are passionate about this [ __ ] People that are willing To do whatever the [ __ ] it takes to make this [ __ ] go down. And like, yeah, it's cool that I, you know, dropped the pin and was able to get you guys here together, but like this [ __ ] is not about me, bro. Like, this is about you guys. You guys got to realize
that you guys are doing the same thing that I'm doing to be able to be on the same journey that I am. You guys are staying up. You guys are putting money at risk. You guys are learning, failing, rinse And repeating. And over time, you're not the same person that you were last month compared to now. So, I just want to say like the people that you are around right now are the people you want to be around with. You're the fifth person out of your four people in your friend group. If your four friends
are smoking weed, you're [ __ ] smoking weed. If your four friends are diddy, you're the fifth Diddy. That's how it go. >> You guys were telling me to close a Trade when we were up 700,000. >> This is not done. There's a lot more in this. >> You guys told me to close a trade when price started pulling back and we were at 600,000. And on the live stream, not only am I answering all your guys' questions, but I am literally engraving the mindset. You need to adapt to be able to handle these types
of swings. The trade isn't done. If the trade has not hit the takerit, you do not close. The trade was at about 700,000 and I wish you could see the chat. Literally thousands of people live watching saying close, close, close, close. Clearly, none of these people are my students and they don't know how the set and forget strategy works. The set and forget strategy works by set and forgetting. You have a stop-loss. You have a takerit. Price is either going to hit one or the other. And guess what we did? We set and [ __
] forget. >> We have officially closed the challenge at 800,000. Just do it. The trade not only hit our takerit and we close at 800,000. The trade continued to create new highs. If I would have just continued to hold for two more hours, I would have completely finished the challenge at this very moment. I could have finished it on a legendary 26-hour stream. But you know what? I'm glad that I followed my strategy and I closed at where I did Because then this gave me the opportunity on week 14 to start off a stream right
at the beginning of the week where then we took the final $800,000 to then the million. And all I can say, you know what? I'm gonna let the stream speak for itself. >> So that was like looking back at those clips right now, it really lets me just like settle in and realize, bro, what I was doing, I I was out of my mind. I was losing sleep every single night. I was Taking a unnecessary amount of stress that I didn't need to take. And honestly, I just put this challenge on my shoulders for whatever
reason that I came up to it. But if there's something that I did realize after watching back on these videos and looking at what I did is that I stayed true to one thing and that is my strategy. Every single trade that I took, I had an extreme consistency behind every single trade. I understood exactly the type of trade That I was taking. I was reading market structure the proper way. I was properly having a trade hit my area of interest. I was having a trade properly giving my entry signal at the right time. Like
despite all the noise and everything going down, I stuck to one simple approach into the market and that is confluence trading. Having the trade makes sense. Now yes, was it fun? Was it exciting? Was it a crazy journey? Yes. Will I do it again? Maybe. I think that That person that I was when I started that challenge was not the same person that came out at the end of the other side. And the person that I am today is not the same person even when I finished that challenge because that just led me to understand
not only the markets in a different way, but that let me understand myself and just trading as a whole. understanding the opportunity that trading has to offer and the real raw way of flipping accounts, aggressive Trading, uh just just just being a fullblown trader. Just every single thing that I would wake up, eat, sleep, breathe would just be trading. There was nothing else that was on my mind for those three months of me completing that journey. And if there's something that I would take away from that whole entire journey, it would be that for you
to succeed in this, for you to do what I do in this or what other people are doing in this is that you need to do exactly That. You need to immerse yourself in this. Like this needs to be what you eat, sleep, breathe. I have so many people that come up to me in the public and they're like, "Hey man, like I I really want to have this this trading stuff as like a side gig. Like I want to have an extra source of income." I'm like, "Buddy, that's not going to happen." Like, trading
is not going to be an extra source of income for you. Like, you're either allin or you're not. Can it become an extra source of income in the future once you understand how to trade and how you do this properly? Yes, of course, 100%. But you first need to be all in how I was in that challenge to understand the markets and understand yourself on how to understand the markets. And then once you understand everything, you could treat it as a side gig because you get it. But you can't get something into you don't actually
get it. That is probably the biggest Takeaway that I took from this whole entire challenge is that I really en engulfed myself in the market as a whole. And if there's something that I now have so much passion for is not only trading, but it's getting other traders to understand the markets exactly how I do it at this point. I have students of mine now that they break down the trades and they not only break them down just like me, but they almost sound like me. Like they're literally reading the Markets. They're talking head and
shoulder. They're talking area of interest. They're talking shift to structure at the exact points where I do when I break down the trade. Sometimes some of my students I'm like I don't even need to teach anymore. Like you guys can do this for me because this is like speaking a language. Trading is not difficult. All you need to do is just simply learn. Something's not hard if you don't know it. But when you know it, You simply know it. For me right now, talking Chinese will be very difficult. But is it impossible? No. Will it
take me a year to be able to perfect it and be able to fluently listen to Chinese music? Yeah, I'm not going to get it right off the bat. But if I surround myself with a bunch of people that speak Chinese and are constantly communicating in it and we're writing it down and everything we do is in Chinese, I'm going to be able to grab it a lot Faster. And that's where I've been dedicating a lot of my time to lately. And it's getting these right people in the right environment to be speaking this right
language. The people inside of my community, my community is no longer open to the public. Like everything I've lit I like the people that want to learn how to trade and learn how to properly read the markets, like this is what YouTube is for. This is what this platform is for. It's for You guys to just go ahead and and have everything on one spot. That's what this is for. But the people that actually want to take trading serious and actually learn a strategy and be a part of a community, that's what I dedicate my
time to. back. I have a very very small circle of traders where I break down trades with them live. I get to review their trades live. People get to actually be on a Zoom call with me one-on-one. They get to open their mic, Ask me questions. These are people that are actually serious about trading. Like, if you want to know what trading is, how trading works, what is a support and resistance, what is a this, what is a that, that that's what my YouTube is for, and I will gladly do that for you. And you're
going to learn what everything is, right? There's nothing else that I can teach you what it is or how it really works. Like this is everything you need to know. Now, There's a very fine line in between knowing what something is and how it works and how to master it and use it in an every single day live real market example because by the time you're watching this video, the markets that you're seeing in these examples are probably months old, weeks old, maybe even years old. Depends when you're watching this video. But what isn't is
these live calls that I do with my students where we're literally executing The strategy and on very unique examples that are happening in the market every single day. The market's never going to give you the exact same pattern. It's going to be very similar. It's going to have a little bit of tweak here and there, and that's what I dedicate my new time to. It's getting these traders to the next level. Not only understanding the markets and teaching them the what's the hows, but it's the exact points when to execute it and when to not.
And I Made a very rookie mistake in my early years of educating people. And that's why I took a very big break for a while. And that's that I pretty much just let everybody inside of my community. I let anybody that wanted to join and be part of a winning community, I would just let them in because I wanted to help everybody and anybody. But there was actually a problem, right? Because all different types of people would be joining and just some people that didn't Really want to take it serious and wanted to make this
their their side thing. And if you're not ready to make this your full-time thing, I really don't want to be working with you because it just simply takes away from other people that do and people that are ready to dedicate all their time into this. So my my community is no longer available to just anybody. It's the people that are actually ready to be part of a circle that's going to be Executing this every single day. If you're not ready to execute this every single day, it's just simply not your time. figure out a time
when it's right for you because the last thing that you want to do is do something halfass and then at the end of the day end up quitting because you never gave your 100%. Just don't even start if you're not ready to do it. It's just it's just not meant to be. The timing needs to be right. You need to be ready to go Through these endless challenges and this endless journey that trading is going to go. And my students lately have been having the most insane results. Like for example, you can literally take Mike.
Mike took $1,000 into $130,000 while still working a full-time job living in Canada. And you can take Philillip, 22 years old, and he made over $30,000. Look, I I'm I'm not even going to just speak on this, right? I'm going to literally show you and let the Results speak for themselves. I have this I had, bro, I have so many testimonials of my students that I had to go create a whole entire YouTube channel just to upload the podcast in here. Like and these are just the ones that I end up making public, but I
have hundreds of podcasts with the thousands of my students that are part of my private community where I literally have to do this interview with them because I need to really understand what was that Took them from one point to another. Was it the way how they actually executed the market structure? Was it the actual entry signal? Was it the full confluence trading and using my checklist? Was it having me every single Sunday sharing the trades that I'm interested in taking and they're just following these trades? I saw a pattern. I saw a pattern in
every single one of these students that I have done a podcast with and having crazy results like making $180,000 in Two years, turning $100 into$10,000, making $62,000 in three months. I remember this trader, he has a cannabis business, he's part of it with a partner, and he made an extra $62,000 in three months. this student, for example, where he made $120,000 in one single year. And I literally made a bet with him when we did our first podcast and we did our our part one of our podcast right over here. And I told him that
if he came back a year later and he was More profitable than what he was, that I would give him $10,000. You can go watch this for yourselves. And I I literally paid my students $10,000 because I wanted him to trade my funds. and we kind of have a little thing going on where we do a profit split so on and so forth. The pattern that I saw in every single one of my students is they follow the strategy like if their life dependent on it and they dedicated 100% of their time to learning this
strategy. Learning the strategy takes time, takes effort and most importantly you need to prioritize this. Like if you need to eat, sleep, breathe trading. And if if you're that person and you're ready to take on this journey, I have some new spots that I'm opening to be part of my community. The link is in the description down below. You guys can go ahead and apply, right? You can't just join right now. Even if you wanted to, you have to be qualified to be part of My community. If if you don't qualify, you know, you can
you'll be able to talk to my team. My team will be like, "Hey, look, just let you know you're qualified." Or, "Hey, look, you're not qualified for this reason. You should go work on this or you should go watch this video first. After you finish watching this video, maybe come back and apply again." Right? We have a series of questions that will be able to determine if you're the right fit to be part of This community or not. And just if you're going to go apply and be a part of a students, be as truthful
as you can with the answers that you're going to answer because if you just answer something with little to no effort, we we're just going to completely disqualify you and not even remotely have any interest in having you part of the community. We have people that not only apply once, they apply twice, three times, and they find multiple ways to Get accepted. And trying to just find a hack to get in, that's not going to work, right? Like my team goes through a very strict process to accepting people to be part of my community. If
I'm getting on a Zoom call with you on a one-on-one basis and I'm going to be breaking down your trades, if we're going to be reviewing your trades, like I want to make sure you're the right person and you're worth my time, right? And just being fully honest, like I I Don't need to teach more people. I need to teach the right people because my goal is to have the most successful trading community and eventually build I want to build a trading floor and I have a lot more plans that I have in the future
and I need the right people to be part of this circle for me. And if you care to be part of this community or it spikes your interest, once again the link in the description is down below. Read the application, watch the video Before you watch the uh before you actually fill out the application so you understand what you're getting yourself involved to. If you're not ready to give your 100%, do not even remotely think that this is the right time for you. Once you're ready, once you understand and you have a clear understanding and
you've seen this video maybe once or twice, then go ahead and hit that apply button because we want to make sure that you're the right fit to be part of this Community and we can actually take your trading to the next level. And this is somewhere where not only do I teach you how to trade, but I teach you how to trade from 0 to 100. So, I'll give you the exact full blueprint exactly what I have just shown you here, but a much more defined version of it. You're also going to be part of
a winning community where there's going to be other successful traders inside of this community that share the trades that They're taking every single day. I'm personally in there engaging as well. You can ask questions directly to me inside of this community. You have the famous Sunday swings where every single Sunday and once you join you're going to see the recordings of all of the Sundays that I've been doing for the last three years where it's over 150 something recordings of me literally predicting the markets every single week and I am literally getting on a Zoom
call every Single Sunday sharing with you the top trades that I am interested in taking for the week and why I am interested in taking these markets because I'm literally explaining to you this market is good because of X Y and Z and this market is bad because of X Y and Z. So all of your efforts are on the right market and you're going to execute the strategy on the right market. The pattern that I saw with these students that led them to not only succeeding Because of the strategy is this because they are
part of a winning circle and they are currently following the proper markets that they should be following. And you can also get access for me to review your trades where you get to get on a one-on-one with me and I get to better understand why you're making certain mistakes on certain trades and how we can actually fix that because everybody has different mistakes in their journey and they're executing Things correctly in some areas but incorrectly in some areas. And since you're by yourself in your office and you don't have somebody there to correct you, maybe
your family, your siblings, your cousin, they just don't understand what you're doing, they just simply don't get it. and you need somebody that not only knows how to do it, but has taught thousands of other people that know how to do it and have become very successful from it. So, if you think This is the right fit for you, hit the link in description down below. We would love for you to be part of the community if it's the right fit for you. If not, check out some more videos. Get a little bit better understanding
of how trading works. Get a feel for it. Make some mistakes, make some money, lose some money, get get that urge of view of actually executing a trade out. And if it's something that you still want to pursue and despite you getting beat up Sometimes and still something that you want to take on a challenge, come back and hit the apply button and we'll see if you're ready to be part of the team. If you watch the video all the way to this point, all I want to say is that I truly wish I saw
one of these videos when I started my journey. I cannot stress to you how many videos I saw endlessly inside of YouTube just searching the internet what certain things were and how to piece everything Together. And it was honestly just a nightmare. And you know, looking back to it now, I don't regret my journey one bit. And I definitely don't wish I had it another way. But having a video like this and having a mentor like what I'm doing now would have definitely facilitated everything and would have saved me a lot of time. And maybe
a couple of my buddies that started this journey with me, they would have not quit and they would have not made so Many mistakes where it led them to quitting because they just got overwhelmed and didn't see the the light at the end of the tunnel. it didn't make sense for them to continue to push because there was just in their eyes there was just no real reward for the risk that they were taking. And you know, you guys watching this video, you're extremely fortunate and I I just want to say thank you for watching
this video to the end. If you guys have not Hit that like and subscribe button, do that at this very moment right now. Hit that like and subscribe button. If you're watching this video in the future, you know, a couple month couple of months from when it got uploaded or even a couple of years from when it got uploaded, all I can say is that you are not too late to get trade, like you're not too late to get involved in anything. Whether it's just your first trade, whether it's a new strategy, Whether it's just
re-watching this video, like the markets are not going to go anywhere. As long as we have currencies around the world, we will have a market. Whether it is a digital currency or whether it is a actual currency, the markets will be there. The opportunity for you to make money is going to be there. Don't get FOMO thinking, "Oh my god, I have been wasting two years of my life at this job when I could have learned this or I Could have been doing this instead of being at college." Don't get FOMO. Yes, did you miss
out on opportunities? 100%. But a lot of people have made money from the opportunities that have just passed by. But that doesn't mean that there's not new opportunities coming into the market. The markets are not going to go anywhere. I always look forward to tomorrow and the opportunities of tomorrow. I never look back at the opportunities that I missed because I Wasn't part of that. It wasn't meant for me. It just simply wasn't my time. And I know there will always be a tomorrow and there will always be another opportunity. So, it's not too late
to get started. And if you do get started, don't try and catch up for lost time. That is how you simply put yourself into a deeper hole that can be very very costly and very difficult to get out of. So, hope you guys enjoyed this video. You guys once again have not hit that Like and subscribe button. Hit it. And uh make sure to watch any other videos. If you want to be a student, apply down below. And I hope you guys enjoyed this video. I'll see you guys on the next one. Take care, guys.
Bye. Oh, oh, oh, oh, and by the way, by the way, most importantly, whenever in [ __ ] doubt, set them for good voice. They care. See you.
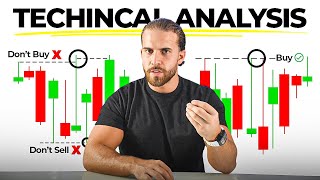
![Rich Dad Poor Dad - Robert Kiyosaki [Complete Summary ]](https://img.youtube.com/vi/jFNdARDCrKA/mqdefault.jpg)