Hello and welcome back to Bravos Research. This is your host Peter. Today we have a lot of very interesting developments to talk about.
We're seeing some big moves taking place on the precious metal. Silver down 17% today with this spectacular blowoff top coming to a violent end as we had talked about. When you see these types of very aggressive high rate of change to the upside typically translates into a high rate of change to the downside when that move comes to an end.
So we're going to talk about that. We're also going to talk about the volatility that we're seeing on the stock market. There's not nearly as much volatility as we're seeing on precious metals, but a little bit of a pullback here on the S&P 500 index.
And that's being accompanied by a move up on the price of oil. So, it is something that we want to be monitoring. We want to be looking at quite carefully, understanding what's driving this move, and it is going to be something that we need to watch over the next few weeks because it could change how we're looking at the market in the in the short to medium term.
So without further ado, let's get right into it. I think the best place to start is with oil because this has been the foundation behind today's bull market. The price of oil coming down and generally being stable has put downwards pressure on inflation data.
It has put the bond market at ease, which is why bond yields have been very very stable over the last few months, the last few years really. And that's helped. That's really been the foundation again of the S&P 500's bull market since the low in late 22.
It's been a disinflationary bull market. So oil is by far, and we've said this again and again and again, this oil is by far the most significant variable to pay attention to in the present day if we want to be building an opinion on how we're thinking about stocks, how we're thinking about valuations, how we're thinking about the bond market and earnings. Right?
So very quickly, how are we approaching this? First of all, from just a momentum standpoint, and momentum is very important in order to make sure that we're not reading too much into shorter term moves, right? Because in bull markets and oil and whether any asset class really, you're going to have pullbacks along the way, right?
In an uptrend, you see stair steps along the way. And yes, there are reasons for why you're going to see certain pullbacks along the way, but it doesn't mean that you should be reading too much into each and every one of these, thinking that there's going to be a huge reversal. You really want to see momentum and understand what the momentum is along the way and whether that trend, that momentum is being called into question during these pullbacks.
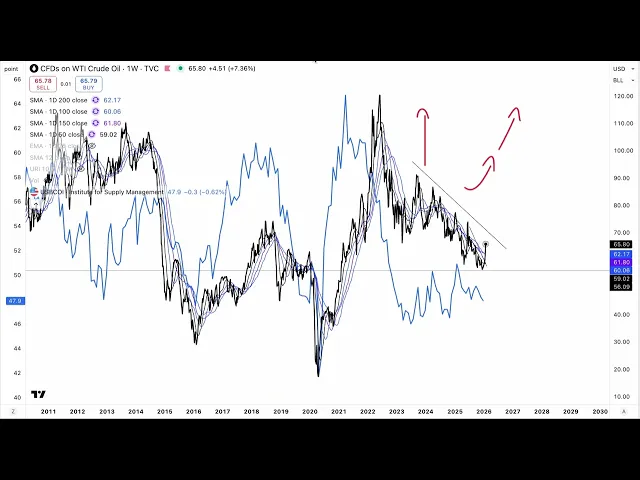
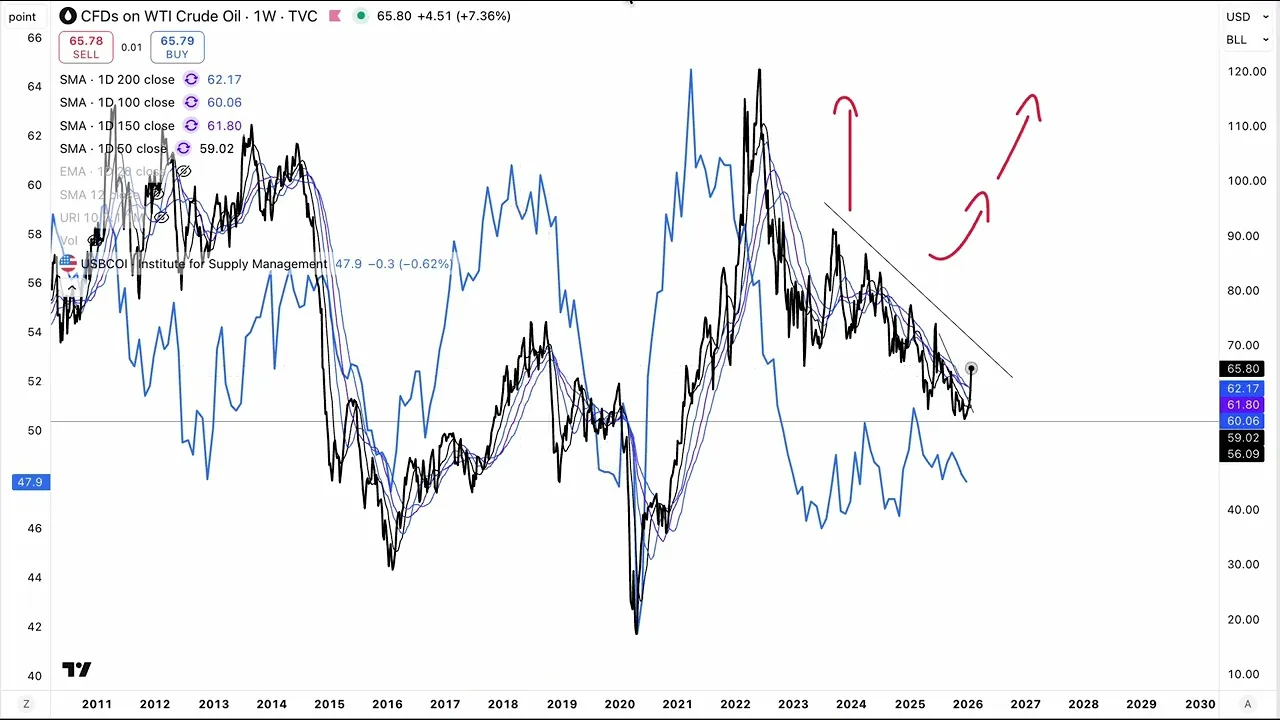
And you can see that if we add the moving averages here on the bullish front, momentum flipped bullish in November of 2020. And between then and until about August of 2022, the momentum was very much to the upside on oil. Since August of 2022, we've generally had a downwards momentum on oil again, which has helped all of those things that I talked about earlier.
We're not going to be too worried about oil until we see a real shift in momentum, right? And so that means probably needing to see some kind of a breakout here taking place. People have been worried about oil spiking.
In each and every one of these spikes, there were countless opinions out there saying that oil would go to $120, $150 a barrel. And yet, every time oil prices came back down because a lot of the times, and for example, back in June of 2025, it was geopolitical news. I believe January of 25 was also geopolitically fueled.
And so in both of these instances and October of 23 as well, geopolitical tensions in each and every one of these cases, geopolitical tensions cooled back down and oil prices snapped back to the reality of the supply and demand that was generally structurally taking oil prices down. Now there is the potential for that to come to an end. We're not stuck on the thesis of oil needing to come down.
In fact, when we take a look at copper, for example, we add copper on top of oil. This is a great intermarket relationship between the two. They very much go in line with one another as you have industrial demand pick up.
You have copper prices that rise and typically that's accompanied by price of oil that's rising as well. As you can see, we've had a spectacular divergence build between the two. It's not the first time that we've seen this, right?
But typically you do see these types of divergences snap back. And so it would not necessarily be a huge surprise to see oil beginning to curl back upwards. Now, is that the end of the bull market if that happens?
I think that's a little bit too early to say. Not necessarily. Is would be my first answer.
And the reason for that, you can see there are multiple examples here of moments where oil rose along with the S&P 500, right? And one of our biggest narratives right now is actually that we are going to see industrial demand begin to pick up and that could generally pull the price of oil higher. Right?
Now, there are supply issues in regards to that and in the sense that there's a lot of oil production right now and so that's generally pulling the price of oil down. But in a real industrial recovery, you're going to see the price of oil moving higher and that's not necessarily going to be a bad thing for stocks especially at the beginning right the way that typically happens is you see let me add the ISMPI here so yeah you can understand more properly how this actually work in the initial stages this is the manufacturing sector very very cyclical and highly tied to the performance of earnings in the S&P 500 index in general that oscillates as well up and down along with the ISMPI. And so generally you have the S&P 500 that is rising as the ISMP PMI is rising.
And typically that does put upwards pressure on oil, right? What it also puts upwards pressure on is the Fed that begins to raise rates in response to higher inflationary pressure and the higher the price of oil goes, the more that also eventually puts downwards pressure on growth in the future. Right?
To put it very simply, actually a kind of a mean reversion, a mean reverting mechanism where you have the seeds that are sewn for the economy to recover and the manufacturing and industrial sectors to do well. That causes the price of oil to move higher which puts downwards pressure on the economy and then it cycles back down. This is why you see this oscillate up and down up and down.
It's one of the reasons for that is because of the price of oil that responds to the strength and then by the fact that oil prices are high. It leads to a cyclical downturn in those same metrics either by the sheer force of oil being high and that squeezing consumers and putting upwards pressure on business costs as well, but also through the Fed, right? That for example in 2018 that was raising interest rates and that was creating concerns around growth.
So in the short term, you know, we're not extremely worried about oil rising. This is why we're also not saying that we're going to be doing any kind of 180°ree turn on the way we're looking at the stock market just because of a little bit of a bump in oil. If we see a rise in the price of oil along with a pickup in the manufacturing numbers, that would overall be a pretty good thing for the market as you're going to see those earnings, right?
Those earnings that have been fueling the market higher, they're going to continue moving higher. where it will become a concern is when it goes too far, right? And that the Fed starts to respond to that and that's when all the things that have been pushing the market higher in this phase start to deteriorate and even reverse.
It's not unlike what we had for example in the 1980s. Let me zoom out to give you a good example of that. I would suspect that we follow somewhat of a similar path to what was happening back then.
You had a large drop, obviously a little bit more severe than what we're seeing today on oil, but still nonetheless the same type of directional impact on the economy. Large drop in oil in the mid1980s. As this was happening, by the way, this was super bullish for the market, right?
Let me show you the S&P 500 back here. This was incredible for stocks because it allowed the Fed to cut rates very significantly, propping up valuations, boosting consumer spending, boosting expectations around growth. And so this disinflationary environment was really good for the stock market that melted up in that period.
Now, as you can see in 1986, in this period of volatility here, you started to see a shift in the macro environment that was still overall pretty constructive for stocks. And the reason for that is because all of the things that had happened here that set the stage for an economic recovery fueled an economic recovery where the ISMP PMI did move up and so the stock market moved up in response to that. But what happened in 1987?
Well, inflation was starting to see some upwards pressure because of higher oil prices and the Fed started to raise rates in 1987 and that spooked the markets leading to the large decline. So I would really not be surprised to see the market follow a similar template today which means we could be in terms of oil we could be around here right we could have seen maybe a temporary bottom in the next few months and by the way these are multiple multiple months right so from September 1986 right up until well a year later really 12 months of the oil prices moving up along with the stock market it would not surprise us to actually see that type of scenario which could mean that oil breaking out and seeing some momentum coming back. It's something that we could take advantage of in the next month or so again depending on the price action.
So I hope this section makes sense. A lot of different moving parts, a lot of different concepts. We're trying to distill it down to the most important concepts and also trying to compare that to relevant historical episodes.
But long story short, this is something to monitor. If it persists, it could mean that we're seeing a shift in the story from a disinflationary bull market to what's called a reflationary bull market in financial jargon. It's called a reflation, right?
And generally reflation is good. Now, what's also relatively reassuring here is the 10-year government bond yield long duration. US treasuries are very stable right now despite all of the worries about Japan, all of the worries about uncertain capital wars and geopolitical risks.
Right now, the truth is bond market is not getting too concerned right now. Now again, this is why if oil prices rise too quickly, it could start to become a little bit of a risk for the market because you can see oil prices do tend to be very much correlated to bond yields. And so, you know, seeing something like this could lead to a spike in yields and that will definitely be a scenario that drags the stock market down.
But for now, the bond yields are very stable. They're not too concerning. And what's also quite reassuring is that the short end of the curve, so we take a look at the 2-year yield, it has been moving down since the Fed meeting.
So, it seems that overall the market is perceiving the Fed's most recent press conference as a generally dovish stance that can allow especially the short-term rates to continue moving down. And again, you know, this is core part of what's been driving the stock market bull run, right? The 2-year yield stopped rising in October of 2022.
Right here, that's the moment where the 2-year yield, it didn't peak there, but it stopped rising there. And that was the very bottom of the S&P 500. a bare market of 22.
It's been all about the Fed keeping rates stable and generally cutting rates. That's been the big theme and that's not being threatened at all by this recent move on oil. When we take a look at the VIX, the VIX has been trending up and this is one of the things that has kept us a little bit more on the cautious side in the short term.
We don't necessarily like to see the VIX spiking. We love low volatility environments. We love environments where the VIX is trending down.
That's really the moments where we start getting more and more aggressive. That was certainly the case in this period here between well from that low in November where we got that big VIX crush here. That was super constructive for the market.
We initiated a lot of trades there and shifted our defensive posture that we had well since I believe October. I don't remember the exact date where we started to really get defensive, but from October till this VIX crush, we had a generally defensive stance. Since then, we've generally been aggressive, but this VIX increase is the only thing that's making us a little bit more skeptical.
On its own, it's not enough of a signal to really say, okay, we're going to cut our allocation, but it's not the ideal environment. What we've talked about on the other hand and what is still quite constructive is if we look at the bond market volatility which tends to be quite correlated to the stock market volatility. Bond market volatility is still very low.
So we have kind of a divergence here between stocks that have been more volatile and bonds that have been less volatile. We think there's a good chance that the stock market volatility catches down to the bond market volatility. So, in terms of basically financial conditions, in terms of short-term narratives, there's not a whole lot that we are concerned about right now.
We definitely don't think that we're seeing any signs right now that the bull market is being derailed. That being said, with rising oil prices and what I talked about earlier, the little breakout that we have on bond yields, that could see a little bit of upwards pressure, especially if oil continues to move higher. Can that trigger a little bit of a 3, four, 5% correction on stocks?
That would also not be surprising and it would not be the end of the world either, right? It would generally be something that perhaps stops out a couple of our positions, but something that we would want to look to take advantage of on the recovery. Also, keep in mind, yes, the S&P 500, it looks heavy, right?
It looks like it's struggling at all-time highs, but when you look at the RSP, which is the equal weighted S&P 500 ETF, it still looks really, really strong, right? So, clear uptrend here. Strong momentum, right?
Bull market moving averages clearly pointing upward. So, this is a bull market, right? This is a bull market in stocks.
And yes, you can see pullbacks within bull markets. That can happen as you see uncertainty spike along the way. That's absolutely natural.
When you take a look at the NASDAQ 100, it's battling around that big resistance here that we had highlighted as a key level to clear. We'll see if it's able to kind of hold that level. That would be quite important for us in terms of our shortterm outlook on the tech sector.
We would want to see this hold. If not, that looks like a false breakout or it looks at least like indecision and not the most ideal thing. So, we do want to see in the next few trading sessions the tech sector to be able to hold this breakout and that would get us more constructive on the short-term outlook on the NASDAQ 100.
And by the way, the semiconductor sector, despite all of this, again, doom and gloom, all of these concerns, the geopolitical risk, the yields, the oil, despite all of that, semiconductor stocks have been so resilient, so strong. We just closed our position in quite a timely manner. By the way, we closed our position on KAC this morning that had been melting up here.
It was only a weight of two, but it was still a good gain from when we had initially entered that trade. We obviously have other semiconductor stocks like AMD that's down 4. 7% today.
It's very volatile stock. So, the grand scheme of things, this is not a particularly worrying development here, but we would want to see this pattern to hold. If it holds and it's able to make its way back up, as we mentioned earlier this week, this would even be a trade that we would look to add to upon a breakout to new alltime highs, that would be really constructive.
But in the short term, we do want to see these levels of support get held. Otherwise, the structure in the short term looks a little bit more vulnerable and we'll cut out the position if it crosses the red line and keep the stock on our watch list for potential re-entry. Now, let's move on to gold.
Gold down 7. 5% today. As I mentioned earlier, silver down 20%.
Is it the end of the precious metal bull market? No, I don't think so. But it probably is the end of a shorter term period of very strong momentum.
That's certainly possible that this is marking the end of it. As I mentioned earlier, it's not a huge surprise to us that this is happening. It was starting to look more and more bubbly.
The sentiment was getting euphoric. A lot of people piling in on the gold trade, feeling a lot of FOMO regarding the potential for gold to go much higher. We saw some spectacular moves up.
So, it's not a surprise that we're seeing a violent pullback. And it's one of the things that also kept us on our toes regarding that is this chart here of the cash levels. According to the Bank of America Fund Manager survey, the cash levels were at 3.
3% which is the lowest level on record going back to 1999. So this is very much a symptom of not just the stock market rising but also gold rising and this narrative of the debasement trade fact that everything is essentially rising relative to the US dollar and it's completely ridiculous to keep any type of cash and so everyone was piling in on the gold trade and the silver trade. So what does that mean?
Where am I getting at? It means that the positioning in the short term and the positioning sentiment is very much in terms of it determines the short to medium-term cycles up and down, right? When position is very elevated, that's tends to coincide with local peaks because that's the moment where all you can do, right?
If everybody already owns gold, all that can happen is that those people that hold gold sell their gold and creates a little bit of volatility. And then when positioning is underweight on that asset, the opposite happen. Nobody has enough gold.
And so the most likely scenario that can happen is that gold gets pushed higher as people buy back in and re increase their exposure. And so we've been in essentially in a period where sentiment was overextended. Sentiment and positioning in no way impact the underlying macro, the underlying fundamental story.
It just determines what is going to happen in the shorter term. Right? But underneath the surface, you have this broader theme and the position is going to cycle up and down around that theme.
And so that's essentially the way we're looking at this correction on precious metals. In no way do we think this is the end of the bull market on precious metals. We think this is going to be very likely a decadel long bull market in precious metals.
But we've had a spectacular run already over the last few years. It would not be surprising to see multiple months, even a full year of consolidation here on gold. That would not be surprising.
I would not expect a very large draw down. I would generally expect something to the extent of what we had in 2006, right? Very similar blowoff top and then generally a consolidation for a full year, right?
Blowoff top started took place here in May of 2006 and the consolidation ended in August of 2007. Did that derail the overall bull market? Absolutely not.
Right now, this volatility that we're seeing on the precious metal space is also filtering the copper trade that we have and the aluminum trade that we have that are also both seeing some pretty wild moves today, although much less severe, right? Aluminum down 2. 3% as opposed to that 20% drop on silver.
Copper is a little bit more consequent. It's 4. 5% drop after a really large breakout here that seems to be being retraced.
From a macro standpoint, we're not yet too concerned about base metals. In fact, this is kind of what we've been anticipating. We've been saying that gold and silver have been overextended and and quite risky in that the price of copper and base metals that are very much benchmarked to gold can actually catch up, right?
And when you take a look at the copper to gold ratio, you can see there's something quite interesting that's actually taking place here on the weekly chart. You have a really large candlestick tail right here. And to me, from a price action standpoint, this is a bottoming process and could suggest that we've just seen kind of a double bottom or kind of a retest of the low on this copper to gold ratio.
And the reason this is important, first of all, this has been our bias because we're towards the bottom end of this range that we've been trading in on the copper to gold ratio, but also because of what we talked about earlier and what we've been talking about for a long time now is this potential for the ISMP PMI to turn up. And it's not unfrequent to see these types of bottoms occur with large capitulations. And this is kind of what we're getting right here.
It's a violent end, but it would not surprise me to then see this copper to gold secular decline turn into a broader uptrend in the copper to gold ratio following this kind of spike. And if we take a look at the price of copper, what happens to the price of copper? When the copper to gold ratio rises, obviously that's a good thing for the price of copper.
That's when you see the largest moves up in copper. So here we've had the price of copper move up with a falling copper to gold ratio. If we're right about this being a turning point for copper, for the copper to gold ratio, then it could mean that this breakout could still be in the midst of taking place.
So, we'll see. Obviously, you know, we could get whipsawed out of our position with the volatility on the precious metals front. That would be unfortunate, especially copper is still at the top of our list in terms of our preferred assets here in the next few months.
And this situation with the precious metals doesn't change that. It's in these periods of high volatility where you see large moves, large blowoff top investors, the markets are indiscriminate. They basically lead to a sell-off across the board on that sector.
The same way a correction in the stock market can make a very very fundamentally strong company decline as well. Even if a company is supposed to based on its earnings, based on its profitability, growth, all improvements on those metrics, if a company is supposed to be rising, a correction in stocks will lead to a little bit of volatility on that front. So, it's the same kind of mechanism that we see when these types of large moves take place on the precious metals front.
Now, if you enjoyed this video, make sure to let us know in the comment section down below. It's always very much appreciated. If you have any questions, comments, feedback, make sure to also leave those in the comments section.
I wish you all a very happy weekend. We'll see each other back on Monday. And thank you for watching.