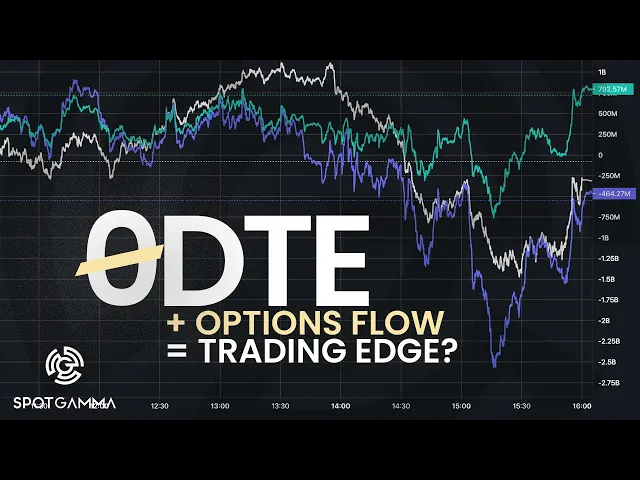
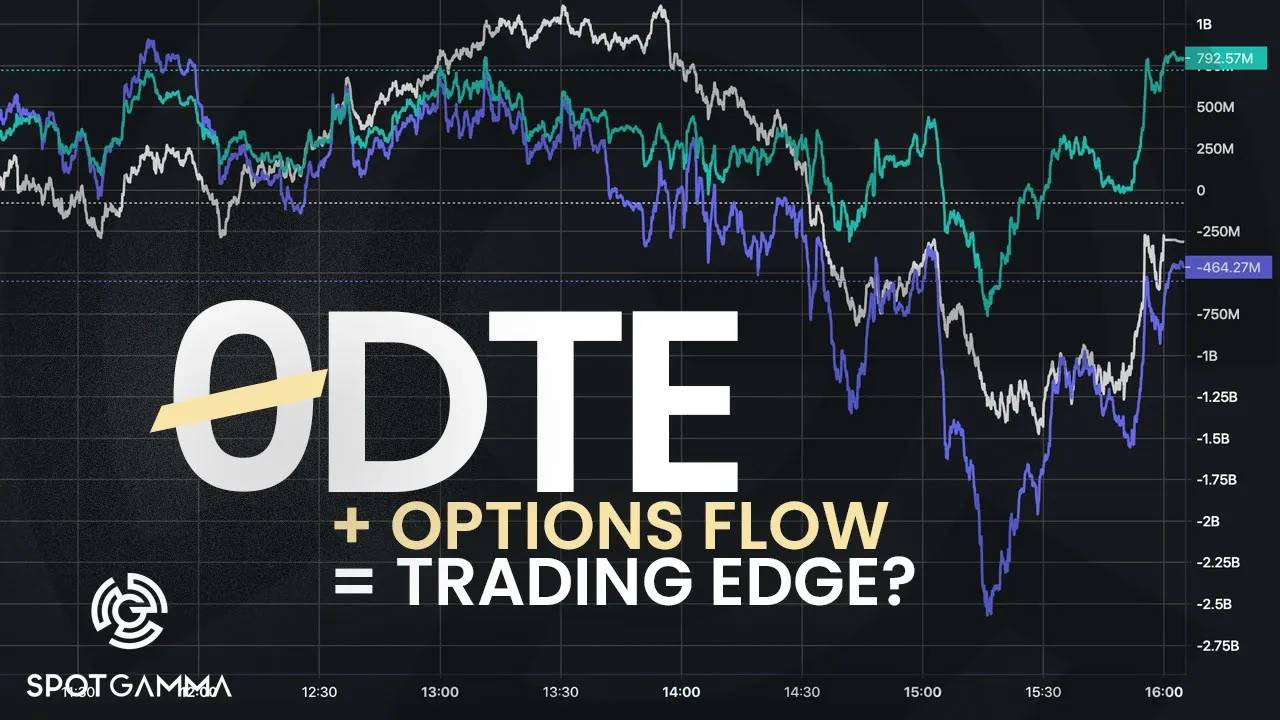
on your screen here is our hero indicator which is one of our most popular algorithms here at spot gamma and what you're looking at specifically is in white we have the price of the S P 500 and then purple we have our actual hero indicator now what the hero indicator is is a measure of hedging pressure so as people in real time are buying calls and selling puts uh in various stocks and ETFs and indices we estimate the hedging pressure and the idea is that as this purple line moves higher that tells us that dealers
and market makers may have to start buying stock and then if the purple line starts to go lower that suggests that dealers and market makers may have to sell and so the interesting thing here is that this allows us to also break down the options flow in a variety of different ways and allows us to construct a narrative to understand what may be driving the market now on the right access here is actual dollars notion of hedging pressure and when we're looking at this specific chart this is our S P 500 combined signal so this
looks at all of the flow in the SPX index spider ETF XSP which is the SPX index Minis and then of course last but certainly not least the ESF those are the E mini options uh it's a real new addition here the es e-mini options it's been a tremendous addition to the algo now this is from yesterday the 20th and one of the questions we are always getting is hey I don't quite understand how to read the hero flow how can it help me in trading well there was a great a couple of great examples
posted yesterday so first what you can see is as the Market opens there's this big pop in the hero signal which tells us that on the open people bought calls and or they sold puts and as the market picked up into the 4130 area that flow kind of shuts off right the options Market basically just kind of uh walks back its flow and things get a little more quiet and as you can see um the s p basically Trends sideways right so the options flow gets a little quiet and I say that because we're pretty
much range bound you have a huge pop here and there's this kind of just gentle selling pressure until about noon and then what you can see here at noon is that the S P 500 actually moves quite sharply higher to 41.50 now 4150 is a big resistance area for us if you read our daily subscriber notes and what's interesting to me about this is that the options flow is not buying that high and I say that because the purple line the hero indicator is very flat in through this entire period so this tells us that
hey look if there was calls being bought here you would see the hero line or hero indicator moving up now to this point not every single Market move is driven by options flow our goal here at spot gamma is to highlight or inform you as to when we think options are the driver and so for that we want to move to the to the final kind of uh action for the day where you can see the market got very weak and initially the options Market didn't pick up on that but right here around 230 you
see that put flow pick up and I say it's put flow because the indicator is moving lower which suggests there's put buying and you can see that all of a sudden very much the hero indicators extremely in sync through this period with the options with the underlying Market excuse me and so you could see that this particular downdraft here at three o'clock to basically 315 it's very sharp it's about a 20 or 30 handle Decline and there's a lot of put activity in that time frame and I say that again because you can see how
close the options flow in purple is matching the underlying flow in white now at 4115 we're having a discussion about this on Discord 4115 is interesting because that's basically spy 4110 4110 on this day April 20th was a major support level again we talked about this in our subscriber notes and so a lot of people are sitting there wondering should I buy the dip at this point should I maybe sell put spreads because volatility spiked a little bit how can I play this should I play for a bounce or do I think the Market's going
to break the support and drop lower well well what happens is the hero flow shows us that Traders are suddenly selling options or buying calls and you could tell that because this purple line starts shooting higher rate at critical major support in the S P 500 right that spider 410 level and so this is informing us that other options Traders are closing their short positions or they're taking long positions they're betting on a market bounce right or they're monetizing their positions the implication is that we think options dealers and market makers in turn have to
buy stock or buy Futures and that should lift the index up and so what you can see is that as this flow bounces this options flow bounces you see the white line which is the S P 500 price find support and then eventually into the close you just see a ripping right just a giant rip higher back to 4130 where the market closed and so we see these types of divergences all the time and they're interesting not just from a flow perspective but also just from a sentiment perspective right how are other Traders treating this
one of the other things we want to show you here there's a lot of people who understand the implications of zero DTE these days in our indicator what I just did here is I chose the next expiration and what this is showing you is just zero DTE flow in the S P 500 you can do this for individual stocks as well but what is fascinating in this case is that when you zoom in a little bit I make this flow expand the axis what you can see on the decline is there's a lot more the
purple line drops a lot more relative to the green line now the green line is obviously the zero DT indicator so there's a fair amount of zero DT negative Delta or negative hero options flow it tells us that 0dt is selling calls and buying puts but the fact that there's a larger magnitude in the purple line which looks at all expirations tells us that people are probably buying longer dated puts in this case right because longer data puts don't obviously show up as 0 DT so that's very interesting from a senate perspective because as we
sit here the vix just hit a a one-year low right the fix is around 16 after having been in the 20s so it's interesting that people are buying these long-term puts um and then second what happens is there's a huge response in 0 DTE to buy that dip right so the magnitude of the purple line off the bottom to this high is almost the same as the magnitude in this case from the Dip up to the close of the day which tells us that the market really bounced here because of zero DTE flow it wasn't
necessary that you know longer term investors found value off the 410 but we did bounce because of that zero DTE so the fact is that we now have this in the back of our mind that look some people took the opportunity off of some of these fed comments to buy longer dated puts and the reason that we really rallied so strongly was because of zero DTE not because we hit this maybe major low in the markets that people were buying long-term flow for so that's a lot of great information I think and should help you
again really inform your trades now if you have any questions on the hero indicator you can hit us up at info spotgamma.com if you're interested in trying this out head over to spotgammon.com And subscribe to a free trial of the alpha subscription that includes our hero product and then you can also see more of our videos here on YouTube and then also spotgamer.com and so we look forward to seeing you in the spot Gaming Community in the near future