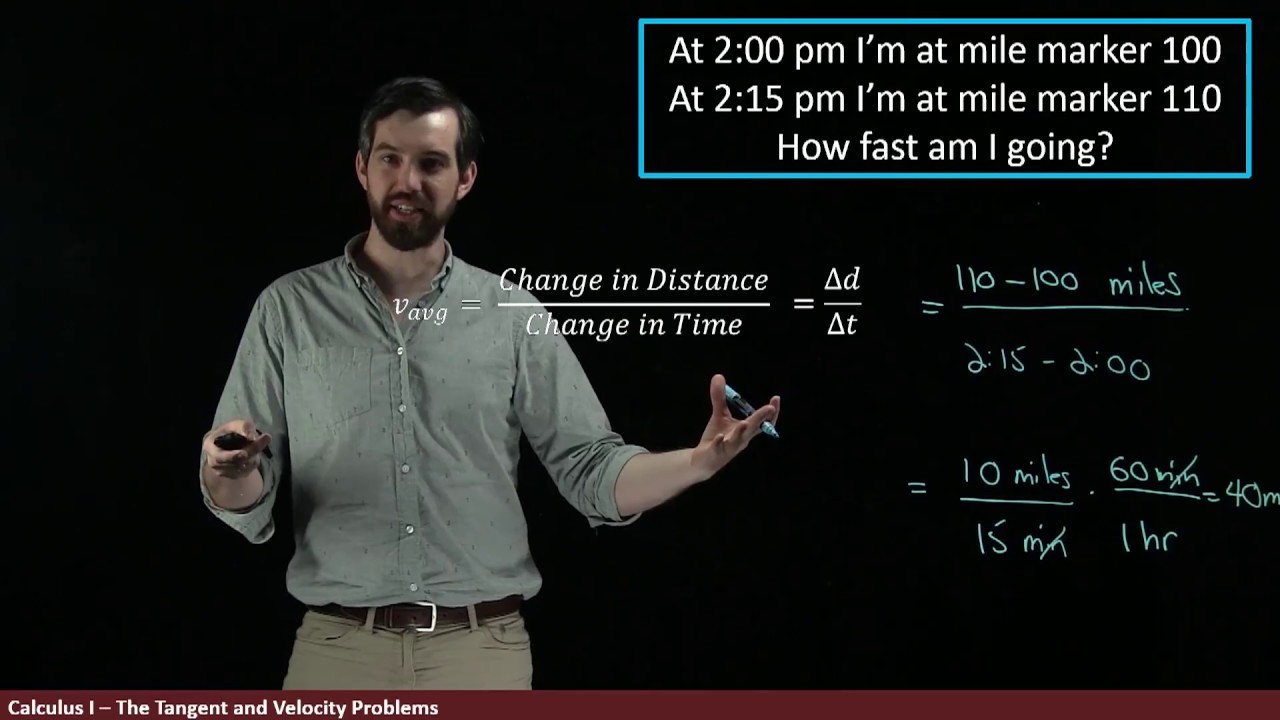
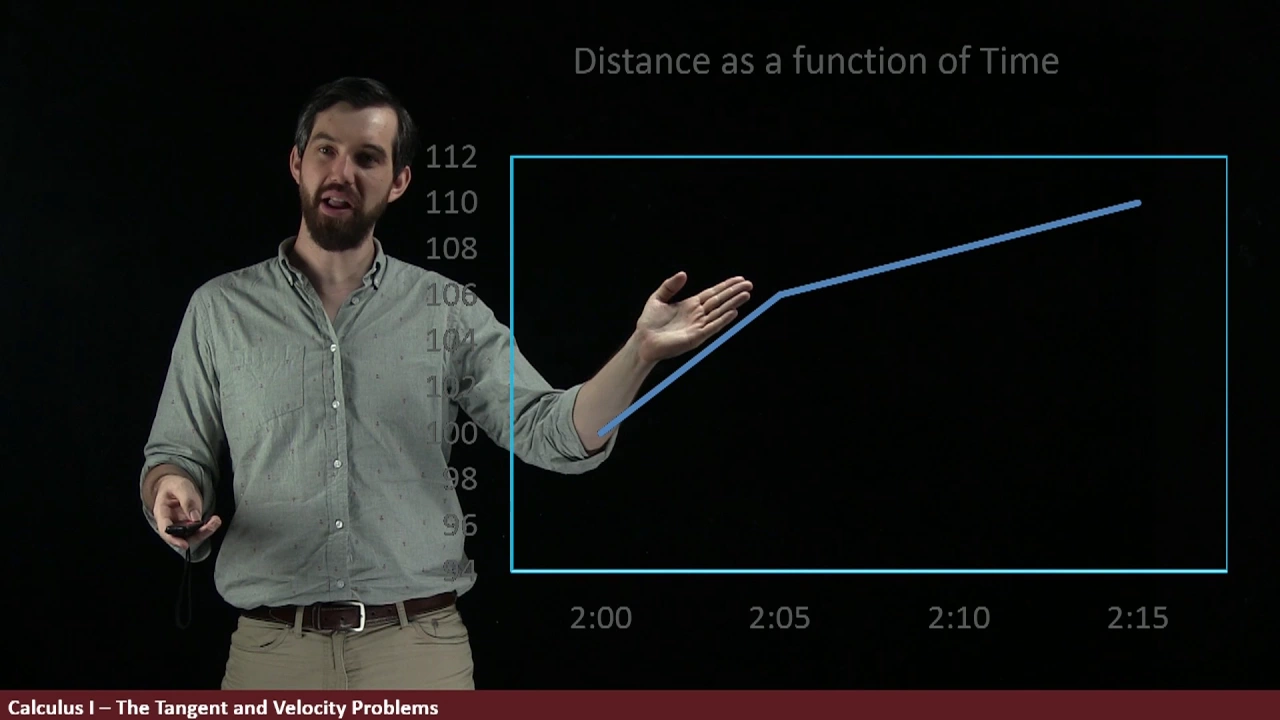
let's try to translate our velocity problem into a geometric picture I'm giving you an example of a graph the distance as a function of time that represents the same example we saw before so that at two o'clock here that our car is hanging out at 100 mile mark and that over here at 2:15 we're going to be up here at 110 mile mark and what we have is distance as a function of time going up in this straight line so let's try to figure out what the average velocity is well the change in distance and
the change in time are given here we've got time down here on our x-axis and we get a change in time between the two o'clock and the 215 that's our fifteen minutes and then likewise we get this delta T over here that's going from 100 miles up to 110 miles so it's a 10 mile difference so we do the same computation that we can say that the average velocity delta T over delta T is equal to 40 miles per hour another way to think about this is this is the same thing as the slope of
this particular straight line here the average velocity is the slope of that straight line now because the slope of this line is con just one line it turns out that if we did different intervals we would get the same result so for example if I chose this smaller nodes the same line the same story here but it's just that I'm choosing a much smaller interval through my delta T and then I get a different delta T out of it but it's still 40 miles per hour or I could choose two other points like how will
these ones down here the same story doesn't matter how big of an interval I chose it doesn't matter where I started and where I finish it with this straight line we're always going to get an average velocity of 40 miles per hour so this graph it represents if I'm driving along exactly 40 miles of miles per hour I'm not accelerating not decelerating I'm just going along at this constant velocity that's what this graph would look like but this is not the only way that I can get between the starting point of two o'clock at 100
and the final point of 215 at 110 so for example this is some other graph we can imagine a car trying to drive in this particular way and then what fedders is that down here at two o'clock right a hundred and over here at 2:15 were up here at 110 so this is some path that our car might like to take to go between these two points that we've recorded and then we could imagine a whole bunch of these maybe this is another one this is one that that we call piecewise linear here it's not
truly physical could that has some sort of smooth acceleration in the middle but it's going at one velocity for a while and then instantaneously turns into a different velocity now what you could do is you could try to measure the velocities for these different components so for example first up I might try to have it that I do in a delta T over a delta D for this smaller portion where I have this particular slope and if I did my rise of where I run if I did my delta T over delta T I get
72 miles per hour I went often computed it on the side or I could do this next portion where it's got this other slope and we can see that here in the delta T and the Delta D if you took that ratio it was going to be much slower 16 miles per hour so what this sort of imaginary car is doing is its driving way faster than 40 miles per hour for a while where the spoke is steep and then we slower than 40 miles per hour where the slope is a little more shallow but
the average over everything the the big delta T and Delta D that's the same 40 miles per hour that we always had so here's the point when we talk about an average velocity it really really matters where I'm talking about what's my starting point what's my finishing point if I use this starting and finishing point very different than if I use this starting and finishing point and very different if I use the entire thing you get these different results for average velocities now let's get rid of a bunch of the mess here I'd only want
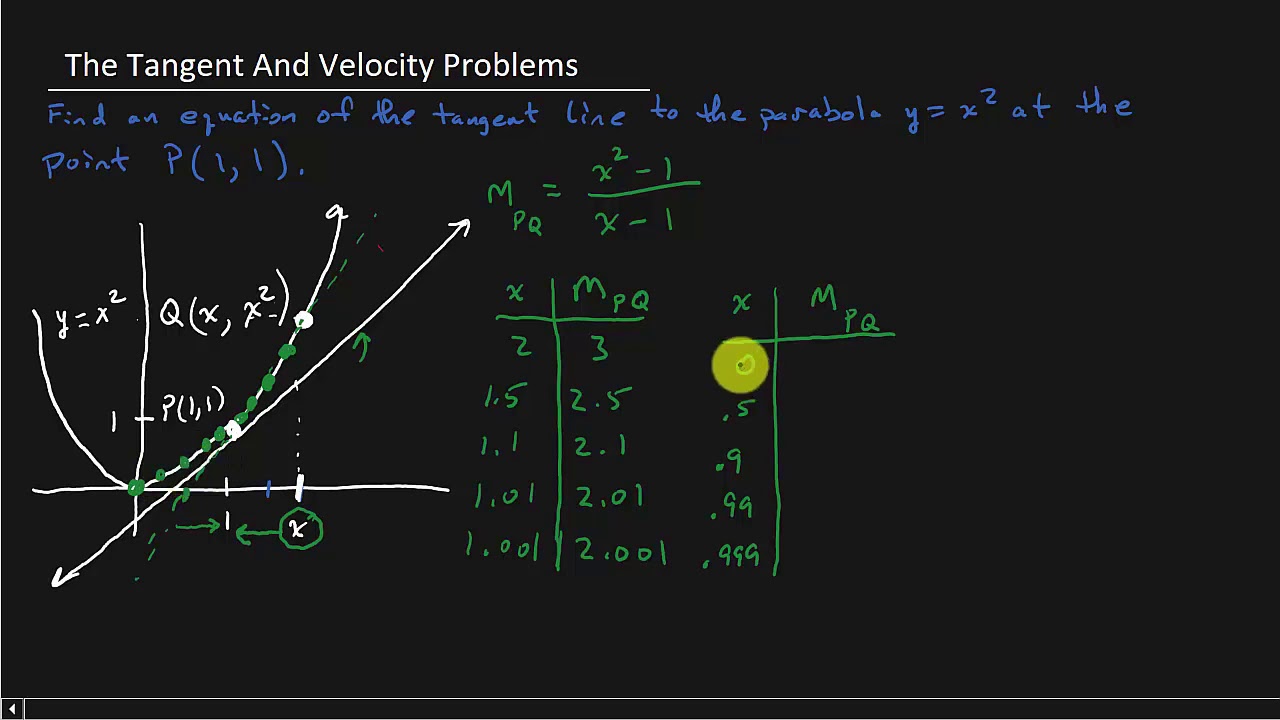
to focus on is that if I just keep the larger Delta G over delta T but I could imagine that there was a line that was connecting these points in this line we call a secant line a secant line is just if you have some curve you have two points on it for example that's pointed to a cloth in 215 a secant line is a straight line between those two different points and then what we've seen is that the average velocity over this entire graph is just the slope of the secant line regardless of what
the actual graph is regardless of how the actual car moves its average velocity over this interval is the same thing as the slope of a secant line like you the same story if I put in for example this weird curvy one I want to figure out what did savage velocity is from 2 to 2 to 15 well I just come along I put in the same delta T the same Delta V I'm going to have that same secant line and again it's the slope of that secant line so an average velocity it cannot tell whether
you're accelerating and decelerating doing all sorts of weird things all that the adverse velocity tells you is this sort of net change between the start and the finish of your interval so now what I want to do is try to kind of talk about that question what does it mean to have a speed at 2:15 exactly so one of the things I could imagine we've got this slope of the secant line that was already interval two o'clock all the way up to 15 but what if I changed a little bit what if I instead made
my arrow smaller for example here it looks like we're going from 202 or so up to 215 and we noticed that that secant line is different and it has a different average velocity or I can go to 205 and it's gonna have a different secant line and a different average velocity is I might make my interval smaller now you keep on doing this I can't make my interval smaller again and smaller again and smaller again and I can keep on going so the interval that I have ends up being nice and small here but that'd
be the slope the slope of the secant line is getting closer and closer and closer to what appears to be the slope of the line around this 215 so the point is this if the question is to try to figure out what the velocity is I to 15 you can look at secant lines where your interval is really really small and really really near 215 so here's the big idea but we're calling the instantaneous velocity that is effectively what's going to happen as you take all these differ average velocities in other words the slope of
the secant line but you take those average velocities over smaller and smaller and smaller time intervals where those time intervals are getting really close to whatever the pointed you're trying to measure if you're trying to measure the speed at 215 it's a really really small time interval around 250 and it's a sort of limiting process if you wanted to really know exactly what it was you'd have to keep on going making your interval smaller and smaller forever
![The most beautiful equation in math, explained visually [Euler’s Formula]](https://img.youtube.com/vi/f8CXG7dS-D0/maxresdefault.jpg)