foreign [Music] on dashboard in reports we have directly called the reports on dashboards but in performance analytics we have visits a different type of indicators widgets I will teach you for the in performance analytics we have widgets analytics apps dashboard and indicators three types of indicators automated manual formula and many more things breakdowns Etc then this is the dashboard and it is a a visit which call an indicator indicator shows the number of open incidents we can also see it in this one foreign [Music] this is a dashboard and it is a visit of a
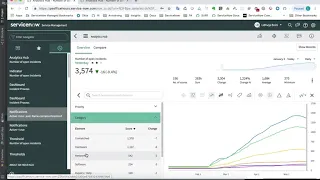
report of uh open incident then I will click on this it is says that click to open analytics Hub if I click here it will open this visit in analytics sub which shows the representation of your widget like this this is called threshold like if you want to show that all time this trend moves from three November 21 to 11 October you can also move as your time records and here are some thresholds Target Zone that what your target what is your what is the maximum peaks of opening in incidents at which time it is
shows that 1 December 2021 it has 242 maximum threshold records incidence and you can enable or disable these things from this filter like this shows the target target means this line so the Target that you this target you want to achieve you will achieve or not if I click here it can disable the Target and again enable it this shows threshold what is the maximum or minimum threshold you can also add comments and trend uh this is forecasting for future like now forecasting like your trend is your dashboard showing report like this and in future
from after this date it Trends to these these dots means it will become it will Trend in this way and you can also reports here that how many records it is showing you can also compare from two dates that what is the actual difference between two digits like you were you are saying that it is capturing the snapshot of every day that Feb 21 how many open incidents what is the Target and trend moving further in reports you cannot get it I know about analytics Hub can we go to the next one yeah yeah I'm
actually giving the demo about what is this and for creating these we have first we create indicators this is a dashboard which shows the dvla count of total cases received customer letters printed and scans received and cases written returned to dpla this is a bad on incident table like I have tabled this incident and I have three fields on this table customer letters printed scan received and cases returned to dvla uh I am take I have taken these date time Fields but you can take also on which field you can make your reports uh I
away this use case that total number of incidents created is scans received customer letters printed based on this I have created this dbla total count in this we have created four indicators like one two three these are indicators and all indicators are called in a widget this you can see it is called widget we can add widgets from here you can also filter your widgets and this particular is a visit you can move or edit by according yourself it is also a visit which is created by formula indicators and this is a Time series visit
loading like dictators automated indicators manual and formula I have created these indicators like you have seen on the dashboard dvla cases received how many total dvla cases received I have tell you manual and formula later this is the automated indicator which runs daily and it use the indicator source which which is I have created dvla incident created okay so question if you are going to create a Time series widget what was the first thing you do for Time series yeah if you go back to your dashboard like the time series you've already created no for
with the base is indicator this indicator is called in visits and that visits are called in dashboards I've shown one minute I visits this is a visit account this one dvla account it is a list type so you asked about that time series dvla volume it is a Time series this one dvla volume it is a Time series of type visualization at the beginning what do you do um yes yes first you create indicator to run that indicator you have to also create scheduled jobs which is called historic data collection and dairy data collection historic
data collection is that it collects the data of all over the time which and from beginning where all the records of your incident and daily data collection it it runs daily basis simply incident created and it runs and captures data in this your indicator and this indicator you called in this visit like this one time series visit and this indicator is called is here so we are going to have different indicators in the widget what do you do then you have here uh indicator groups you will create indicator group and then like this I have
yes individual account and like you've seen this this visit have multiple indicators then four indicators are grouped in one like dvl first group created a group and the four indicators are called here grouped together and this group is called in this visit this is the value your question is if multiple indicators used in one is it then yeah not on this widget if you scroll down to your yeah yeah then you can also add here visit indicators so if you do not have a widget indicator what do you do you create here you create a
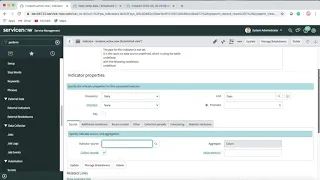
new one yes okay and using that applicators you can add them here so what what are the attributes you use to create a new indication indicators is it by adding additional additional conditions to them or for creating new indicator like automated time [Music] so only indicator source is needed and according to your condition what condition do you add according to your customer need the name when want to you run these indicator you need what is the direction maximize minimize and indicator source is required because of this indicator Source this indicator collects get data and you
can also add additional conditions like is this there are field not read only and so mine which is created this is dvla cases received I have given maximize Direction you need hash and it uses the dvla source incidents.created means that it collects all the incidents which are created and it uses the aggregate like which you want to put data like I have used in count so it is showing that one minute showing here the counts of incident created 2 1 2 if you use some then it will aggregate some average min max which one to
use I use com and additional conditions you can also apply on that other access controls and if this all runs based on these two jobs like you have seen here on number nine ones dvla cases received one customer later printed and one they will like s is returned to dvla if I go to my Instagram list your name is control right yes okay so let me tell you my background on performance analytics okay I am in an analytics team in my company and we do a lot of reports and dashboard okay we have developers initially
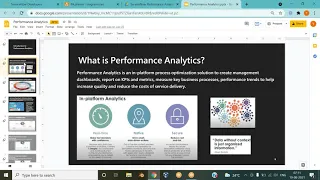
working for us um when we have performance analysis you are asked an automated indicator use an indicator source as a data set the indicator source is specific table condition for filter records from the tip and the frequency at which you expect to display the data the indicator applies an aggregator and optional condition to this data as I said this is one minute indicator it has all these things table condition and filtering records when we come to manual indicators manual indicators do not use this course collected for database manual indicators are typically used for data that
cannot be retrieved from servicenow instance because it comes from outside any third part system this this comes from third party system and formula indicators are used automated indicator to calculate new matrices like I have see I've seen you that you have seen here like this these are automated indicators which shows only the count of incidents but here these three are formula indicators which fine um like total three incidents created then vla cases that how many collected on that day these formula indicators created from here and we have to write form in that indicators like according
to according to your business need you can create formulas for your uh like if I open this it contains a formula and informal it uses the automated indicators like I have written here if dvla customer letter said equal equal to 0 then it will return 0 if it is not 0 means there is a data then it will find the percentage of customer let us printed and return the two indicators constructing in this is this the formula work on these indicators customer letters printed and scans received and it finds the percentage of that this formula
indicator like you want so is that something you can teach me from scratch or what is your process of teaching what is do you normally do in the kitchen was your process like where do you start from I start from basics of dashboards if you are know about dashboard we can also move to the indicators and so I know about dashboards I know about reports all I need to learn is how to create breakdowns how to create analytics widgets different elements widgets with different visualizations single scores time series um um percentage widgets and all of
those I need to understand how I need to learn how to do that right and then we know when the dashboard has a breakdown just like we have interactive filters or normal standard dashboard right yeah have you created a breakdown before on a dashboard yeah yeah this dashboard also have breakdowns I know there are breakdowns on the dashboard and there are breakdowns in the widgets right yeah yeah okay so I need to learn both of them so you see I have a knowledge of performance and identities I just need to understand how to build it
does that make sense you can see breakdowns he has like incident category priority and state you can according to your needs yes so that's what yeah that's one of the thing I want to learn as well because of these breakdowns it will show the result like this mm-hmm I've selected your priority one and and two the all Purity one and two incidents are showing here you can also you know how to create a what cloud the s word cloud I didn't get so there is a visualization called word cloud 4pa no I don't have so
if you open a PA widget and you take look at all the good jobs in one minute what you want to know you see how you select Time series yeah yeah right so um leave the time series go to visualization there is a visual that says word cloud and cloud is in Time series it shows line chart column is line area step okay can you pick another one another time series another type let's see score published breakdowns do text let's see do texts aha this is it this one oh word cloud have you made use
of that before no no I don't use okay so we use different type of visuals it depends on we are really we are really working with performance analytics a lot like we do it a lot yeah so I will use all of these types of withdrawals okay so and I want to learn how to build each one of them what indicators to add conditions formula if needed okay so I it's not like I don't understand I know about it and can you have it I got a requirements for it but it's just that I need
to I need help I need technical I need to know how to build it myself yeah yeah Hands-On practice is also yes yes so I'm not like a really new new to it I'm not no I'm not okay anything else well I think that's it for now um how long do you think it takes you to teach me all of that I love that 15 to 20 20 hours okay and um 15 to 20 hours okay and if I if I'm working on something from work can I ask you for help to teach me how
to do it if I have taxes thanks to me or how we do it yeah you can ask for help and is the session going to be recorded yeah I think