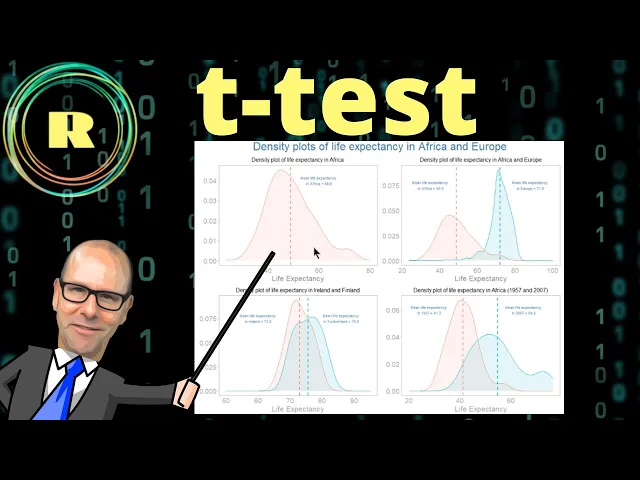
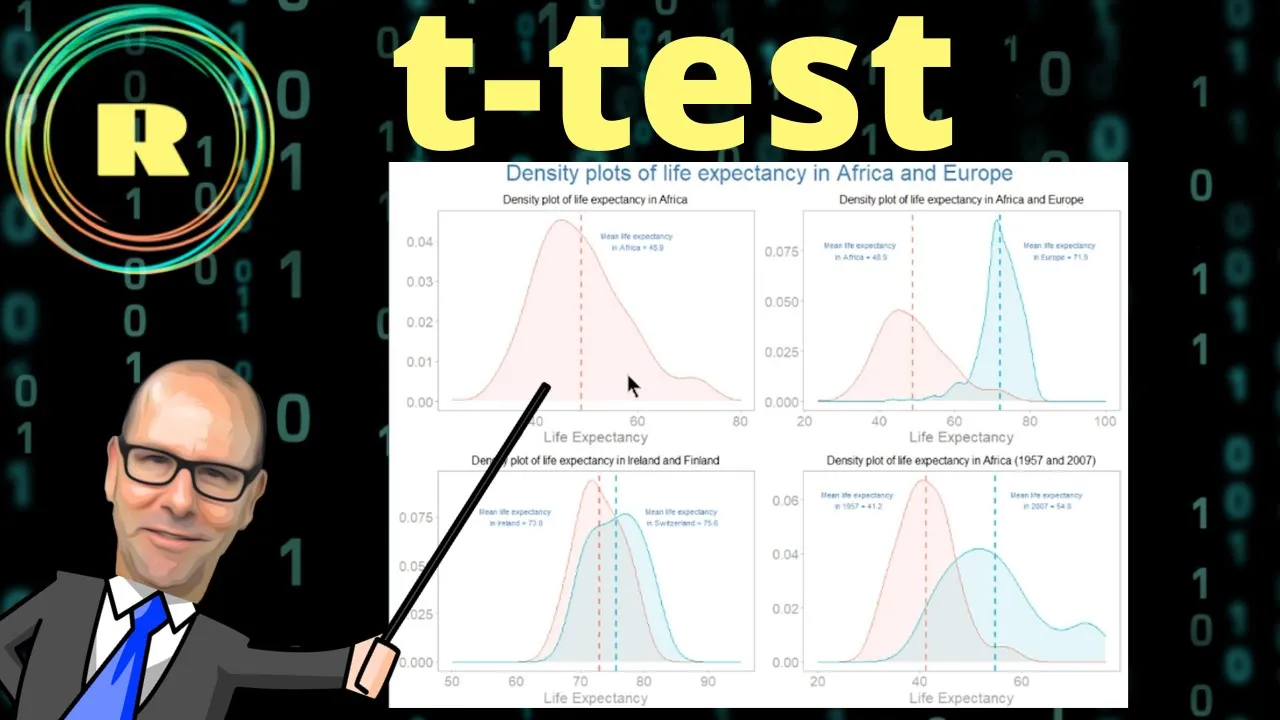
today we are talking about the t-test that's right we're going to talk about doing a single sample t-test two-sided t-tests one-sided t-tests and paired t-tests if you find that a little bit confusing don't by the end of this video you're gonna know exactly how to do these things in r so don't go away stick with me this is going to be a lot of fun if you want to learn about our programming then you have come to the right place on this youtube channel we're creating our programming videos on everything this video forms part of a series of videos that we're doing we started off with explore clean manipulate describe summarize visualize and now we're on analyze right doing statistical analysis of your data making inference inferring something about a wider population based on an analysis of your sample all right very easy to do you can understand exactly how to do this at the end of this video boom shakalaka let's do this now as always first of all we install a couple of packages right we use the library function we install packages these packages expand the vocabulary within r you've got access to them of course they're free and the ones we always work with is the tidyburst that is extremely important patchwork is just something i use to kind of allow me to do a little bit more with the graphics and i can put more than one graphic on the page at a time it's lovely gap minder is the package that you install that gives you access to the data that we're going to use in this particular video and i want you to install that use install packages function and then library to call it because you can do this analysis at home you can replicate everything that i'm doing on your computer at home and that's the best way to learn okay so gapminder that's where the data is it'll stick the data on your computer and once you've done it once you've got that data there forever before we look at the code i want us to quickly revise what it is that we're doing when we do a t-test the code is very simple and it's going to produce some kind of answer and you're only going to be able to interpret that answer if you understand what it is what question it is that we're asking now in the case of a t-test we're always asking a question about the average right so we've got sample data sample taken from a population we've got sample data and we're asking something about the average that we're seeing in that sample data and we're asking is that average different either is it different from some sort of presumed average that we think is the case in the population or is it is the average that we're seeing in one subset of that population significantly different from the average that we're seeing or the mean that we're seeing in another subset of that population and that's basically what it is that we're doing when we do a t test we're going to start off with a single sample t-test right and before i do the actual coding what i want to what i just want to revise for five seconds is how hypothesis testing works right this is how all statistical inference works i'm only gonna revise this once and then i'm gonna i'm gonna just assume that we understand that for all of the tests that we do for the rest of the video the way hypothesis testing works is this and this is the way science works in general by the way if you look at this this diagram at the top left hand corner here right before we took the sample data let's assume we've not got the sample data yet we may have for some reason believed could have been because of historic diet it could have been for whatever reason we believe that the life expectancy in africa during this time frame the mean life expectancy was 50 years we've now got sample data we've analyzed the data and we've actually discovered that in our data the mean life expectancy in africa during this time frame was in fact 48. 9 years and the question we're asking is is this ca is this 48. 9 years a reliable number can we make inference about the population from this is it statistically significant or not in other words if you look at our null and our alternative hypotheses here the null hypothesis is that the mean life expectancy in africa during this time frame was 50 years that's the average life expectancy either that is the case or that's a reliable we can we can have confidence in that or the counterfactual is true which is the mean life expectancy is not 50 years and that seems to be what our data is suggesting but the question is is it statistically significant and the way we answer that question is we make the assumption that the null hypothesis is correct in other words let's assume that h0 here is right that the mean life expectancy is in fact 50 years if that were true what is the probability that we would by sampling that data get a result that is as different or more different as different or more different a difference this big or bigger than that mean of 50 years okay so what are the chances that we would get a sample with a mean of 48.
9 years and when we say it as different we mean as different in either direction right it's 48. 9 years is kind of 1. 1 year to sort of the left of that mean but a difference that was 1.
1 year to the right of that mean would also be a difference of that magnitude right so what are the chances that we'd get a difference of that magnitude or more and we decide up front what the cut-off acceptable threshold for us accepting or rejecting that null hypothesis would be and usually we take five percent but then there's reasons to have thresholds that are high or low and we'll talk about that in a different video but if the if it is improbable so it's it's it's it's less than a five percent or less chance that we would get a sample that looked like this if it were the case that the null hypothesis would correct if it's that improbable we can reject the null hypothesis and accept the alternative the h1 here that the mean life expectancy is in fact not 50 and under those circumstances we'd consider our data here to be statistically significant okay got it let's keep going right now let's go and look at the code and do a t-test super duper easy and we'll do all four of these quickly because they're very easy once you understand the underlying principle right so we start off with gapminder we're using the pipe operators because we're working in the tidy verse which simply mean and then right so we're starting off gapminder and then we take our data set gap mind there first thing we do is we filter it so and filter basically means of all of the rows right of all of our of all of the observations we only want observations where it is the case that the continent so in in the variable continent uh it it's it's true that the continent is africa in other words we're only going to extract out african data here right remember we're wanting to look at this plot right over here we just want data that's africa right then we want to select just the variable life expectancy okay so we just want to look at life expectancy and then we just pipe that straight into the t-test over here and we've put in the argument mu which is population mean is equal to 50. in other words the assumed mean population mean is 50 and it's testing whether or not our sample data finds that is statistically significant against that in other words here within t test right because we've piped it in we don't need to tell the t-test what data we're using it's been piped in right through the pipe operator but we can use arguments to to specify certain uh attributes of the test itself and in this particular example we we because it's a single sample t-test we're just looking at one one bit of data we're putting in an assumed mu of 50. okay let's run that and let's have a look at the results down here and i want us to interpret this result in the context of what i explained earlier about hypothesis testing right there's a few things here there's quite a lot in there but there's just one or two things that you really need to look at the first is the p-value right the p-value is the probability that we would get a sample that is as different from 50 of this magnitude or more and the probability here is 0.
002 right it's extremely extremely small it's less than five percent right and we said our cut off we in this case we're using a cutoff for five percent you could use anything uh cut off was five percent this is smaller than five percent which means that we can reject the null hypothesis the null hypothesis was that the the average life expectancy in africa was 50. we can say reject that we can accept the alternative hypothesis and in actual fact that it gives you that right here right it says the alternative hypothesis the true mean is not equal to 50 right then it gives us a 95 confidence interval in other words we are 95 sure that the that that the true mean right given our sample that the true mean lies somewhere between forty eight point one four and forty nine point five eight right so we from from our sample data that's where we think that the true mean lies that confidence interval does not include the number 50 which again supports what we were saying that that that are that our sample data is statistically significant in terms of asking the question is this different from 50 and it gives us what the mean is of course here it is 48. 48.
86 you can round that up to 48. 9 right and if you understand the single sample t-test the other three are super duper easy you're going to understand them all and we'll go through them quite quickly before we carry on i just want to show you something so i just i didn't create any objects here i just kind of piped this through and did the test but what a lot of people would do is they would create an object when they do a t-test right so they they'd create i've just said my test and then i've got the exact same code gap minder filter select t test mu and if i run that i get an object right now i've created something called the t-test it's an object in r and i can apply the function attributes to that object and if i if i run that r tells me what all of the attributes what what's inside that object and that means that i can call it or i can dig deep and ask for any of these attributes if i wanted to so i can say my t-test dollar sign and p-value for example and it's going to give me the p-value down there but i could have put in any of those attributes and pulled out that particular aspect of that particular result of out and you can do that basically with any of these tests by the way now let's look at a two-sided t-test for the difference of means right now we've got data for africa and we've got data for europe right and we can see if we look at the distribution of life expectancy in africa and the distribution of life expectancy in europe we can see that they're different the dotted lines are the averages in each case and what we're seeing in the sample dot here is that there's a difference is that difference statistically significant easy to answer we simply do a t-test okay so let's have a look at the code and then we'll interpret the results right again we've got gapminder okay we're piping that in we're filtering the data and now we're filtering it by africa and europe okay so let me just show you what that looks like just so that you know what the code is doing if i take away the pipe operator it's just going to run the code until there and you'll see it's just got in under continent it's just got europe and if if you carried on it would include just africa so all of the other continents have been removed it's just got africa and europe in there add the pipe operator back let's carry on running the code it pipes that into our t-test and now basically we're saying with within africa and europe we want to compare life expectancy by continent right so we've got the two continents okay in the t test now now we didn't need to do this with a single sample t-test just because we just had one column of data now we've got these now we've got life expectancy and we want to compare the life expectancy okay by continent and we've already defined that we've only got two continents in the mix right and now look at the dot look at the code over here we've got data equals dot why have i done that the reason i've done that is because we're piping the object into the t-test ordinarily when you use these pipe operators what happens is it takes whatever's on the left of the pipe operator pipes it in as the first argument into the next function in other words what r would want to do here is say t-test and the very first thing it wants to do is take what was in the pipe and pop it in as the very first argument but the t-test doesn't want to see data or the data frame as its first argument the t-test has been designed in such a way that it actually wants the data over here and so when we use the pipe operators and the function that we're using is not wanting to get the the the data as its first argument we simply put data equals dot to tell the function look this is this is where you want to pipe that data into does that make sense all right uh and then i've got a comma and then i'm going to the next line but it's you can consider this to be going along the same line it's just neater on the next line i've said alternative equals two-sided now that is actually the default if i didn't put alternative equals two-sided it would it would default to that anyway but it means we're doing a two-sided test um as opposed to a one-sided test now the difference between the two is the two-sided test is saying look we're asking the question is the difference in life expectancy between the africa and europe is it this different in any direction bigger or smaller we're not we're not saying when we ask the question we're not asking is africa uh does africa have a life expectancy less than europe we're asking does africa have a life expectancy different from europe right let's assume we don't have a view on this and we're going to look at um we're going to look at a single-sided test in just a few seconds but for a two-sided test we're asking are these two are these two means different from each other is the difference significantly different from zero okay now if we run that data and it makes more sense when you look at the actual results here we've got we've got the the we've got the two-sided t-test now again we've got a p-value that's very very small we would expect the p-value to be small by the way i mean this this i mean so if you look at the diagram here we we can see in the sample data that there's this huge difference so we would expect there to be a significant statistically significant difference um this p value that's very very small so the 2. 2 times 10 to the power of negative negative 16.
so that's like 0. 0000 it's a tiny tiny number of course that's less than our alpha value the cut off threshold for statistical significance five percent so this is much much much less than five percent and we're saying if it were the case if it were the case let's go back to the diagram if it were the case that the difference in these means was in fact zero in other words there was no difference in the life expectancy in africa and europe if that were true our null hypothesis the chances of us getting a sample data with a difference of this magnitude in either direction bigger or smaller would be zero point zero zero zero zero zero zero very very very small it's very very unlikely and so we can reject that null hypothesis we can reject the notion that the two means are the same and we can accept the fact that the different this difference is statistically significant right so that's the p-value okay and we say here the alternative hypothesis the true difference in means is not equal to zero again we've got a 95 percent confidence interval which is um minus 23 and minus 22 and basically that just that's just the fact that these are negatives is just a function of which mean you're subtracting from which when you're working out the difference between the two okay so uh it's subtracting europe from africa and it's getting uh two negative values if we and and we can look just now at swapping that around and making them into positive numbers it doesn't really matter the point is that we've got a difference of mean a confidence interval that doesn't include zero okay and again that tells us that it's statistically significant um and here and it actually gives us what the two means are 48. 8 for africa and 71.
9 for europe okay got it let's keep going okay now we are going to look at a one-sided test for the difference in means and by one-sided basically it'll make more sense as we go through this but if you look at the bottom right hand corner bottom left-hand corner the diagram down here right we've got the average life expectancy in ireland and then the average life expectancy in switzerland i chose these two countries because i've lived in both of them so i'm interested um and we can see that you know the distribution of the life expectancy in ireland is slightly uh on average look there's the there's the mean in orange over there is the average in life life expectancy in ireland is less than the average life expectancy in switzerland is this statistically significant and we're going to ask a slightly different question now right previously in the two-sided test we said is getting a difference of this magnitude statistically significant in either direction bigger or smaller is getting a difference of the size is there a difference now we're going to ask specifically is it is our observation that ireland has a life expectancy that is less than switzerland is that statistically significant so we've actually got some directionality to our question we're asking is ireland does ireland have a life expectancy less than switzerland again our null hypothesis will be that the life expectancy in both countries is exactly the same in other words the difference is zero and the alternative would be that the life expectancy in ireland is is less than uh at switzerland to that magnitude or more right um and and again we've got to identify the alpha value up front and we're going to use five percent if it's if it's less than five percent uh likely that we would get a difference of that magnitude or more we will reject the null hypothesis which is that the two the two countries have the same life expectancy okay you got that okay let's look at the code gapminder again pipe it into filter we're just looking at ireland and switzerland in the country so we say country in ireland or switzerland right and i'm not going to really get into the the nuts and bolts of um of doing this kind of filtering you can watch my other videos on that if you find that that a little bit confusing uh then we pipe that into the t-test we're going to do the life expectancy as a function of country again dotted dot to say the data gets piped in here and look here we've got alternative is less in other words in in in in the previous example we said alternative is two-sided so that's the two-sided t-test now the alternative is less in other words the alternative to the null hypothesis right is less the null hypothesis is that there's no difference the the the alternative hypothesis is that there is a difference but we're asking is the difference less is ireland less than switzerland and then we've got we've we and then the other argument that i'm specifying here is confidence level of 0. 95 now you can you can put anything you want in there you could put point nine you could you could put different numbers in there that 0. 95 by the way is the default so if you didn't put anything in here it it would default to 0.
95 i'm just putting that in there to show you where the argument would go if you wanted to use a different alpha value a different threshold right but we'll stick with 0. 95 it's it's quite it's kind of sensible let's run that data and here we go and interestingly interestingly it is not statistically significant look at this a p-value of 0. 058 which you can round up to 0.
6 in other words it is it it if if the difference is you know our null hypothesis is that there's no difference between the life expectancy in ireland and switzerland we're asking given that we've seen this the difference that we have in our sample data how likely is it that we would get that difference and is that likelihood less than five percent and the answer is no it's not less than five percent it's actually slightly greater than five percent we cannot reject our null hypothesis we so we fail to reject it we're basically and we we we basically saying yeah it might well be the case that the life expectancy in ireland and switzerland is the same or certainly that it's not different um so that's interesting now what's important here is that and this is why i was talking about you know the confidence level before you run the test before you do this the stats you have to decide up front what that threshold is because the temptation is to run the test see that you've got a p-value of 0. 058 and and then retrospectively sort of say oh well our cutoff point was 10 so this is still statistically significant and that happens all the time in science it's bad science it's called p hacking and it shouldn't be done you've got to start you've got to stay up front what your alpha value is and then and then run the test and live with the results so this this difference is not statistically significant uh look at this we've got it uh we've got we've got and we've we've got a 95 confidence interval um that does include zero okay and i won't get into now how it is that you've got a negative infinite and and a positive number here the important thing is that the confidence interval includes the possibility of a zero difference um and here are the two life expectancies and finally we've got the paired t-test right now this is interesting like let's have a look at this diagram over here okay the paired t-test uh means that we've taken one population okay we've got in this case we've got a density plot of life expectancy in africa in 1957 and in 2007 right so what are our observations how are countries so each country in africa has a life expectancy in a given year and we do that in 1957 right and we find that we've got a life an average life expectancy in 1957 of 41. 2 we look at the same countries in 2007 and we see we've got an average life expectancy of 54.
8 right can you see that in these two samples each observation so south africa malawi zimbabwe each of them has got an exact counterpart in the the the next sample that so the 1957 there's there's a south africa in 1957 and there's a south africa in 2007. so they're paired there's pairs of data and that makes a difference in terms of our statistical analysis and so that's why we call this a paired t-test right we've got sample data where there's a counterpart that is connected and we and we do this for example you can imagine in medical research right you know you know the extent to which a population a sample of people had a headache before and after taking the drug you know and for each uh participant you know each participant exists on both sides of that timeline and so there's you would do a paired t-test for example it would you know the average uh extent to which they had a headache or whatever it was okay so that's a paired t-test um and essentially everything everything else is pretty much the same right let's look at let's look at the code gapminder we're filtering now we're filtering by two things right firstly we only want data for two of the years 1957 and 2007 right so we use year in concatenation the two years and consonant double equal sign remember because we're asking the question of each observation is this observation does is this criteria fulfilled in that particular variable double double double equal sign and then now look at what i've done hannah and you this this is just kind of a useful little trick i've said mutate and i've taken this year data and i've said it's a factor but i want to change the levels so whenever you say mutate right you you could we could create a new variable mutate and call it year 2 or something like that or we can overwrite the existing variables so mutate here what is your equal to well factor again we need to say that it's here and now we're saying levels and i'm i'm making the levels 2007 and 1957. it was the other way around it it's it's the inclination would have been to be sort of uh you know it would have put 1957 before 2007.
but we want to subtract uh 1957 from 2007 to for to look at this difference um and so i've just done that and then we've got t-test life expectancy okay life expectancy by your data equals dot paired equals true right so remember we were putting in uh uh arguments into our t-test up here we're just sticking in that argument paired equals true and we run that and we and we and we get what we've got over here look here we've got uh the the mean difference is 13 right that's the difference between 54. 8 and uh 41. 2 right it's that's that's that's that's the mean life expectancy in 2007 minus the mean life expectancy in 2000 and in in 1957.
if i took away this line right here the mutate where i changed the levels what's the orders right and i ran the same code it's fine but you're just going to see a negative number there minus 13 and all that's happened there's it's it's basically said uh not that the mean value in 1957 41. 2 minus the mean value in 19 2007.