hey everyone welcome back to another video so today in this video I'll be talking about the reporting section of the inventory module of ODU 17 like in every other module inventory also has a very attractive reporting section so inside this inventory module as you all know we get complete details about the stock moves stock operations and so on so you can easily manage your stock using the inventory module of Odo sality similarly you have this reporting section which gives you a complete idea about all the stock operations which is taking place inside the inventory module
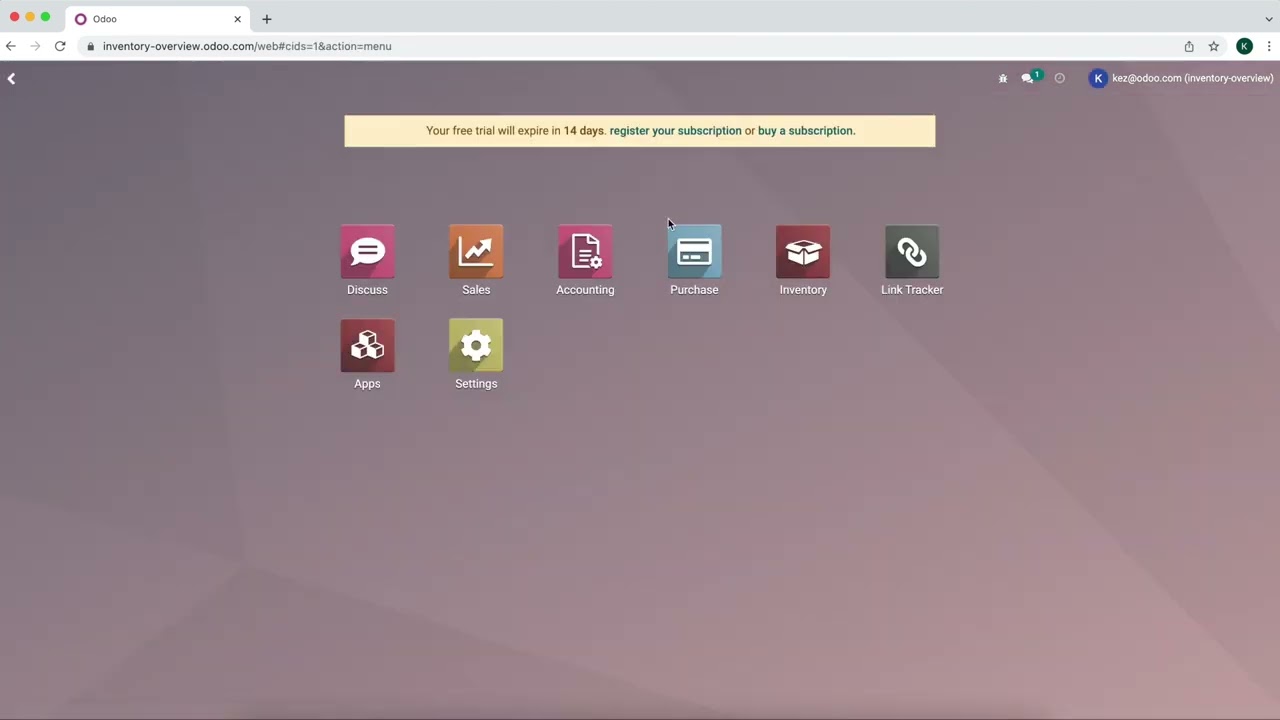
so I'm not wasting your time let's move on to the module and see what the reporting features provides you so now let's take a look at the reporting section of the inventory module so here we have the inventory module and here is the reporting section under the reporting we have things like stock move history move analysis valuation as well as the performance so everything is related to inventory as you all know here the main important thing is stock every stock operations can be viewed here inside the inventory module and and every data or everything regarding
the stop operation can be you know identified just by taking a look at the reporting so let's go to the stock reporting now here you get the stock okay you can see the product the unit cost the total value the onand quantity free to use incoming outgoing units and all okay so data regarding every product is there now if you want to filter it based on only rental products okay you can get the rental products or if you want only salable product that is also possible now inside salable product if you want to see any
particular product you can choose that from here and also you have certain things like that so this is to Simply filter the data here you get the details of the stock regarding the onhand quantity and also which are free to use okay now if you want to take a look at the history of the product just click on the history over there and then you can see the date from where to where this has been moved and all so this is basically the move history of the product okay now if you want to create a
new one means click on new okay so there's the new icon now you have to provide the product of the name and create a new product so basically you're creating a new stock which means simply creating a new product okay so I I hope you guys know how to create a product so I'm not going in detail on that so in this whole page you can see the product details okay now here you have this filter okay so where you can filter Group by and you know even add favorites that's the stock then you have
the move history so inside inventory you have move history which shows you the operation which is the move of stock stock moves so from which location to which location the stock has been moved the L Lot number the quantity that has been moved the unit and also the status okay whether it's done or is it's not done whatever the status is that can be viewed here so this is basically the move history now this is shown in list View and if you want to see that in a canman view you can do that from here
see card like view of move history of sheet so you can see the product quantity the updated ones the storage I mean the product name the units then you have the date as well as the time and here you have the done thing okay so the product quantity has been moved this much quantity or this much unit of product is moved from one place to another and then you have the pivot view of the same which is move history where you can categorize the products okay and if you want to add any more measures you
can add it from here okay and also you have the option to insert this particular thing into spreadsheet so click on that either click on uh blank spreadsheet or an existing spreadsheet so I'll put it inside a blank spreadsheet and show you guys see new spreadsheet created in documents now this has taken us to the spreadsheet which we created right now so that's how you insert it into a spreadsheet and once it's done what you have to do is go to reporting and then you have the move analysis so inside the move analysis you get
the you know first of all once you open you get the pivot table of the move analysis okay so here if you just take a look of the move analysis you get the graph view Canin view list View and also the pivit view so here you have the total the company and the demand quantity counted quantity everything is shown here okay I'll just put it into a graph View and show so here you have the different products and here you can see the demand for that product okay so you can basically analyze the demand of
the product from here okay and here you have the line chart of the same you have the pie chart over here of different products okay so as you all know for the line chart and by P I mean so the line chart and bar chart you have this stacked View and for the line chart you have stacked view as well as the cumulative View plus you can view it in ascending and descending order okay so that's the move analysis now if you want to add or change the measure you can change it so I've changed
it based on quantity removing the cumulative view removing the stack view this is the bar chart I mean the line chart and this is the bar chart of the product which shows the quantity of the product okay so that's the graphical representation of move analysis and then you have the graphical representation of the I mean the canvin representation of move analysis which is simply a card like you where you get the initial demand of the product and the quantity okay plus the name of the product okay so that's the en View and you have the
list view of the same so here's the list view you can see the reference the product from to demand quantity okay and the PT view which we have already gone through that's the move analysis now if you go to reporting you have one more thing which is valuation which is the stock valuation okay so if you want to create create a you know valuation at date you can choose a date and based on the date this will come so confirming it based on the date that is the stock valuation on this particular date and time
will be shown okay so I mean we are doing the stock valuation for this particular date okay so you can see the date the reference the product the company the move quantity unit unit of measure total and so on so these are all the data regarding the stock and this is basically the stock valuation see you can choose another date over here valuation at date so choose a date to get the valuation at that date so today what I've done is I've chosen today's date and today today's stock valuation was done now I'm just ch
uh choosing the date as January 1st confirming it so what happened on that date there is no particular thing to show Okay so let's go back to January 9th that is today so this is the stock valuation of the Day January 9th similarly you have the same thing in the uh pivot view okay as you all know you can flip the axis expand it and also import the xlsx file finally we have the performance of reporting where you have the warehouse analysis so this will be the transfer date okay so I'll do one thing I'll
simply add measure and show you can you can add the cycle time okay cycle time can be shown so I'm going to B chart I have the transfer date and all So currently there is nothing to show over here the transfer date is given as January 2024 and the done deliveries here you have the option to choose the product quantity okay on this particular date the product quantity which was transferred okay so this is basically the warehouse analysis now here also you have three types of graphs line chart P chart and bar chart and then
also you have this pivet view so that's the warehouse analysis so that's how you get a rough look about all the things which is happening inside the inventory modum so this is the reporting section of inventory so I hope it's clear for you guys so that was all about the reporting and inventory module I hope it's clear for you guys thank you so much for watching see you in the next [Music] video