All right folks welcome back this is episode 18 of the continuing series of the ict 2022 youtube mentorship all right so we are looking at the euro dollar and what you have here is how i have my trade layout this is what i work with while utilizing my charts through trading view and don't be intimidated because you may Not be able to do this with your trading view uh there's a i think there's a membership level you have to have and again i'm not trying to promote i don't get anything for you signing up with
tradingview i don't have any affiliate programs nothing like that i don't have any you know programs that i'm trying to pitch i just like the service okay i pay for it out of my pocket you don't have to Owe me any favors so but i have it set up like this when i'm looking at the marketplace the upper left hand corner now you you can do this with individual charts and you'll see what i mean by having one laptop one screen if you do what i'm going to show you here today you don't need all
these screens but i've been asked to show this both in my Private group and in the youtube community what do my charts look like when i'm going through the motions of looking for trade setups and how do i navigate from higher time frame down to the lower time frame and how do i work with daily bias and what do i do with my charts to streamline the analysis from high time frame to low time frame i'm going to show you that in this lesson here All right so upper left-hand corner is always going to be
the daily chart as you can see here daily now if you're looking for bias you're going to start your analysis here now you can do it with the chart maximize like this start working with it doing all of the business that you would expect to have in your chart and we'll do this here Shout out to my mentorship group private group i mentioned this on wednesday's midweek commentary a little bit of hindsight done right so we have fair value gap there and notice that it has this high that low and a higher high many of
you would see that as my bearish breaker It's not okay so look at this here which is lower is it this low here or the discount low of the fair value gap in other words this candle is high clearly it's this candle's high so i'm going to tell you something i told my private group last night because i can tell it to you now It's not advantageous to you it was advantageous for them because they knew about it yesterday but i'm showing you this because i have a lot of witnesses that i said this before
it happened because i know some of you out here unless you were there watching it okay you just simply won't believe it and that's fine i'm not here to convince every single one of you you're either Going to believe it or you're going to watch somebody else's channel as simple as that but the fair value gap in here i mentioned that we would likely draw up into that and then look for lower prices now let's step by step walk through a scenario using what i'm teaching you in this mentorship on the youtube Channel okay i
responded to a lady on the comment section of i think it was the most recent video so forgive me if it isn't that video but i know i mentioned uh a response to her question was more or less i'm gonna paraphrase it can i touch on or teach a specific approach to trading Or can i mention rather a specific style of trading that if i only had to pick one way of doing it one style of trading that obviously hits all the time well there is no method that hits every single time okay everything that
i trade with and teach is like everything else it's imperfect that means there's going to be losing transactions largely because of the Operator me or whoever else is using it and you have to take ownership of that it takes a great deal of responsibility and i kind of lectured on that in my private group on wednesday it doesn't feel good to hear those types of woodshed lectures but it's something i needed when i was younger But if i was going to use one particular approach to trading like say i was starting completely over didn't know
anything but i discovered like say this youtube channel knowing what i know about all the things that i can utilize in trading the reason why i stripped it all down and created the model Like it is and you're going to see more of it being applied here today so it gives you like a a step-by-step approach i know some of you were asking can you just kind of like show me what it is i'm trying to do in the charts like what am i looking for what's what's a way of back testing you know how
can i go through and look at old data i'm going to show you something here but it was also given to my community Yesterday okay and if i see a bunch of comments in the comment section saying that it wasn't really done i'll just simply upload the video and prove everybody that says that wrong so i'm ready i'm ready for it so the long short is it's not a big deal it's not a huge trade but it's proving prognostication it's proving that number one i've already hinted that this thing was likely to go lower anyway
And we've seen it go lower but utilizing the model this model here in the youtube 2022 mentorship that to me is the easiest and i would just do this i wouldn't worry about doing anything with like uh central bank dealer's range okay i wouldn't worry about doing anything with asian range i wouldn't even worry about Doing anything with the well there's a anything else unless i've mentioned it in this model i wouldn't even do any investment of time at all because this literally is the simplest way to work with intraday and daily order flow it's
simple it really is this simple It doesn't feel sexy though i know some of you young guys are like yeah but wait till he starts bringing out all the really hard-hitting you know gadgets and such you're going to be floored by that no you don't need it i don't want my daughter inundated with all that stuff number one she's really not interested in trading so i'm trying to convince her that she can do this with something it's very simple it's Streamlined so what does that mean by streamlining it and what is the step-by-step process because
i already told you the bias i've had on this currency when i taught one tuesday i gave you a 4x lesson i showed you an example with the euro i said it's likely to draw into this low here now here's the wonderful thing we don't even need it to go down to that low to find profitability How's that how is that possible how are you able to responsibly handle daily bias work with a higher time frame and then frame out a setup using the logic that i'm showing you in this model let's do that now
number one the bias is bearish so if a bearish bias is being Implemented okay in other words you're using that in your analysis you're going through the charts looking for setups that would warrant a short sale on this particular market or this pair in forex what i'm showing you here all of this up to now if i make a transition to index futures trading i'll mention certain caveats when it comes to that But for now everything i'm saying in this video until i say otherwise is pertinent to forex okay so it's specific to 4x all
right so bias is bearish and we're looking at a daily chart so you start your analysis there you have a fair value gap here so It can trade up into that and all you have to see is that candle traded to there now you can be greedy and try to trade all the way up into the middle point or deep into it maybe in complete closure i don't need that and we're gonna bring in the element of time of day and how that helps you decide what you're looking for and you don't really need to
catch that high today Either so i'm going to show you how to be forgiving with your entries the important thing is knowing what you're looking for ahead of time so that way you're not changing gears back and forth intraday chasing an impulsive price swing that may feel like oh i'm probably wrong let me chase this let me chase that when i showed the three months live trading account statements What some of you are not listening to when i say it in the video listen to the videos okay when i'm showing those statements i'm disclosing the
fact that i'm getting questions by my students these folks have paid me okay they asked for me to show them things in a live account you are not privy to all of those conversations because you're not in that community So when they're asking me questions like what do you do if you get this this and this and this how would you work with that in in a real market i'm literally putting myself in a live account creating those very sim similar situations that they're asking me about and then moving out of those periods of either
drawdown or How to overcome the anxious i don't want to take a trade i'm scared what happens if you take losing trades how do you overcome that a lot of those executions you're seeing is just simply me pushing a button to show that yes you can do those types of things to overcome initial fear it's going to cost you commission it's going to look like you have no idea what you're doing and there's people out There looking at these statements i've encouraged all of you to do it but it isn't going to mean anything to
you unless you understand what i'm really illustrating there you're not the student that was spoken to in private with that live account showing that actual event unfolding so just know that there's a lot of things that are going on that Are not necessarily your business okay the community here wanted to see a live account you see it on live account but working within a live account unless you do things like i'm going to show you here you're going to have this changing of direction intraday over and back and forth back and forth you're going to
go up you're going to go down you're going to go back and forth And then it's gonna draw your account down or worse if you don't control yourself you'll blow the account so you have to commit to one direction that's your bias here's the thing your bias isn't going to be perfect and here's a news flash for you you as well i'm not always perfect with my bias either a bias is just an Idea that you want to work within and employ your short sale when you're bearish or employ your long trade ideas when you're
bullish and you're filtering out the other side of the marketplace unless you're proven clearly that you're absolutely wrong you just simply wait for these setups to form with that bias in mind now i know a lot of you are new and you want to see things taught to you that simply remove any chance of you losing There is no secret for that here nobody's going to teach that to you because it doesn't exist and frankly if someone had that i'll be real honest with you folks if i had a way that i would never lose
i would have never came out publicly and became a teacher i would be the richest person you've ever met that's the god's honest truth that's exactly what would happen and if there's somebody out there that has some kind of A means of never losing they're doing that very thing they're never gonna talk about it they're never gonna teach it so you don't need to be perfect and i've proven imperfection still doubles the account it's simple and you can have a lot of losing trades and this is one of the things that one of my students
asked they said what if your win rate is really really low Can you still double an account yes because i was thumbing my nose at this idea that a risk to reward model is the essential for you to be net profitable that's not true i've proven that with a live account i have lots of things i'm going to show you with this td ameritrade account before the end of the year but just know that they're they're future lessons that i'm going to literally go through And show you not everything obviously because you're not i'm not
obligated to show you everything that the other community is entitled to but i don't need to show you everything to see that account growing now the question is is what do you do if you're in a live account let's let's paint a picture for you okay say you're one of those individuals out there that have got caught up in the fever of all these funded account Programs okay i'm not going to name any in particular because i don't have an affiliation with one i don't want an affiliation with any of them and i don't have
any personal experience with my own trading with any of them okay so that way we know i'm not repping anyone there's no inside you know kickback for me none of that stuff but there's a number of them out there and my opinion of them is i have Students that have gone through them and they are funded do i believe everyone should do that i don't personally believe everyone should uh but it is an avenue that you have to consider when you're in your own seat if you want to do that or not but let's assume
that you've gone through the process and now you have passed whatever that you know I guess the challenge or whatever they call it to get funded and you found yourself with a let's say a hundred thousand dollar account in other words you have the ability to trade with what would be considered a hundred thousand dollars what process if it were me doing that okay that's i'm gonna speak in that perspective now i'm not saying you should do this notice what i'm saying Here if it were me and i was starting out all over again i
would use this model and i would go through the process of what i'm going to show you right now okay so bearish uh daily bias and i'm going through the daily chart and i'm looking at recent price action so we had this big drop down here Drawing towards this low and then the next day we had this candle trade up here so that creates the fair value got so ideally you know what we've seen here we had one two three four five down days now there's likely to have a retracement because we've seen it come
way down in terms of the range between this low and this high so what does that make That area down here premium or discount discount so as soon as this fair value gap forms we know that it's likely to see it rally up into this area here you know there's a short term little bounce that occurring and trading back to this candle's high is enough to set the stage for a new round of Selling so you highlight your area on your daily chart and then look at what we have in terms of targets this is
an ideal scenario that low but it's not likely to do that in one day can it do it absolutely but look at what is available in terms of targeting this day here it created the fair value gap so that Means we can go in and note that low right there and we'll change it to blue here okay and we're going to put a little line segment here on this daily candle and we'll mark that one red okay so we have more or less a premium level that's being highlighted you can see it touches it but
it Actually goes above it just a little bit and that's all we'll need to justify a framework okay now let me recap real quick bearish bias we're likely to draw down to this low here why because we had one two three times like i mentioned on the video on tuesday or episode 17 if i'm not mistaken in this mentorship so it's likely to draw lower And dig into this low that's our draw on liquidity on the daily chart but is that your trade target no not for intraday trading so you frame your daily highs and
lows previous daily high previous daily low so we have this day here you know yesterday's trading or what would be considered wednesday's trading and then thursday's trading we opened Here we rallied up popped just above that short-term high and now because we've seen that we can target that daily low right here okay so this is the trading day on thursday we open rally up create a judas swing run back into this fair value gap and then expect it to sell off and then we can aim for that daily low why because anybody that went long
in here Who would want to do that there's always buyers and sellers okay so we're going to use previous days highs and lows like institutional mindset traders do there's lots of liquidity around daily highs and lows and high frequency trading algorithms attack previous day's highs and lows if you were back in the baby pitch days when i came in the scene 2009 2010 that was the first lesson i started Talking about is highlight the previous day's highs and lows and do that for the last three days if you do that you'll see a plethora of
setups that you can do and that gives you liquidity pools that you can attack you there's always a fresh supply of new setups if you're looking at the last three days highs and lows it's always the case it's always going to be there you're never going to run out of trades ever okay So we have our framework here we have the actually let me change this blue to that green okay so we have premium and discount so these two levels are represented on the high and low of wednesday's trading which would be yesterday straight in
other words your chart would have looked like this wednesday going into thursday before thursday started trading You'd have this so you would not mark your chart out like this so if we go up here and we enter this fair value gap that's your opportunity to go in looking for shorts then if it starts to go down you're targeting this low with the expectation why is it likely to do that because it may want to go down to this low but this gives you a nice range of Profitability potential profitability so a range of we'll just
call that 935 to a low of what is it what's the low here 74. so 25 6 we'll call it 60 60 handles okay not bad that's a pretty respectable Range can you get 25 pips out of that can you get 30 pips out of that how about 40 pips well we're gonna find out but this is the range of opportunity that exists looking at wednesday's trading and then thursday we open we rally up we bump that high like we would expect trading back into that fair value gap and then we watch price does it
give us a setup what set up what i've taught you in this mentorship So we're going to drop down into the lower time frame if you have this layout like this so whatever you do in one chart it would appear in all the other time frames which is really nice this is one of the things that i'd like to use in trading view not that tradingview is the only platform because obviously you can do this with everything out there today but it's just really nice to be able to do this with all my students they
can do The same thing but if you're working with one screen like a laptop and i'll answer this while i'm talking about it should you be trading on your phone no no you shouldn't can you manage a trade on your phone yes but entering a brand new position on your phone no you don't see enough data it's just too compressed and you need to be able to see The lay of the land okay you need to be able to open your chart up and really take in the information if you don't do that folks you're
really just looking at a small little small little perspective really if you want to have advantages you you do it with a computer screen okay if you want to be handicapped then obviously try to trade on your Phone okay i have not met anyone that has been consistently profitable and trading millions of dollars and they trade on their phone it just it doesn't work like that folks you got to be responsible you have to have some real estate and yes it requires a little bit of an investment but hey you don't need all kinds of
things you don't need all the screens like i have and other people i have out There i'm showing you how you can do this at one screen one monitor so what would that look like obviously you can see everything i did on the daily chart is transposed onto the hourly chart down here in the lower left hand corner and it's transposed over here to the 15 minute time frame so time frames our upper left is daily Lower left is hourly and 15 minute time frame is only right the 15 minute time frame is my bellwether
chart that's the one that i go to quickly i want to keep referencing that 15 minute time frame throughout the day because the information i get from it which i'm going to show you is influential to me in terms of managing my position or hunting or stalking a new trade setup and also it helps me trust my intraday Bias and i'll i'll explain that when we get into that specific time frame but let me go back for a second to the daily because i want to bring something up if you're using one screen okay you
would obviously do this annotation here and then in this screen you would just simply change it to the hourly Chart and then everything you did here would be transposed over to the trading view chart that would be on the hourly chart rather and then once you've done whatever breakdown and markups that you would have for your hourly chart then you would drop down to the 15 minute timeframe and all of the annotations from the daily and the Hourly would appear on your 15-minute chart as you'll see okay so let's go back to the layout and
i'm going to maximize the hourly chart all right so i like to do these types of things bring it to the actual level i'm anchoring to because i have obsessive compulsive disorder so it is what it is it's a struggle folks so in here It's this imbalance on the daily chart but now we can see it also exists in the hourly as well so we have what this high and this high what are they they're relative equal highs anchored to that point right there okay so usually in my annotations i'm going into the chart and
this is for the purposes of showing you how to back test and how you Annotate your chart you toggle it to show on the top left and you can use whatever color you want and there you go so we had the annotations that would be on your chart for logging purposes for your study journal and then you would just screenshot this okay you might want to zoom in a little Bit you know make the chart a little bit more aesthetically pleasing having something like that more you know more information zoomed in to a specific area
and then simply go in and start working with the 15 minute time frame because this is all i would do with the hourly chart Because the frame of reference is that daily fair value gap we have liquidity pull on the hourly chart we've already mapped out the 6th of april's low notice there's no lower low this low didn't go down to it and we start a new day on the seventh here at midnight new york local time what do i mean by new york midnight i'm going to answer that let's go to The 15 minute
time frame here and as you can see we already have that little annotation updated on the 15 minute time frame so now here's the 15 minute timing frame and i apologize for all of you that would otherwise know how to do this but obviously it's a mentorship right there's a lot of people in the comments section that are asking for these types of lessons and once i go through this this episode we won't ever have to Revisit it again okay so bear with me okay all right so now we have on the 15 minute time
frame we're going to annotate the daily dividers this all is a little vertical line okay and this little bar here is just my favorites bar and you can google that for setting that up these are the things i use most in trading view so when i expand the chart to maximize The full screen i highlight the little star button in the lower left hand corner just below the little link button if you click that link button any chart you have open that's the same symbol any all the annotations will be plotted and placed on all
the time frames of that instrument or that pair or that market so in other words if like i was showing you with my trading layout upper left-hand corner daily hourly lower left Hand and 15 minute time frame on the right it's the biggest chart hitting that little link button icon will again link all your charts together so whatever you're showing annotations on one time frame will appear on all of them that's how this is happening okay you can google that too and there's a lot of uh tips you can get off of youtube for a
trading video most of my tips i actually got from my students Which i appreciate because they're more fluent with this i came from mt4 and tradestation so i'm a work in progress with uh trading view so so you're gonna drop a vertical line here to delineate a new day at midnight what is the opening price at new york midnight that's this candle and you highlight that and this price Right here that right there if you're looking at the time frame on the hourly that would be the opening price i'm interested in that on a 15
minute time frame or if i'm going to be scalping i'm going to use the five minute chart okay and i'll put two reference points on the five minute chart but for the sake of this discussion just know that That's the actual price i'm looking at and i'm drawing that out in time how far am i drawing it out 11 o'clock in the morning new york local time how do i know my charts gonna look like icts right that's what you're asking you toggle it to new york i don't care where you live i don't care
where you're at in all the different time zones your trading view chart needs to be set to this If you do that your chart will match all the things i'm teaching and the things i'm teaching you to look for will be easier to find okay everything will be streamlined in terms of time of day all right so now we have the buy sell equity pull the daily denomination of midnight new york time and we're going to take a little line segment here and we're going to plot it right on here Now i'm just going to
just rough it because it's basically a little tiny indecisive candle i don't care the difference between the actual open and close it's very minute but i'm going to draw that on here and if you drag your your trend line over to the right if you hold down the shift button it'll keep your trend line straight okay just drop it there and i'll just make this A gray color here now you can annotate that but over time doing it you'll just know that that's what you're anchoring and showing this is the opening price at midnight okay
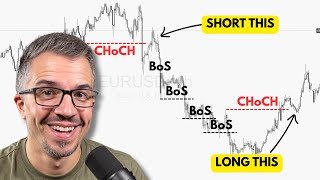
now we have the relative equal highs here we rallied above them once it hits this do we get displacement now we get down to the nitty gritty okay we have a swing low here it breaks down below that and then once It does that does it create an imbalance is there a fair value gap hint nudge nudge you see that all right so we're going to annotate that so inside of this range here we have a fair value gap and i'm gonna highlight this we'll just use this color here now these are probably not the
best colors you're probably Cussing me right now saying why are you using these ugly colors ict that's something just to annoy you so that way you can get more attentive and pay attention because this is a long video already so we're looking at the market wanting to go higher first to go lower and here's that midnight delineation starting a new day we rally up And then we break down so what's the model teach trading when the new york session okay so we're trading the new york session in 4x it's seven o'clock in the morning to
ten o'clock in the morning right there okay so ten o'clock in the morning and seven o'clock so we're looking for a setup that would Be formed within that time frame now you can create killzone windows annotations on your chart there's lots of ways i've done this over the years you can do it whatever way you want to do it inside center and we'll make it black and [Music] There you go so the new york kill zone it runs up into that runs the highs and we want to see a displacement to the downside we get
it right there okay so now you have this area here and then you would put your order in right there what time is that it's 10 o'clock so you put your limit order in to sell short right at that price right there or Plus one pip period and your risk is going to be above this high the imbalance is really stretched out you can use that as your stop if you're really concerned you can put your stop above the swing high but whenever you have a big range like that my stop can place right there
so your stop would be here And you're going to go short here that's the minimum expectation using the 15 minute timing frame but we're going to split the 15 minute time frame down into five-minute intervals okay so we're gonna look inside this range here and see if it's advantageous for us to go down into a five-minute chart and does it have a fair value gap in that all right so we're looking at the five-minute chart now and it's that Shaded area here so it's using this specific candle or that low and we're looking inside this
range right here okay so it's this decline we're looking at does it have fair value gap well we have this small one right in here see that we have this stretched out one here yes and then we have all this running here Where it has a small little fair value got so now think about what's been shown on that 15 minute time frame we have a minimum threshold of at least reaching into this low okay remember i showed you on the 50 minute timeframe that inbounds so it needs to get up into that okay so
i'm answering the question that i saw or it really wasn't a question it was someone trying to make a point that Was i showing something incorrectly by showing a higher time frame fair value gap because wouldn't the smaller time frame fair value got formed before the higher timing frame no it never works like that the higher time frame imbalances are going to be parent to the subordinate smaller time frames okay the parent okay is this 15 minute time frame Imbalance so it needs to get above that but when it does that we have to look
at the lower time frame below 15 minute time frame which is the beginning stages of our fine-tuned entry of five four three two and one time frames so here we have the five-minute chart we have an imbalance right here and then we have that smaller one right in here and all the way up to this price point Here we could factor that in but it's not likely to get up there so we can look at what this level here that is the minimum expectation you can put a cell limit order there to go short or
you can fine-tune this to rebalance all up to here right there in other words it would look Like this this would be your imbalance on the five-minute chart and if it traded up into that right there okay you know what you could use any tank any specific price in this range here you can pick this is where the unique style for you comes in if you get greedy You may not get your fill so i'm teaching you the low threshold entry but that always will give you the highest risk but that higher risk in terms
of number of pips not in terms of the amount of money because that part is always controlled by you the trader you can manage the amount of leverage you're using and it doesn't matter how many pips of risk you have the amount of allocation in terms of the Leverage that you're using in the trade that's the most important thing and that's the most important thing that gets abused most of the time by traders because every time a trader gets in the marketplace their expectations are how can i make the most and they don't necessarily think
about the other side of that sword because if the edge you're trying to chop with Okay or swing if it makes contact with with your target then yes you are profitable but if it comes back and hits you in the head okay you're burying that axe right in your skull so that leverage is going to be counterproductive to you it's going to hurt you at that point it's not going to be beneficial to you it's going to harm you so I'm teaching you the low threshold entry but i'm also teaching you in addition to that
i'm showing you how to build an additional perspective that helps you find the better entries that allows you to shorten the number of pips or points if you're trading with the index futures okay but long story short this would be your range you can work within and it trades up into that secondary fair value gap now some Of you might say well what happens if i put a limit up here well that would be obviously a stellar entry but you don't necessarily need that okay why i like this one is because if you look at
the 15 minute time frame it was like this that was the range okay so if we go up in that range to the upper end of it look over here what do we have all three of these candles Here one two three the order block begins with this candle's low it's one two three candles making one consecutive bearish order block some of you are commenting in the section of the video saying i thought i understood order blocks now i'm confused because you're hearing People parrot what i've said in certain circumstances and they don't understand what
an order block is okay this is why i get upset when people try to teach what they heard me teach about one or two times and the buzzword is what's being tossed around so that way people can sell their courses and get clicks on their videos You have no idea learning about order blocks from anybody else on youtube i'm gonna make it very plain and make a blanket statement right there i'm not trying to hurt anybody's feelings i know a lot of you out there that try to talk about order blocks you have a lot
of respect for me but i'm trying to correct you because i know you have a large audience and some of you have a very large audience and You're doing things that are not accurate okay so i know you're watching my videos that way you'll correct what you're doing so that way your viewers won't be harmed or they won't use something that's done incorrectly and dubbed as my order block and if they have hardship or difficulty doing it it's not going to be a tribute to the Concepts being affected because they are effective it's just they
haven't been taught properly okay it's easy to talk about in hindsight but it's real hard to do it in real time unless you know what you're doing so the logic is we we ran up into this daily fair value gap that's what this level is up here this red line was does relative equal highs on the hourly chart remember that And you're probably going to need to watch this video a few times because i've gone through a lot already but i'm breaking down the market and this run here is the run into that imbalance and
above the relative equal highs so this is the bearish order block it's the consecutive run on this time frame the five minute chart It does not need to get up into this last up closed candle before the down close because that's what everybody says in order block is it is not that notice it doesn't even get up to that does it why because what i'm showing you here what makes an order block valid it has to have an imbalance without the imbalance There is no order block that's why it's not supply and demand okay there
are specific rules i'm going to cut through candles supply and demand requires fresh zones okay that's nonsense i have no affinity for anything like that i'll cut through fractals and go through and find something over here and still trade on it so it violates the supply and demand theory right there so i that's the Distinction and why i laugh at people that say oh he's teaching really nothing new i'm really teaching you something that no one's talking about unless i talk about it first they're saying what i said and not to sound egotistical i'm not
trying to be egotistical but i i want you to learn it correctly folks okay i only want to see you do it the right way because if you do it the right way you Will find the results you're looking for if you don't want to do what i'm teaching you're not going to be consistent you're not going to find longevity and you're going to get frustrated and you're going to think that this stuff doesn't work because you didn't learn it properly from the person that created it the order block is all three consecutive candles the
reason why this last up close candle is not even traded to is Because the higher time frame parent imbalance that 15 minute time frame which is being shown here that range of that low and that candle is high here it stops there so there's no necessity for it to trade up into that last candle so if it trades up into this candle here the bottom one the last one of the three going up that's enough for me and take that over Here and then we have this inbound so in my mind this imbalance is sufficient
we don't need this one and you wouldn't expect that last up close cam to be traded too so this is the ideal scenario that i think the mentorship on youtube should be looking for now as soon as you have this this is one you settle in on what are you met with another little fair value Got right above it so what were the rules that i gave you when it has that in the chart think it is going to be a likelihood that it could trade up in there but your limit order to enter is
down in here because it might not get up here what am i trying to do i'm trying to teach you how to avoid missing trades because a lot of you're going to want to put an order up in here and yes it would Have been filled on this instance but many times you're going to have an order placed at a really overzealous price point that if you nail it it's beautiful but they don't happen a lot it's fleeting it happens once in a while so i'm trying to give you something that allows you to operate
consistently gives you lots of setups that will allow you to practice also back test like i'm showing you here this is how you back test because this has already happened But these are all the things that i'm teaching in this mentorship and i've talked about this level here in my own private group beforehand and you also knew about the bias being bearish on this pair from tuesday's trading or tuesday's episode in this mentorship on the youtube channel okay so we have a break in this low here so there's an internal shift in market structure it's
bearish we have the Imbalance here that's been refined down into the five-minute chart in concert with the bearish order block the lowest down closed candle we've talked about why we're not looking at the last closed candle before the down move so we're cancelling all that misconception and it runs up into the level with the rule i gave you if we settle in on a fair value gap and it has a small one above it expected it might trade up there so your risk has to incorporate That so that's the reason why i'm telling you your
stop-loss could be here yes it might be a little bit too rich for some of you because you want to trade with one pip stop loss a half a pip stop loss there's a lot of guys out there trying to do ultra ultra short term stuff you might be able to pull it off once in a while maybe you know a series of trades but i promise you when you start putting Down size on these trades you're not going to pull that off okay it just isn't going to happen so don't get used to trying
to do it okay plus it's easy to do other things you can walk away from the charts and not be chained to it because if you have a small ultra short stop i don't care how good you are you're gonna sweat it you're gonna be expecting you're gonna get stopped out what happens if it stops me out I'm not worrying about getting stopped out i'm not worried about if the market moves to my stop i'm more interested in the market moving where i think it's going to go where is that that's this level down here
that's the sixth of april's low okay yeah we went lower than that already here let me get this thing out of your way if you take this and move out of the way here we have the an early run at uh five O'clock or so in the morning it made that at 5 25 new york local time in the morning it swept the previous days low so the 6th of april was swept then we rallied up and we hit the level that what our bias called for in other words i'm looking for this level to
be traded to before i go short so i'm not taking anything in london i'm not worried about anything in london because london didn't give me the initial rally higher into this area when Does it go up here it's going up there at 9 30 in the morning new york local time so it hits that level it's at a really rich premium and i know my discount level i'm looking for for targeting so here's the framework the setup we have our market structure shift disqualified all these upper candles here the lower candle that's where you're going
to aim for What's the order block that you trade for michael what's the one what's the right order block how do i pick the right order block i just answered it what is an order block it's a change in the state of delivery the algorithm changes its state of delivery as soon as we get below this candle's open the market starts delivering sell side and then it breaks this swing low so now We have changed gears internally any rally after that is just setting up another run to go lower so in other words this is
a suspect rally okay so this is an intermediate term high swing high because it has the imbalance it should not trade higher than that high that's the reason why i'm telling you you can put your stop loss there see how the rules are coming together i'm not complicating it i'm literally Telling you everything i've taught and i'm putting it into the chart everything was said before it happened and here it is it's the framework it's the logic and i'm teaching you with the great detail that you otherwise would have never learned so i'm taking you
in over top the chart giving you the framework and giving you the logic i'm giving you the what if this what if that conditions okay i'm telling you how to negate Certain order blocks that you would otherwise expect to see it trade to because of different youtube channels or other people trying to teach my stuff and they don't know what they're talking about okay they have no idea what they're doing this setup here gives us a nice opportunity to get short so you could be a seller here on a limit entry so you place your
limit order here and you just walk away from it you let it go Now what happens if it doesn't fill you by 11 30 pull the order that's it don't put it you know good till cancel just pull it because you want to be entering on the day that it creates this because relative equal highs if it doesn't drop off it could come up in a time of day where you won't really want to be there and it could fill you and then keep on running and take out the relative equal highs at a deeper
Pass and then stop you out so it's important to know why the kill zones are there kill zones are when you determine your entry and you place your orders and you walk away you don't need to have your entry filled inside that kill zone window your order idea and your order placement needs to be considered at that time if you can't derive a order placement for setup or trade entry by that time you have nothing to do And that's it you've basically taken no risk on and you have to wait to the next trading opportunity
or trading day and the market obviously starts to break lower and then trades to it here at 245. so at 245 it fills it And that's the end of that so not bad it's 10 20 30 40 pips so there you go 40 pips you don't get the very highest high and it ultimately goes a little bit lower who cares you you've structured a trade that makes sense and it's just a really nice Run up in there and everything's delivered on the basis of the logic and the elements i'm teaching you in this youtube channel
and you can't argue with it it's it's obvious it's so plain to see how these markets are being delivered and if you're one that likes to argue and say there is an algorithm or if you say that these concepts don't work and all that stuff it's because you want some excuse why you can't do it yourself And i don't want any of you to feel that way okay i don't get a high or you know get my rocks off because people stumble and not do well with this because i know why they're not doing well
you're not doing the work that's required that means going through your charts and doing what i just did here every Single day and being passionate about it looking at what it is that has been shown in price action what is it doing what is it not doing the things i've taught you in this lesson tonight is in my mind it's charter level teaching it literally is something that i would Generally reserve for charter members only that means the people that have been with me for a year or more and they're under my tutelage in my
private community so this is a lesson that literally would come from that type of student level but i'm applying it to what you're learning with this model it's applicable To forex it's applicable to bonds it's applicable to gold it's applicable but let me put this because i see a lot of people also saying can you show it in gold gold is one of those markets that is an event driven market okay and what that means is it usually requires some kind of geopolitical or something crazy Causing it to move otherwise it's highly manipulated there's a
lot of stop hunts and then consolidations it's very frustrating okay it's it's not a it's not a market i believe that someone should be aggressively short-term trading i don't think that's the ideal market there's plenty other markets out there that you can do that with And have better you know consistency and longevity now am i saying there aren't people out there that are making money consistently in gold no i'm not saying that i'm saying because i'm speaking to people with the expectation that you're just now learning how to do this i'm aware that there's a
lot of you that are veterans that have been trading longer than the average person coming to my youtube channel But i have to speak in a language that is palatable for a new viewer otherwise i'm gonna speak to and this might be too lofty for a new viewer anyway but it hopefully it will intrigue them to see that there's a rhyming reason to everything i'm teaching and they repeat it keeps happening every single day these signatures repeat so the question is going to be is What are you going to do with this information are you
going to just say okay well this is great but this is too much work so i'm going to look for something else that gives me a moving average crossover or some kind of a bell and whistle to put things on my chart to tell me what to do and then you're basically creating a religious trading style because you're trusting something other than price because What have i shown you here just price there's no indicators here i'm only putting these areas in here with this rectangle to highlight an imbalance i don't have these on my chart
in time you won't either but in the beginning while you're learning it's important to annotate your chart so that when you log them in your study journal that way at the end of the week you go back and look at all the intraday price action then you look at how the weekly chart worked Within that whole panoramic view of intraday daily price action how did it all fit together and by doing that you're literally getting snapshots of every individual day then the daily chart in the weekly chart and how it fulfilled its entire weekly range
when was the high for when was the low formed what was the biggest day of the week what was the framework around that Biggest day of the week of movement and then also breakdown obviously like we're showing you here where trade setups it doesn't make a difference if you didn't trade it everything anybody ever learns is always done by hindsight you want to be a doctor a surgeon guess what you're doing you're working in hindsight you're studying medical journals that about things that took place that you were not there okay you're studying hindsight Don't let
these goobers out there try to discourage you from studying because i'm teaching you how you are going to get better at this you do what i just showed you how to do right here and you do it every single day you're going to develop your own style of keeping notes in your charts i'm not going to do that here because i don't want to make a an example and feel like you have to Do exactly what i said okay what do i mean by that it's to me it's fascinating to see people comment in the
comment section of the videos or they'll send me an email or i'll listen to people that obviously are trained under me and they make videos on youtube i can hear my fingerprints or read my fingerprints in the way they talk they'll say certain things Certain words certain expressions i can i can see my own fingerprints on that this part i always leave empty and i do the same way of teaching even in a private group because i never show them annotations outside of the things i'm showing because Over here you might write an observation about
something that you may want to further investigate that i might not even touch on in this discussion or lecture but it's important to you so you use the space in your chart to write those things down and then you come back to that chart on saturday at the end of the week or sunday if that's the day you're going to do it on and you revisit the entire week and you Walk through the entire week of how it delivered how many pips did it move and how much risk would have been incurred in the trade
so all those things work towards a model that you'll grow accustomed to trusting because you'll have back data and you'll have examples that you've trained yourself to see over time And by doing this your psychological makeup as a trader will be formed with these things in mind so that way when you're watching price action it'll leap off at the chart when it's forming and you'll remember something you saw hundreds or thousands of times before that generally repeat over and over and over again does every single day look exactly like this no but there's a lot
of similarity to the things i'm showing you here that repeat So it's it's a matter of knowing what you're looking for if two bears are walking in the snow one's younger and one's older and they're walking in the snow will both footprints look exactly the same no but you'll recognize they're both bear prints and you'll recognize which one's larger or older and which one's younger so that's what it's like when you're looking at these signatures and price Action they are generally very close to one another in terms of repeating the same type of way but
they're not going to be so identical that they're indistinguishable to the next one like you'll be able to see that that's a different day of trading but you'll still recognize these repeating phenomenon that is so telling In the marketplace but you can't fully appreciate it right now because you're only now just becoming introduced to it and maybe you've watched some of my videos maybe you watched all my videos and you see when i do this and it resonates with you you're like man i can i get it because he's showing it to me but then
you go out into the chart and you try to do it and it just feels like your chart doesn't is organized or it's not so obvious to you What you're looking for that's normal that's how it was for me for a long time in the 90s for a long time i struggled and floundered of trying to figure out what i'm supposed to be looking for i'm teaching you the things that repeat your job is to keep going into the chart annotating them and keeping a a running log a study journal of what the price action
has done and what you're observing you can't get hurt because it's already Happened the moves already happened so you're studying it so what you're creating is the greatest technical analysis book that you're ever going to own and you're doing it in your own words with your own work because when you buy a book what are you getting you're getting snapshots of something they're saying this is the important thing about this particular chapter or the theme of this particular Book i'm showing you how you need to stop buying books there is no books out there except
for the ones i put in that one video that's in my library honestly that's it no other books are necessary in trading in my opinion it's just it's the same garbage that's repeated and rehashed and people are just trying to do a cash grab You're not going to learn anything except for bad habits and flawed logic now when you've created a study journal with thousands of examples and you've been doing it for years you're going to be astonished of how much of a technical analyst you are years from now and you'll be able to see
a lot more setups that you just don't see like There's several opportunities in this time frame or this fractal here on a five-minute chart there's lots of little trades in here i'm not going to go through and pick them all out because this is going to create a thousand different questions and you're going to miss or overlook the very thing i've shown you in this lecture but this is a model that obviously works in this time frame In this pair it's in 4x it's not highly specific only two futures notice that it's pretty clear isn't
it it may not have been clear before i walked through it with you but you learned hopefully a great deal of things tonight you learned a little bit about quarter blocks what makes an order block based on the fair value gap how do you differentiate how you Look at the order block how do you break it down how do you invalidate the certain parts of the order block how do you know it's not going to go in the upper half of the order block or the last up closed candle before it goes down i taught
that tonight so hopefully this has been insightful to you and obviously we'll be back again next tuesday until i talk to you then enjoy your weekend and be safe