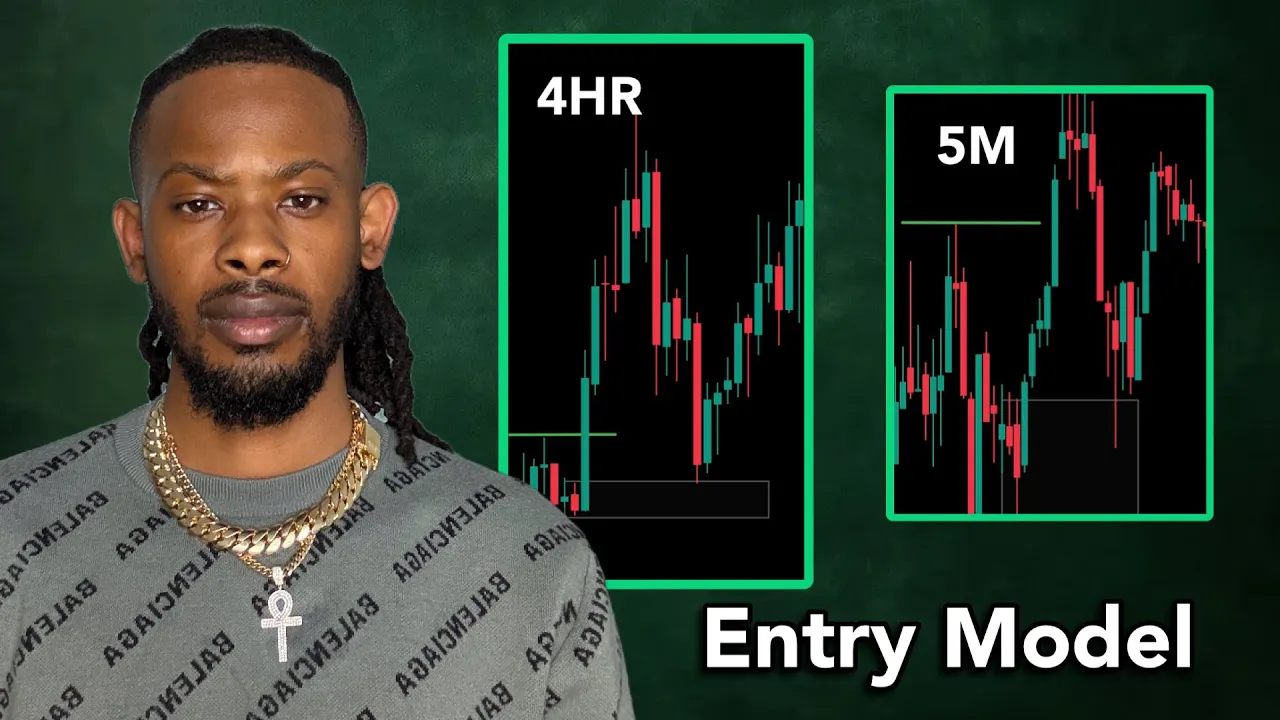
What's good, YouTube? It's your boy Doyle back with another video. Man, today's video I'm going be breaking down um my step-by-step process on determining the direction for the day and really just choosing like my overall bias for the day.
Now, top down analysis is not over complicated. I'm not going to be using fancy terms. I mainly use supply, demand, and breakouts.
But, um I keep it super simple. Um market structure is key and let's just not over complicate this. Okay.
So again top down analysis is very simple. You're looking for higher time frame confluence to go in um on the lower time frame to go in that same direction. So it's really just four steps.
I want to break that down in this video. If you're brand new to trading, I've been trading for 7 years. Um I went fulltime um in 2021 and I'm still full-time right now.
So you definitely want to take some notes. If you already experienced, then I just see you on the next video. But this is really just for educational content.
Like I'm trying to help somebody out. So please take some notes. Now, first step, the first step is price need to be above the 13 EMA on the daily chart.
Now, I use moving averages in my trading. Okay? I've been using these same moving averages since I was trading Fibonacci.
For my older videos, for my people that's been watching for a while, I used to trade FIBS. Um, and I've I've been using these same moving averages even back then. So, this is not nothing new.
This is just like an updated approach going into 2026. So, step one, um, price need to be above the 13 MA on a daily chart. Step two, the 4 hour need to create a some type of demand zone that have a breakup structure.
So, let's go to the 4our. If we go to the 4 hour, we can see that there is a 4-hour demand that also have a breakout structure that broke above this swing. If you don't understand what breakup structure is, you need to go to the basics of higher highs, lower lows.
Um, this is just simple basic market structure 101. When they break a new high, they like to pull back. And sometimes they like to pull back to um demand zones or even take out liquidity, but continue up.
So once I see that they make a new high and it created a gap in front of that 4hour demand zone, I would draw a a zone around this uh bearish candle right there. Now when it gets back to the zone, this is where we're looking for buying opportunities on the 5minute chart once they start taking off from that area. Okay, so first step 13, you need to be above the 13 MA on the daily.
Second step, there need to be a 4hour demand zone. Um, and the third step is that we're looking for the five minute chart to create another demand setup. Um, but we will want to see it have a breaker structure or there's no gaps in this swing and then whatever else they tap within that area, we'll try to take that if that makes sense.
I will break this down a little bit more in case you kind of confused on what I mean by there's no more gaps in this area because once they fill in the gap throughout this whole area, they're going to be ready to go back up. Okay, so let's go ahead and go to the 1 hour. Okay, now the 1 hour, it's not really a lot of information.
Okay, this is a 4hour zone. You can't really do too much with the 1 hour. Let's go to the entry time frame, which is the 5m minute.
Now, what am I looking for in a five minute after they um uh tap this 4hour demand zone? I'm looking for um you know, buying pressure coming coming in immediately after they tap the zone. So, what you want to look for after they tap your your higher time frame zone is a fivem minute demand setup.
Okay? um breaks of structure going the other way or um you could be looking for some somewhat of a liquidity grab, okay, in this area as well. There's a lot of different variations because when it comes to higher time frame zones, it's not going to always be picture perfect.
You know, they tap the zone and then they just start breaking up. It's not going to be perfect like that, but the main thing that that you want to focus on is where is the breakup structure or other other traders call call it a change of character. You just want to see somewhat of a breakup structure.
Now, um me personally, how I would approach this day if it tapped the 4-hour demand zone is I would put a 5m minute demand zone right here. Now, when when you're drawing out your supply and demand zone, you want to focus on the swing that taps the zone, which is this area. Now, when they came back to this 5minute demand zone, they filled in the gap for this whole entire swing.
So, now they're ready to go. Okay, just like I said before, if they fill in the whole gap in that entire swing, then there is no gaps to fill, they're probably ready to go. Now, if this was just too risky of a trade because this would be my entry right here.
Once it tapped the zone, give the break of the candle. This would be my entry right here. Now, say if you just really just don't like this setup, okay, you will wait for them to break structure.
Okay, so once they break structure, breaking this swing, they form another demand zone. Okay, you can get in aggressive right here. You can pull out a fib if you want to.
Like, you know, it's a lot of ways to, you know, get into this trade, but I'm looking for higher time frame zones to get some sort of a directional bias on my lower time frame. Okay. Now, um this is very very simple, but I have another example that I want to talk about because it's going to be some days where there the the price action on the five minute is not going to look as beautiful as this.
Okay. All right. So the second example is going to be for a sell opportunity.
So it's essentially the same thing. We're just doing everything the opposite way. So step one, price need to be trading underneath the 13 EMA on the daily chart.
Okay? So instead of looking for buys where we were looking at the daily chart above the 13 MA for sales, we're looking for price to be underneath the 13 EMA on the daily. The second step is we're looking for a 4hour supply that have a breaker structure.
Okay? Okay. So, let's go to the 4 hour.
And we can see that we have a 4hour supply right here. And we're also Let me stretch these candles cuz we want to make sure that we are accurately drawn up our zones. So, it looks like we have two 4hour supply zones.
Yeah, they're not perfectly. There's a small There's a small gap in between that candle right there. Very, very small.
But it's there. It's in between these two boxes right there. That's where the gap.
So, this right here, cuz you have to zoom in on these candles. We have two 4hour supply zones. We don't know which one is going to hold.
We just have to prepare for it. Okay. So, let's fast forward.
Okay. Now, we're looking for the 1 hour to either scale down this 4hour zone on the 1 hour or we're just going to have to wait until we see a change of character or a breaker structure going to the downside on our entry time frame. Okay, so let's go to the 1 hour.
Okay, and the 1 hour, yes, you can scale down this zone on the 1 hour. So, that's even great. That's even more confluence.
Okay, so this one, unlike that first example, this one actually can get scaled down on the 1 hour. So, that's that's great. Now, we're going to go to our entry time frame to wait for us to see some sort of supply zone being created um EMAs to cross downwards on our entry time frame.
So, let's go to the 5m minute. And what are we looking for on the 5m minute? We're looking for structure to slow down at our 4our supply zone and start doing this.
That's what we're looking for on our entry time frame. Now, if we look at this example, this is a 4hour supply zone. That horizontal line is from the 1 hour.
And we can see that we have a breaker structure right there. We have another breaker structure right here. And we have these little minor breaker structures right here.
But these two are important because again, we're coming from an uptrend on our entry time frame. But then we start getting two breaks of structure going to the downside. And what do they do after they break structure on this first uh this first swing and the second swing?
They create another supply zone right here. Okay. Now confirmation to get going for a sale is the 13 EMA and the 50 SMA crossing.
That is extra confluence to go for a sale. Your entry will be right here for a sale. Stop loss will be right there.
And you can go for a one to two or one to three or you can just go for a one to one. Really up to you. But um this is something that I'm looking for as far as a directional bias on my entry time frame.
So again, we came from the 4hour supply. Okay. The daily is underneath the 13 EMA.
Um the 1 hour was able to scale down from that 4 hour. And then we go to our entry time frame which is the 5m minute. And we're looking for breaks of structure.
We're looking for EMAs to cross. Okay, that cross is very important because it's showing you that sellers are starting to step in and um be in control of this market. So just like the buys, we saw the the 13 and the 50 cross upwards and it created a demand and it's going to do the exact same thing for sales.
So, um hopefully uh this has helped you so you can understand like directional bias on the lower time frame versus the higher time frame. Um market structure is key. If you don't understand market structure, if you don't understand um higher highs and higher lows, then you're going to be confused on the direction.
I use moving averages as a guide, but market structure is always going to be um over these indicators. So, um hopefully this helped you. If you're brand new, definitely add this to your arsenal that you're already using.
Um, you could like this is like information that you can use with extra strategy. So, you could add to, you know, this little model that we're looking for. So, let's let's break down this again one more time before we um end this video.
Step one, we're looking for price to be above the 13 MA on the daily for buys or for sales, we're looking for price to be underneath the 13 MA on the daily. Okay, we're looking for the 4 hour to have a higher time frame uh supply and demand zone. On the 4 hour, um we do want it to be scaled down on the 1 hour, but if it doesn't, that's fine, too.
And on a fivem minute, we're looking for a breaker a breaker structure going in the same direction as that 4hour supply zone or 4hour demand zone. Okay? And we're looking for the five minute to also create the same type of setup going in the same direction as the 4 hour.
Okay, hopefully that doesn't confuse you. Please re-watch this video if you are confused on like, okay, what do you mean by this? And um yeah, give me a like if you want me to do more videos like this so people can understand that supply and demand, it's a lot of layers to it.
It's not just, you know, break a structure, come back to the zone. We're looking for multiple things to uh get the odds in our favor of winning these trades. So that's all I got.
Peace and love. I'm out. Hey, hey, hey.