here at chart Prime we have made a lot of indicators over the years that can be combined in almost millions of ways from Trend following tools to screeners we've made it all we often watch you all create fascinating strategies combining features we've produced but we thought we'd show you a strategy today that we love combining our 100% free indicators that you can Implement into your trading right now today cleanly see RSI from all time frames see the strength and gain unique insights into the market using a one-of-a-kind Trend following indicator and he breaks on key
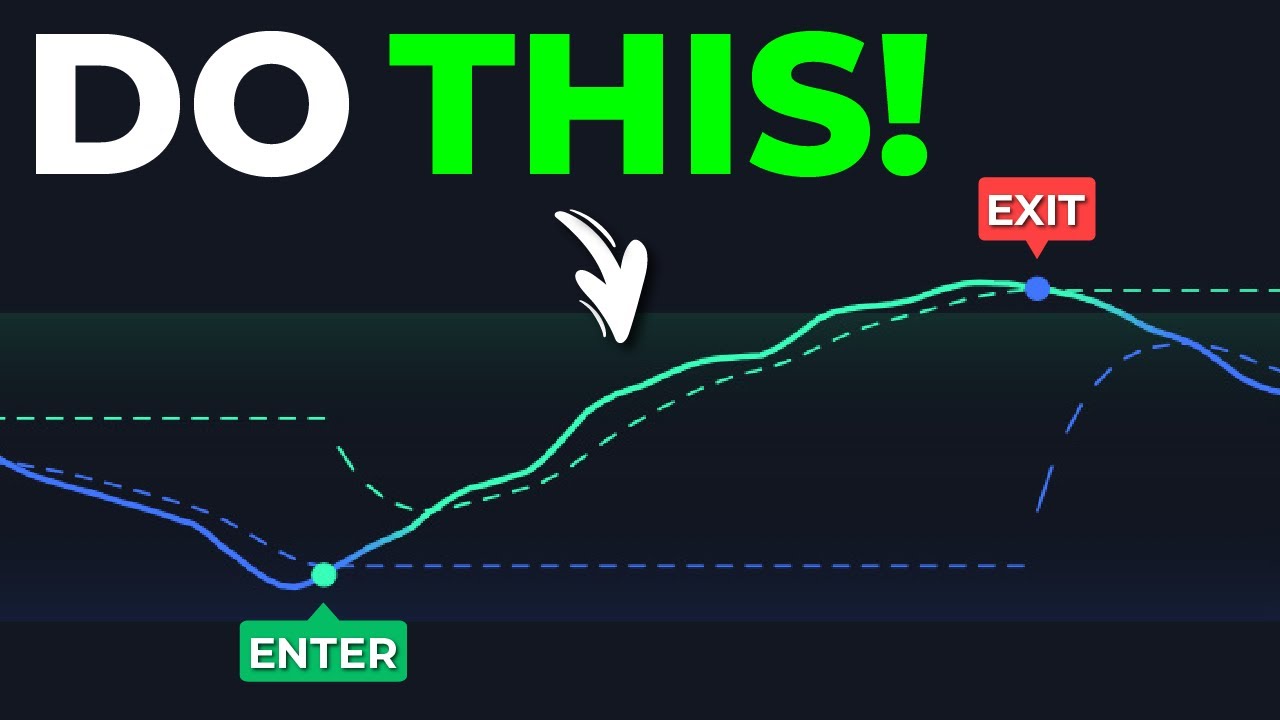
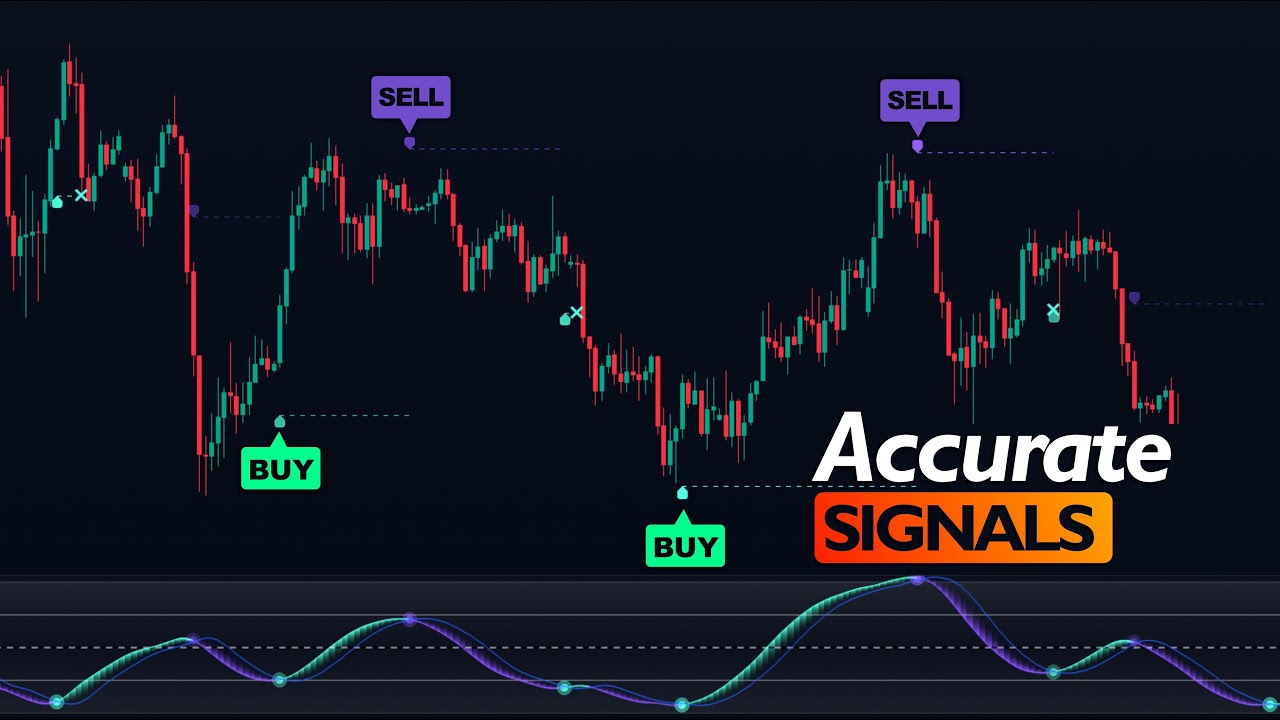
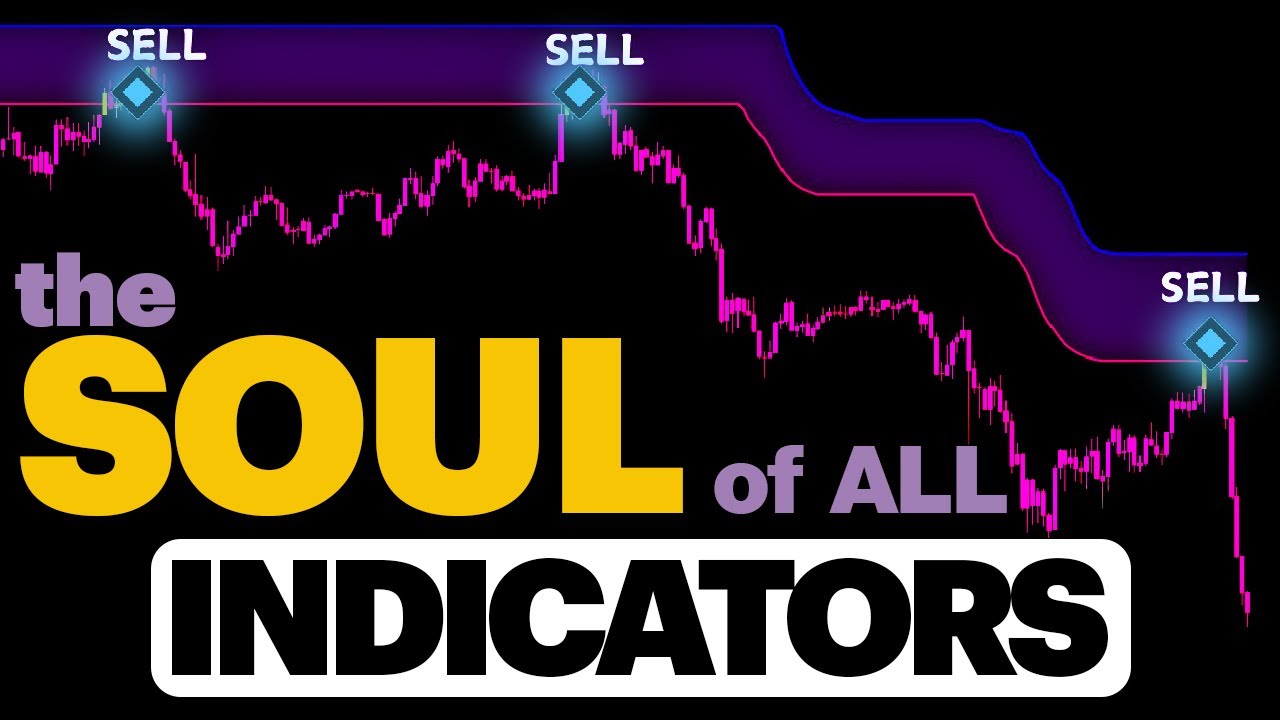
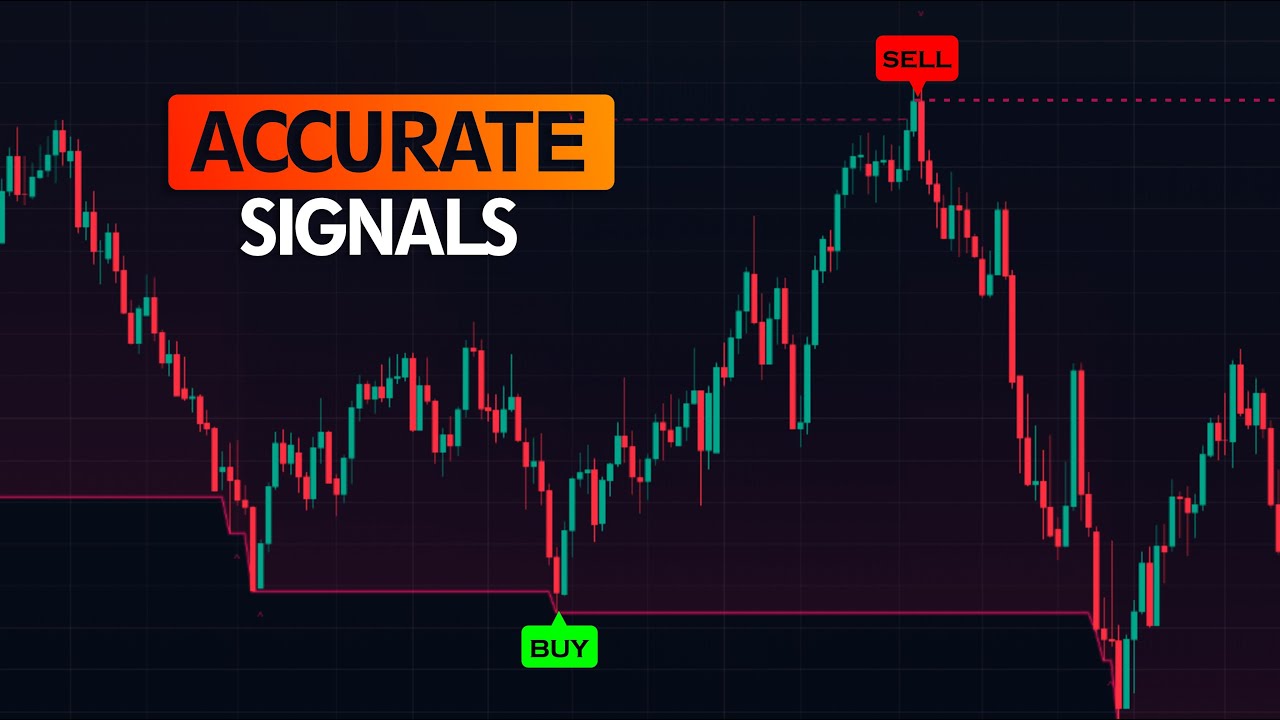
time frames all unlocked just by taking part in the chart Prime trading contest these limited edition tools are sure to give you an edge in the market and help your trading stand out from the crowd simply sign up to the trading contest and get trading to receive your free indicators and $30 signing bonus for this strategy it's a powerful combination of trend following tools firstly we have our famous linear regression oscillator once loaded we want to focus on our signals which are the triangles displayed by the indicator the turquoise triangles are bu signals and the
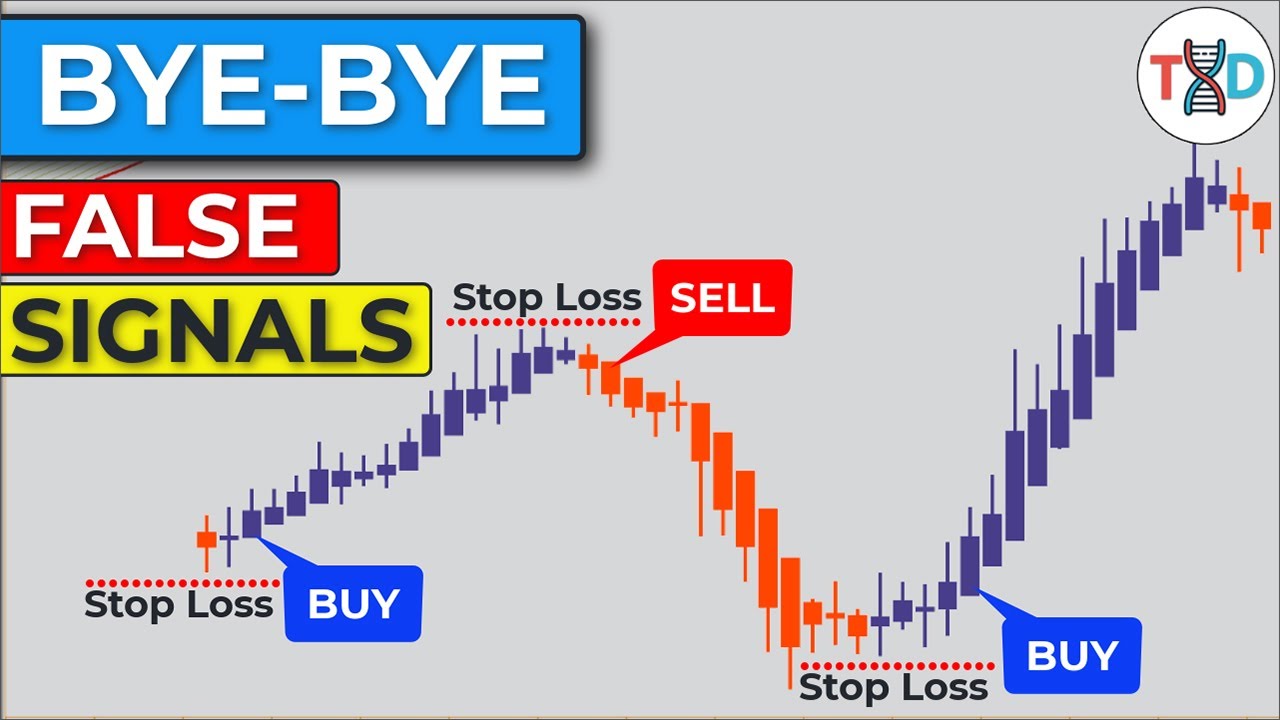
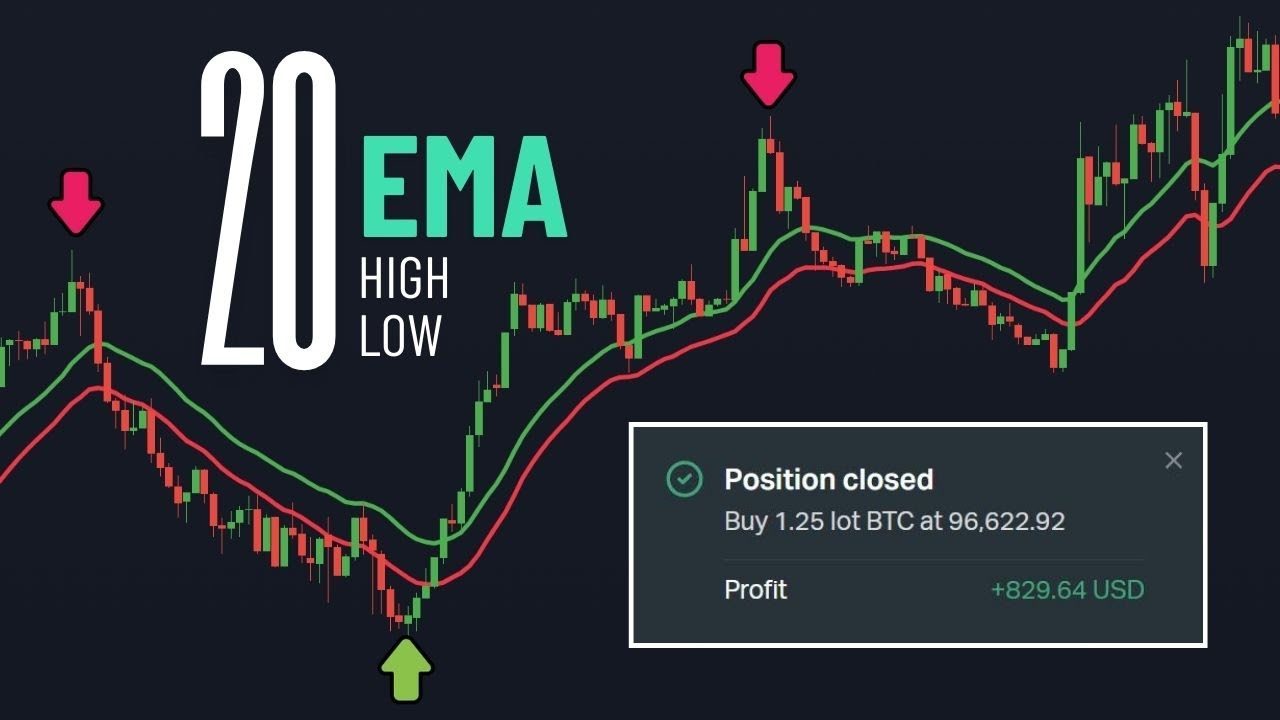
hollow blue signals are the sell signals we also will be wanting to load the multi dsma for extra Trend confirmation when this is blue the market is in the confirmed uptrend after scanning multiple data points and when it's orange the market is in the confirmed downtrend so the strategy is very very simple when we get a Buy Signal from our linear regression ression oscillator and the multi dsma is blue we will take a long position and when we get a sell signal and the multi dsma is orange we sell or take a short position let's
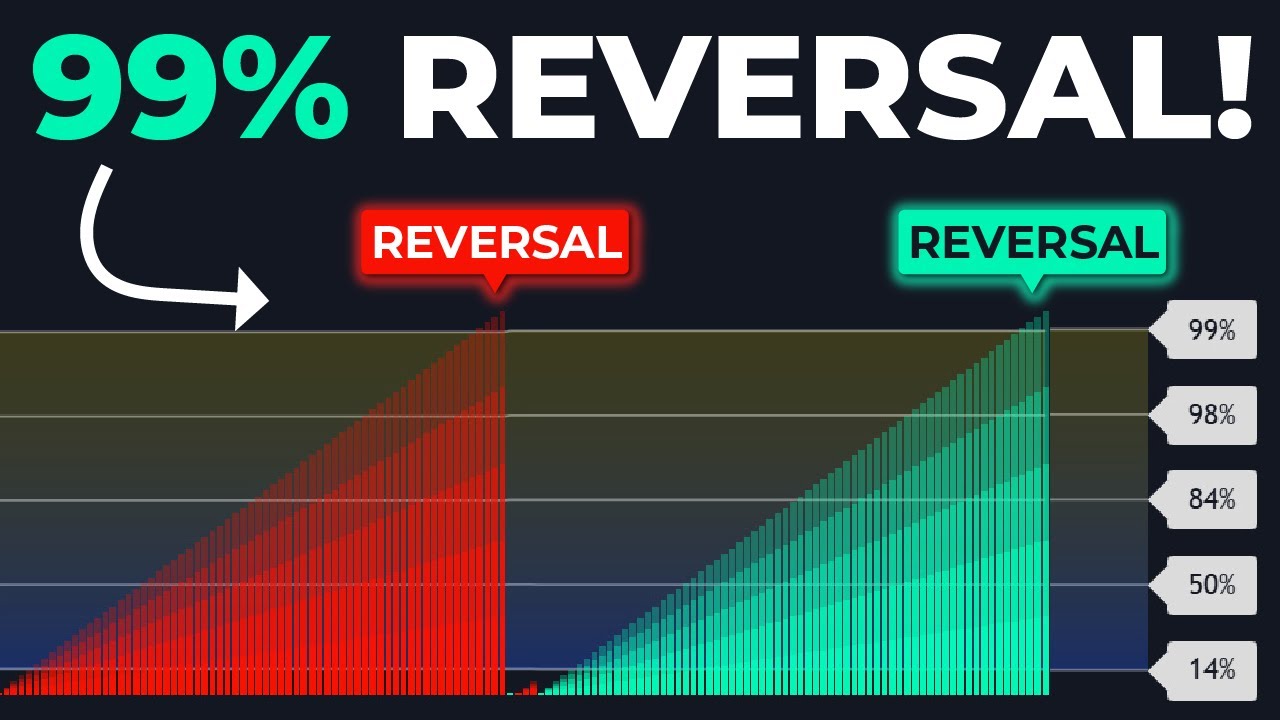
take a look at an example here we are in an uptrend as shown by our multi dsma we see a sell signal however we ignore this this is Then followed by a Buy Signal here we of course enter our long position because our indicators are in agreement the price then climbs now how do we know where to take profits the linear regression oscillator also tells you when the price might reverse as labeled by reversion on the chart when we see this it could be a great time to take profit and in this example it's a
perfect place to exit our trade Traders can also use any other indicators they wish to take profit or take profits on set percentage gains let's take a look at another short example here we enter a confirmed downtrend and we get a sell signal we open a short and the price continues to go down we then see a bullish reversion label which suggests it's the best time to close the trade and we take our profits for chart brand Pro users you of course have tons of powerful Trend following tools to combine such as our Trend signals
and dynamic reactor and take profit signals which when combined can create an even lower lag system for entering and taking profits in the market but back to our strategy here for scalpers and those who enjoy faster entries and exits you can open the multi- dsma settings and increase the sensitivity and you'll also want to reduce the length in the linear aggression oscillator settings for swing Traders the opposite of course applies allowing you to trade smoother Market moves with even less noise using two layers of trend following confidence can be a massively powerful technique as they
might have varying approaches to visualizing the market trends so if you want to use these indicators 100% free you can add them to your chart by searching for multi dsma and linear regression oscillator and if you want to see more strategies like this don't forget to subscribe and join our Discord [Music]


![FREE Best Tradingview Indicator for 2025 [Best Buy Sell Indicator Tradingview]](https://img.youtube.com/vi/0ZzLlA9NFxo/maxresdefault.jpg)